First-principles studies of the phase transitions in Fe-Si alloys

Author: Koshkin A.B., Zagrebin M.A., Sokolovskiy V.V., Buchelnikov V.D.
Section: Физика
Article in issue: 1 т.13, 2021.
Free access
In this paper, the structural and magnetic properties of Fe100-xSix alloys (10 ≤ x ≤ 25,0 at. %) were calculated. The structural phase transition temperatures for the crystal structures A2, B2, and D03 were estimated from the geometry optimization. The Curie temperatures were calculated in a molecular-field approximation using the constants of magnetic exchange interaction calculated ab initio. For all the considered concentrations, with the temperature increase, we observed the structural transitions from the ordered cubic phase to a disordered structure, with the intermediate stage of a partially disordered state. The ferromagnet-paramagnet transition was observed for all the compositions, though in various crystal phases.
Phase diagram, first-principles calculations, molecular-field approximation
Short address: https://sciup.org/147234123
IDR: 147234123 | UDC: 537.9 | DOI: 10.14529/mmph210106
Первопринципные исследования фазовых превращений в сплавах Fe-Si
В работе представлены результаты расчетов структурных и магнитных свойств сплавов Fe100-xSix (10 ≤ x ≤ 25,0 ат. %). Из геометрической оптимизации для кристаллических структур A2, B2 и D03 оценены температуры структурных фазовых переходов. Температуры Кюри оценивались в приближении молекулярного поля с использованием параметров магнитного обменного взаимодействия, рассчитанных ab initio. Во всем рассматриваемом интервале концентраций с ростом температуры происходят структурные переходы из упорядоченной кубической фазы в частично упорядоченную, а после и в полностью разупорядоченную. Переход ферромагнетик-парамагнетик наблюдается для всех составов, однако в разных кристаллических фазах.
Text of the scientific article First-principles studies of the phase transitions in Fe-Si alloys
Fe-Si alloys are drawing the interest of both experimentalists and theoreticians due to their possible applications in spintronic, optoelectronic, and thermionic devices [1–4]. For example, Fe3Si is a promising material for a ferromagnetic electrode in spintronic devices, which use magnetic tunnel junctions [1]. Also, Fe3Si is a ferromagnet with a Curie point of around 800 K, and, as a thin film, it has a spin polarization of 45 % [2]. Fe5Si3 is a metallic ferromagnet at room temperature, so it is also a promising material for spintronics [3]. β-FeSi 2 , a narrow gap (~0,85 eV) semiconductor, was used to create a lightemitting diode [4].
With the increasing concentration of Si in Fe-Si alloys, its spontaneous magnetization gradually decreases [5]. For small Si concentration, this decrease is proportional to Si concentration. However, the Mossbauer spectroscopy [6] found the strong dependency of Fe magnetic moments on the nearestneighbors’ atomic environment for larger Si concentrations. Moreover, Si substitution results in a considerable decrease of the magnetic anisotropy, which makes Fe-Si alloys magnetically soft materials with potential application in the electric energy industry [5, 7].
In this work, we investigated the structural and magnetic phase transitions of Fe100– x Si x alloys (10 ≤ x ≤ 25,0 at.%) using ab initio calculations.
2. Simulation details
For investigating the structural and magnetic properties of Fe100– x Si x alloys (10 ≤ x ≤ 25,0 at. %), we used SPR-KKR (a spin-polarized relativistic Korringa–Kohn–Rostoker) code [8], which is based on the Korringa-Kohn-Rostoker Greens function method. Geometry optimization was performed for experimentally observed Fe-Si structures: the ordered phase D0 3 (symmetry group Fm 3 m no. 225, BiF 3 -type structure), the partially disordered phase B2 (symmetry group Pm 3 m no. 221, CsCl-type structure), and the disordered phase A2 (symmetry group Im 3 m no. 229, α-Fe-type structure). The equilibrium lattice parameters a 0 were obtained from the dependency of total energy E 0 on the cell volume with a fitting to the Birch–Murnaghan equation of states. For the exchange-correlation potential, we used the general gradient approximation in the form of Perdew–Burke–Ernzerhof functional [9]. The obtained equilibrium lattice parameters were used to calculate the exchange interaction parameters J ij via SPR-KKR code. The disorder (both structural and chemical) in phases D03, B2, and A2 was created by the coherent potential approximation [8]. Magnetic exchange interaction parameters were calculated by using the spin-polarized scalar-relativistic Dirac Hamiltonian in the local density approximation (Vosko–Wilk–Nusair
3. Results and Discussion
The geometry optimization showed that the most energetically favorable structure is D0 3 for all considered concentrations Fe100- x Si x . Table 1 presents the results of a 0 calculations for different Si concentrations, obtained via SPR-KKR code. The calculated lattice parameters were obtained for A2, B2, and D0 3 phases. The values calculated via VASP package, a 0 th, [12] and experimentally observed ones, a 0exp, [13–15] are also present. SPR-KKR results are slightly larger than the VASP-calculated and experimental lattice parameters. Also, Table 1 shows that for B2 and D03 phases, the lattice parameter decreases with the increase of Si concentration since Si atomic radius (1,18 Å) is smaller than Fe one (1,26 Å). A2 phase has similar a 0 values for all the considered Si concentrations due to the disordered structure. The discrepancy between a 0exp and a 0 can be explained by the different temperature regimes: the experiments were conducted at room temperature, while the calculations obtained the ground states ( T = 0 K).
Table 1
The equilibrium lattice parameters a 0 (Å) for A2, B2, and D0 3 phases. a 0th is taken from [12], a 0exp – from [13–15]
|
x |
Phase |
a 0 |
a 0 th |
exp a 0 |
|
10 |
A2 |
2,870 |
– |
2,860311 |
|
B2 |
2,865 |
– |
– |
|
|
D0 3 |
5,727 |
– |
– |
|
|
15 |
A2 |
2,870 |
2,8404 |
– |
|
B2 |
2,855 |
2,8264 |
2,848442 |
|
|
D0 3 |
5,708 |
5,654 |
– |
|
|
20 |
A2 |
2,871 |
– |
2,855911 |
|
B2 |
2,842 |
– |
2,837482 |
|
|
D0 3 |
5,680 |
– |
– |
|
|
22 |
A2 |
2,874 |
2,8335 |
– |
|
B2 |
2,836 |
2,8076 |
2,833192 |
|
|
D0 3 |
5,671 |
5,635 |
– |
|
|
23 |
A2 |
2,871 |
– |
– |
|
B2 |
2,832 |
– |
– |
|
|
D0 3 |
5,665 |
– |
– |
|
|
24 |
A2 |
2,872 |
– |
– |
|
B2 |
2,829 |
– |
– |
|
|
D0 3 |
5,659 |
– |
– |
|
|
25 |
A2 |
2,872 |
2,8146 |
2,85511 |
|
B2 |
2,826 |
2,7976 |
2,827252 |
|
|
D0 3 |
5,650 |
5,616 |
5,663 |
1[14], 2[15], 3[13], 4 x = 15,625 at. %; 5 x = 21,875 at. %; 6 x = 25 at. %
Fig. 1 shows the dependence of the difference between the structure total energy and the total energy corresponding to the most energetically favorable phase (D0 3 ) on Si concentration, calculated with the SPR-KKR code. For all considered concentrations, the transition from the ordered D03 phase to the disordered A2 phase through the partially disordered B2 phase was observed. This result is consistent with the calculations with the projector-augmented wave method and periodic boundary conditions implemented in VASP. The discrepancies between a 0 and a 0th could be explained by the difference in structure formation: in this work, we used the coherent potential approach, which gives some averaged structure, while in [12] only one configuration was considered.
Физика
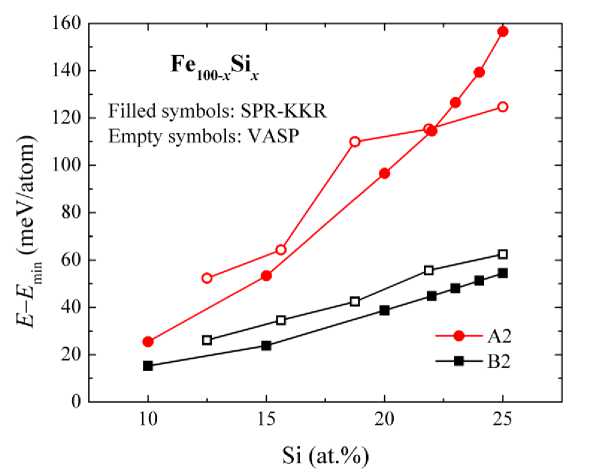
Fig. 1. Dependence of the structure total energy (in relation to the most energetically favorable phase D0 3 ) for A2 and B2 phases on Si concentration. Empty symbols present the results from [12]
By using the energy difference, we roughly estimated the temperature of a structural phase transition, T , from the expression, A E = k B T t , where kB is the Boltzmann constant, NE = E 0 - E min. We used the proportion of 1 meV = 11,60 K.
Fig. 2 presents the dependence of the total magnetic moment (per atom) on Si concentration in Fe 100- x Si x alloys. For all structures, the total magnetic moment per atom decreases with Si concentration increase, which could be explained by the smaller magnetic moment of Si in comparison with Fe. Fig. 2 also shows the experimental results from [13, 16], which are in quantitative agreement with the calculated values. The closest to the experiment are phases B2 and D0 3 . Further, the obtained equilibrium lattice parameters were used to estimate the exchange interaction parameters Ji j , which allowed us to calculate the Curie point TC in the molecular field approximation.
Fig. 3 shows the dependence of the Curie point T C for phases A2, B2, and D0 3 of Fe 100- x Si x alloys on Si concentration. With the rise of Si concentration, TC decreases for each considered phase. Similar results were obtained in the experiments [13, 17]. The qualitative agreement between the calculated and experimental T C could also be noted.
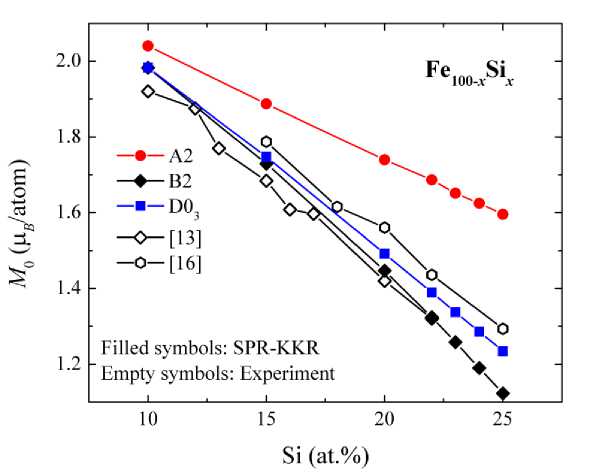
Fig. 2. Dependence of the total magnetic moment (per atom) on Si concentration in Fe 100- x Si x alloys. Empty symbols present the experimental results from [13, 16]
First-Principles Studies of the Phase Transitions in Fe-Si Alloys
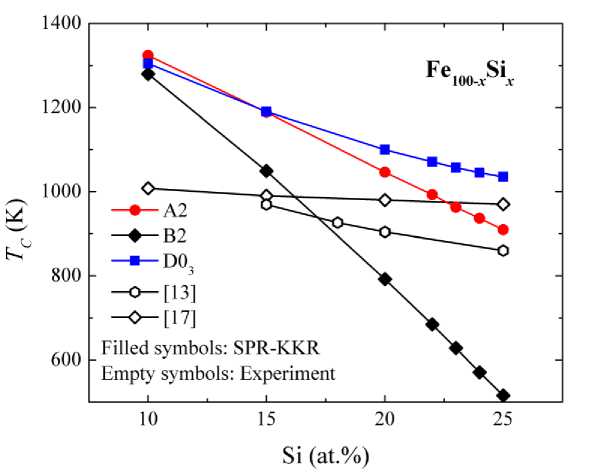
Fig. 3. Dependence of the Curie point T C of Fe 100- x Si x alloys on Si concentration. Empty symbols present the experimental results from [13, 17]
Fig. 4 presents temperatures of Fe 100- x Si x magnetic and structural phase transitions depending on Si concentration. Dashed lines correspond to the Curie points TC of the considered phases. A bold line with pentagons presents the temperature of a transition “paramagnet-ferromagnet” in the energetically favorable structural phase. With the temperature rise, the transition from D0 3 (FM) phase to B2 (FM) and then to A2 (FM) happens at Si concentrations lower than 18 at. %. The same transitions were observed experimentally for Fe90Si10 alloy [18].
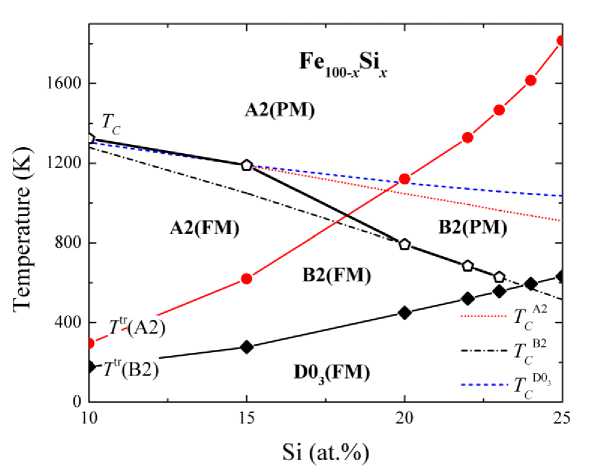
Fig. 4. Т - х phase diagram of structural and magnetic transitions in Fe 100- x Si x alloys
4. Conclusions
Using ab initio calculations, we investigated the structural and magnetic phase transitions in Fe 100- x Si x (10 ≤ x ≤ 25 at. %) alloys. The structural phases A2, B2, and D0 3 were modeled. We found that all these phases are stable, and D03 is the most energetically favorable one for the considered Si concentrations.
Физика
Both the equilibrium lattice parameter and the total magnetic moment (per atom) decrease with the Si concentration increase because of the smaller atomic radius and magnetic moment of Si in comparison with Fe. The obtained results for lattice parameters and magnetic moments agree with the available experimental and theoretical data.
We estimated the temperature of structural phase transitions and showed that these temperatures decrease with the rise of Si concentration, which qualitatively agrees with the experimental data. After calculating the temperatures of the structural and magnetic transitions, we plotted the phase diagram for Fe100- x Si x (10 ≤ x ≤ 25 at. %), which agrees with the available experimental results for Fe-Si alloys.
This work was performed with the support of the Ministry of Science and Higher Education of the Russian Federation within the framework of the Russian State Assignment under contract No. 07500250-20-03 (sections 2 and 3). A. Koshkin gratefully acknowledges the Advanced science research foundation of the Chelyabinsk State University.
References First-principles studies of the phase transitions in Fe-Si alloys
- Mantovan R., Georgieva M., Fanciulli M., Goikhman A., Barantcev N., Lebedinskii Y., and Zen-kevich A. Synthesis and Characterization of Fe3Si/SiO2 Structures for Spintronics. Phys. Status Solidi (A), 2008, Vol. 205, Iss. 8, pp. 1753-1757. DOI: 10.1002/pssa.200723464.
- Ionescu A., Vaz C.A.F., Trypiniotis T., Gürtler C.M., Garcia-Miquel H., Bland J.A.C., Vick-ers M.E., Dalgliesh R.M., Langridge S., Bugoslavsky Y., Miyoshi Y., Cohen L.F., Ziebeck K.R.A. Structural, Magnetic, Electronic, and Spin Transport Properties of Epitaxial Fe3Si/GaAs(001). Phys. Rev. B, 2005, Vol. 71, Iss. 9, pp. 094401. DOI: 10.1103/PhysRevB.71.094401
- Seo K., Lee S., Jo Y., Jung M.H., Kim J., Churchill D.G., Kim B. Room Temperature Ferromag-netism in Single-Crystalline Fe5Si3 Nanowires. J. Phys. Chem. C., 2009, Vol. 113, Iss. 17, pp. 69026905. DOI: 10.1021/jp902010j
- Leong D., Harry M., Reeson K.J., Homewood K.P. A Silicon/Iron-Disilicide Light-Emitting Diode Operating at a Wavelength of 1.5 ^m. Nature, 1997, Vol. 387, pp. 686-688. DOI: 10.1038/42667
- Wijn H.P.J. (ed.) Soft Magnetic Alloys, Invar and Elinvar Alloys. Berlin, Springer, Landolt-Börnstein-Group III Condensed Matter, 1994, Vol. 19, no. 1, pp. 33-143. DOI: 10.1007/b91565
- Stearns B.M. Internal Magnetic Fields, Isomer Shifts, and Relative Abundances of the Various Fe sites in FeSi alloys. Phys. Rev, 1963, Vol. 129, Iss. 3, pp. 1136-1144. DOI: 10.1103/PhysRev.129.1136
- Shin J.S., Bae J.S., Kim H.J., Lee H.M., Lee T.D., Lavernia E. J., Lee Z.H. Ordering-Disordering Phenomena and Micro-Hardness Characteristics of B2 Phase in Fe-(5-6.5%)Si Alloys. Mater. Sci. Eng. A., 2005, Vol. 407, Iss. 1-2, pp. 282-290. DOI: 10.1016/j.msea.2005.07.012
- Ebert H., Ködderitzsch D., Minar J. Calculating Condensed Matter Properties Using the KKR-Green's Function Method-recent Developments and Applications. Reports on Progress in Physics, 2011, Vol. 74, no. 9, pp. 096501. DOI: 10.1088/0034-4885/74/9/096501
- Perdew J.P., Burke K., Ernzerhof M. Generalized Gradient Approximation Made Simple. Phys. Rev. Lett., 1996, Vol. 77, Iss. 18, pp. 3865-3868. DOI: 10.1103/PhysRevLett.77.3865
- Vosko S.H., Wilk L., Nusair M. Accurate Spin-Dependent Electron Liquid Correlation Energies for Local Spin Density Calculations: a Critical Analysis. Canad. J. Phys., 1980, Vol. 58, no. 8, pp. 1200-1211. DOI: 10.1139/p80-159
- Anderson P.W. Theory of Magnetic Exchange Interactions: Exchange in Insulators and Semiconductors. Solid State Phys., 1963, Vol. 14, pp. 99-214. DOI: 10.1016/S0081-1947(08)60260-X
- Zagrebin M.A., Matyunina M.V., Koshkin A.B., Buchel'nikov V.D., Sokolovskii V.V. Ab initio Studies of Phase Transformations in Fe100-xSix. Physics of the Solid State, 2020, Vol. 62, no. 5, pp. 739743. DOI: 10.1134/S1063783420050327
- Varga L.K., Mazaleyrat F., Kovac J., Greneche J. M. Structural and Magnetic Properties of Me-tastable Fe1-xSix (0.15
- Miraghaei S., Abachi P., Madaah-Hosseini H.R., Bahrami A. Characterization of Mechanically Alloyed Fe100-xSix and Fe83 5Si135Nb3 Nanocrystalline Powders. J. Mater. Proc. Tech., 2008, Vol. 203, Iss. 1-3, pp. 554-560. DOI: 10.1016/j.jmatprotec.2007.11.064
- Farquhar M.C.M., Lipson H., Weill A.R. An X-ray Study of Iron-Rich Iron-Silicon Alloys. Journal of the Iron and Steel Institute, 1945, Vol. 152, pp. 457-472.
- Fallot M. Ferromagnetisme des Alliages de Fer. Ann. Phys, 1936, Vol. 11, no. 6, pp. 305-387. DOI: 10.1051/anphys/193611060305
- Shyni P.C., Perumal A. Structural and Magnetic Properties of Fe100-xSix (0 < x < 40) Nanocrys-talline Alloy Powders. IEEE Transactions on Magnetics, 2014, Vol. 50, no. 1, pp. 1-4, Art no. 2101904. DOI: 10.1109/TMAG.2013.2278555
- Kubaschewski O. Iron-binary Phase Diagrams. Berlin, Springer, 1982, 185 p. DOI: 10.1007/978-3-662-08024-5
