Fish Image Classification by XgBoost Based on Gist and GLCM Features

Author: Prashengit Dhar, Sunanda Guha
Journal: International Journal of Information Technology and Computer Science @ijitcs
Article in issue: 4 Vol. 13, 2021.
Free access
Classification of fish image is a complex issue in the field of pattern recognition. Fish classification is a complicated task. Physical shape, size, orientation etc. made it complex to classify. Selection of appropriate feature is also a great issue in image classification. Classification of fish image is very important in fishing service and agricultural field, fish industry, survey applications of fisheries and in other related area. For the assessment and counting of fishes, classification of fish image is also necessary as it can save time. This paper presents a fish image classification method with the robust Gist feature and Gray Level Co-occurrence Matrix (GLCM) feature. Noise removal and resizing of image is applied as pre-processing task. Gist and GLCM feature are combined to make a better feature matrix. Features are also tested separately. But combined feature vector performs better than individual. Classification is made on ten types of raw images of fish from two datasets -QUT and F4K dataset. The feature set is trained with different machine learning models. Among them, XgBoost performs with 90.2% and 98.08% accuracy for QUT and F4K dataset respectively.
Fish image, classification, Gist, GLCM, Boosting ensemble, XgBoost
Short address: https://sciup.org/15017767
IDR: 15017767 | DOI: 10.5815/ijitcs.2021.04.02
Text of the scientific article Fish Image Classification by XgBoost Based on Gist and GLCM Features
Published Online August 2021 in MECS
-
I. Introduction
-
2. Related Works
The images of underwater species are playing a big role in supporting living marine resources including fish abundance estimation, diversity in species, habitats characterization etc. [1]. Underwater autonomous vehicle ROV, AUV are used to capture under water species images. Classifying fishes from the underwater species images are important for the regions where traditional fishing gear cannot sample effectively. Also, it is not possible to classify the image data for a vast region with the help of fisheries. Also, traditional fish recognition process requires a lot of time to classify and count fish. Thus, automated fish recognition is required to reduce latency in fish classification and counting. Besides these, fish species statistical and quality control, assessment of fish population, fish feature extraction, determining physical and behavioral traits of fish, matching pattern and contour are also reasons behind the automated fish detection [2]. In [3], the fish population has been assessed along with ecosystem monitoring. They have also shown that fish description and fish count can also be done with the help of fish recognition. Moreover, fishing is not allowed to the places where the existence of fish is in danger. Thus, the species of those restricted zones can only be identified from fish image classification. Also, there are some poisonous fishes which need to be detected to save people life. Many people die from the failure of detecting poisonous and non-poisonous fishes [4]. There are numerous types of fishes that are exists in the world . Though several fishes are not yet being categorized. Manual classification of fishes is time-consuming and need man power for large number of fishes. Recognition of fishes from image is an standard application of computer vision technology. It can automatically recognize fishes and can distribute fishes with the help of robotic technology. It can save time, man power and makes task easier. This paper shows low dimensional feature based fish image classification.
Though fish detection has numerous benefits and demands, there are some challenges to implement this. These challenges include the noise, occlusion, overlap, distortion, segmentation errors in colored fish images [4]. Before introducing automated fish detection, marine biologists used to identify fishes by detecting meristics, morphometrics, scale morphology etc. [5]. Several methods are exists for classifying fish images [4-10]. Most of them performs with less accuracy. Moreover dataset is also varies. The proposed system in this paper considers two different datasets. The proposed system combines global feature (Gist) and local feature (GLCM). Principal Component Analysis (PCA), Discriminant Function Analysis (DFA), classification tree are the statistical tools of classification which have been used to classify fish image before introducing machine learning methods [6,24,25]. Machine learning methods are used to identify complex and nonlinear data structure, generate predicted models accuracy and reduces the attendant limitation of the statistical methods.
Fish image classification has been found in several studies. In [7], the authors have shown that low-quality and small-scale fine grained fish image data can be handled by upgrading transfer learning and squeeze and excitation networks. The improved transfer learning method shows better accuracy than the current CNN models to classify fish images using five datasets.
Support vector machine has been applied to classify fish images by removing the distortion, noise, segmentation error, overlap, occlusion challenges in [8]. Features were selected based on shape. They have chosen 6 shape features and achieved 78.59% accuracy.
K-means clustering algorithm has been applied with an improved way for fish image segmentation in [9]. K-means clustering is combined with morphological operation to achieve better result. They have extracted fish contour from images using the improved fish image segmentation method.
To understand fish behavior, an automatic fish classification using texture features and shape features have been proposed in [10]. Affine transformation is also applied on the images to extract feature from multiple views. They have applied discriminant analysis on 360 images and achieved 92% accuracy.
In [11], species recognition and their length have been measured using computer vision based approach named CatchMeter. They have used background light to enhance the contrast but erased it for image recognition reliability. Though the system reduces manpower, the system is not capable of measuring anything except length and weight. Also, the high computing power requirement and its high expense does not make the system feasible.
In [3], PCA, DFA have been applied to identify fish species based on Artificial Neural Network (ANN). The system is limited to detect frequent fish species from asymmetric input data. Also, over-train produces high false identification rate.
Classification of fish images followed by segmentation is proposed in [26]. Input image is segmented first to get desired region. Then features are extracted. Low level features are selected. The method cluster images into its own class. Then categorizes into poisonous or non-poisonous fishes, and finally classifies the non-poison fish into its corresponding family. For classification model, decision tree and neural network is used
-
3. Dataset
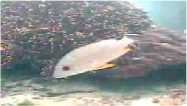
This study is performed on two datasets. One is QUT fish dataset [22] and other one is the dataset used in fish4knowledge (F4K) project[21] . The QUT dataset contains 4411 images of 483 fish species. Images in QUT varies with environment and background conditions. Sunny, rainy, cloudy days are environmental status. Complex and simple backgrounds are involved in the dataset. The F4K dataset is also consists fish images with background under water.. The F4K dataset contains large number of images.
The proposed work is done by selecting ten types of fish species of a total 205 images from QUT dataset. Among them, 164 images are used for training and 41 images for testing. On the other hand, 14463 images from ten species of fishes is also selected from fish4knowledge (F4K) dataset. From F4K, 10847 images are used for training and 3616 images for testing. Selected fish species types are shown in fig.1.
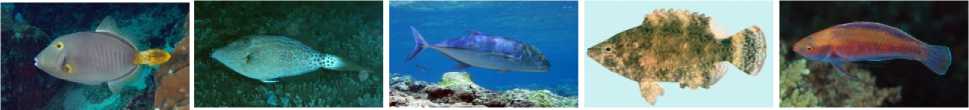
cantherhines_dumerilii caranx_melampygus cirrhilabrus_punctatus
aluterus_scriptus cheilinus_chlorourus
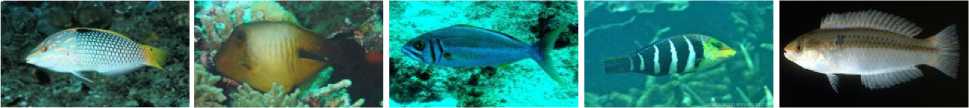
halichoeres_hortulanus amanses_scopas aphareus_furca hemigymnus_fasciatus leptojulis_cyanopleura
(a) QUT dataset
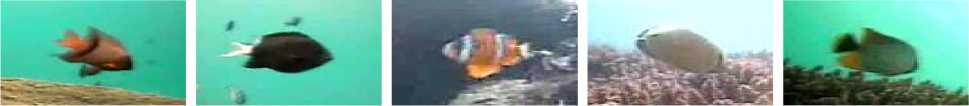
Plectroglyphidodon dickii Chromis chrysura Amphiprion clarkii Chaetodon lunulatus Chaetodon trifascialis
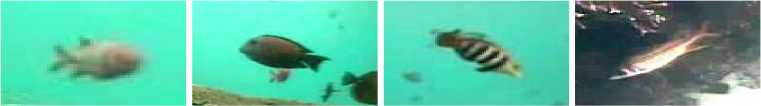
Myripristis kuntee
Hemigymnus fasciatus Hemigymnus fasciatus Neoniphon sammara
(b) Fish4Knowledge (F4K) dataset
Fig.1. 10 types of species from (a) QUT dataset and (b) Fish4Knowledge dataset
Lutjanus fulvus
-
4. Methodology
-
5. Features
-
5.1. GIST
Images may have various effect like noise. So removal of noise is necessary. Median filter is used to remove noises from image. The image is then resized. Gist feature and GLCM feature is extracted individually from images. Fishes have different shapes in their body parts. Single feature cannot represent image in a good way. So a combination of global and local feature is selected so as to perform well. Gist is a computational classic model for recognition of real world scenes. It is supported by very low dimensional feature representation of a scene as the Spatial Envelope [14]. It needed to be stated that Gist is not an acronym; it provides a summary of a scene, so the name is Gist. GLCM provides the texture features of image.The advancing feature of the proposed system is the use of gist feature as glabol feature vector and GLCM feature as local. Images are trained and tested with separate feature and Result is analyzed. Later both features are combined. Combined feature is created by concatenating both features. Then combined feature vector is trained and tested. Result using combined feature matrix shows well output rather than using individual feature vector. Fig. 2 shows steps in proposed system.
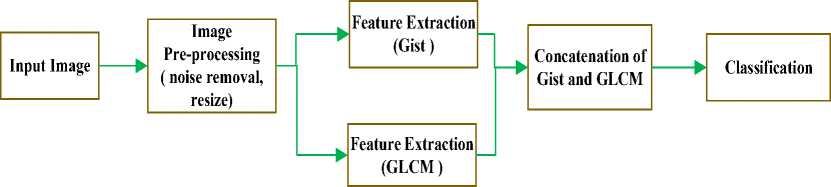
Fig.2. System methodology
Image feature extraction plays an important role in classification. In this research, we are considering GIST and GLCM features. Then both features are combined.
Neuroscientist has experimented on brain functionality at vision task and by monitoring cat brain they found that the visual cortex of brain can identify spatial frequency and orientation more than other image features. Thus, spatial frequency and orientation have been considered as one of the most common image features. GIST feature of an image is extracted by using Gabor filters in different spatial frequency and orientation [12]. GIST descriptor considers relation between the surface outlines, their properties, the shape of image scene ignoring local objects, [13], [14]. Spatial envelope is the scene structure representation with five properties which are naturalness, openness, roughness, expansion and ruggedness which by which human observer can understand it. To examine those properties Fourier transform, Principal Component Analysis (PCA) etc. are used. Different spatial location has spectral components which contributes to these spatial envelope properties. Here, windowed discriminant spectral template (WDST) is a function which describes the contribution and produces parameters at the phase of learning [15]. In GIST descriptor, at first the image is pre-processed by converting it into gray scale. Here, the conversion is done by intensity normalization and locally scaling contrast. The converted gray scale image is split into a grid based on several scales. Series of Gabor filters are used to compute each cell response. Here, all the cell response are the called feature vector. Fig. 3 shows how gist feature is extracted.
gabor filter
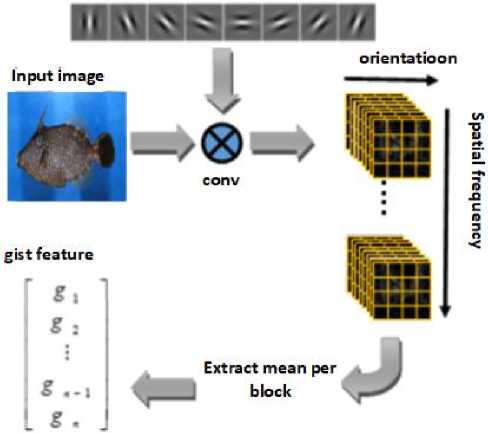
Fig.3. Gist feature extraction method
-
5.2. GLCM- Gray Level Co-occurrence Matrix
-
5.3. Conctenation of feature
-
6. Classification
Statistical texture features are determined by observing the statistical distribution of image pixels combination in a particular position. There are first order, second order and high order statistical texture features based on the pixel count for every pixel combination. Second-order statistical texture feature can be extracted using the Gray Level Cooccurrence Matrix (GLCM) [16]. The method recognizes image patterns by analyzing the frequency of image pixel combination in a certain window [17]. GLCM has been applied in numerous applications including sandstone distribution delineation, fashion e-commerce sites, breast cancer detection etc. [17–19, 23]. Though theoretically the higher order texture feature can show relationship among more pixels, high calculation time and difficulties in interpretation does not make it commonly implementable.
GLCM matrix has G number of rows and columns where G is the gray level numbers in an image. To form GLCM matrix, two pixels x and y with intensity i and j, their distance (dx, dy) and their relative frequency P (i, j | dx, dy) are considered in a particular neighborhood of an image. Also, second order statistical probability values are the element of GLCM matrix which is determined from the changes between i and j in distance d and angle n . Here, the temporary data produced by GLCM matrix using combination of (dx, dy) or (d, n ) are proportional to G. However, GLCM is sensitive to the texture samples size. Thus, G is often reduced to minimize the large dimensionality sensitivity of GLCM.
F Combined = concatenate (F Gist , F GLCM ) (1)
XGBoost is one of the type of Boosting in Ensemble Learning. Ensemble learning is a set of predictors for multiple model to deliver improved accuracy. In Boosting technique the errors formed by previous models are tried to make correct by following models in a way of adjusting weights to the models. `
KNN deals with a rule expecting each information point falling in close to an another is falling in a similar class. In short depending on similarities, a new data point is classified
A forest is made by trees. So with the increasing number of trees make the forest more robust. Similarly, random forest classifier is ensemble method that creates decision trees based on data and then collects prediction from them. At last, best solution is chosen by voting. the over-fitting is reduced here by averaging the result which is better than a single decision tree.
Support vector machine is well known of supervised learning model. The main SVM classifier task is to separate training sample in the higher dimensional space using a kernel function and find an optimal hyperplane with a maximum margin between data of two different classes [20].
Table 1 describes the result achieved by applying various classifier on two dataset individually. XgBoost performs better than other on both datasets. However, gist and GLCM feature individually performs quite weak for the QUT dataset, but in case of F4K dataset, gist and GLCM feature works well individually with the classifiers. Overall, it is clear from table 1 that concatenated feature matrix shows significant result on both dataset. Table 2 shows classification result using XgBoost for QUT and table 3 for F4K dataset
Table 1. Output result of different classifier for QUT and F4K dataset
|
Accuracy (%) |
||||||
|
Classifier |
QUT Dataset |
F4K Dataset |
||||
|
Gist |
GLCM |
Concate (Gist, GLCM) |
Gist |
GLCM |
Concate (Gist, GLCM) |
|
|
Xgboost |
82.9 |
31.7 |
90.2 |
97.5 |
92.4 |
98.09 |
|
KNN |
75.6 |
31.7 |
31.7 |
95.4 |
83.8 |
83.8 |
|
Random Forest |
74.5 |
46.3 |
73.1 |
95.6 |
90.0 |
96.5 |
|
SVM |
60.97 |
29.2 |
29.26 |
95.6 |
87.03 |
92.53 |
Table 2. XgBoost classifier Result for QUT dataset with combined feature
|
Species |
Precision (%) |
Recall(%) |
f1-score(%) |
|
cantherhines_dumerilii |
67 |
67 |
67 |
|
aluterus_scriptus |
100 |
100 |
100 |
|
caranx_melampygus |
100 |
100 |
100 |
|
cheilinus_chlorourus |
100 |
86 |
92 |
|
cirrhilabrus_punctatus |
100 |
75 |
86 |
|
halichoeres_hortulanus |
100 |
80 |
89 |
|
amanses_scopas |
67 |
100 |
80 |
|
aphareus_furca |
100 |
100 |
100 |
|
hemigymnus_fasciatus |
100 |
100 |
100 |
|
leptojulis_cyanopleura |
75 |
100 |
86 |
|
Macro avg. |
90 |
||
Table 3. XgBoost classifier Result for F4K dataset with combined feature
|
Species |
precision(%) |
recall(%) |
f1-score(%) |
|
Plectroglyphidodon dickii |
96 |
97 |
97 |
|
Chromis chrysura |
100 |
100 |
100 |
|
Amphiprion clarkii |
98 |
100 |
99 |
|
Chaetodon lunulatus |
98 |
99 |
98 |
|
Chaetodon trifascialis |
87 |
74 |
80 |
|
Myripristis kuntee |
98 |
92 |
95 |
|
Acanthurus nigrofuscus |
96 |
88 |
91 |
|
Hemigymnus fasciatus |
100 |
84 |
91 |
|
Neoniphon sammara |
100 |
98 |
99 |
|
Lutjanus fulvus |
98 |
94 |
96 |
|
Macro avg. |
98 |
||
The precision rate for few species are comparatively low in table 2. Due to similarity of those fishes, individual precision rate is poor respectively. Rest of the species classes provides higher precision rate. For the QUT dataset, XgBoost provides 90% macro avg rate. In table 3,precison, recall and f1-score shows well performance for all classes.F1-score of all classes are above 90%. Recall is near or above 90% except only one class. The precision rate is also high. The macro avg. rate of XgBoost classifier for F4K dataset is 98%. Proposed system delivers promising result well on both dataset.
A confusion matrix can evaluate the performance of a classifier more finely. Confusion matrix not only shows errors and correct classification, but also helps to analyze error types. Fig. 4 and 5 is the confusion matrix of XgBoost classifier for QUT and F4K dataset correspondingly.
|
2 |
0 |
0 |
0 |
0 |
0 |
1 |
0 |
0 |
0 |
|
0 |
3 |
0 |
0 |
0 |
0 |
0 |
0 |
0 |
0 |
|
0 |
0 |
3 |
0 |
0 |
0 |
0 |
0 |
0 |
0 |
|
1 |
0 |
0 |
6 |
0 |
0 |
0 |
0 |
0 |
0 |
|
0 |
0 |
0 |
0 |
3 |
0 |
0 |
0 |
0 |
1 |
|
0 |
0 |
0 |
0 |
0 |
4 |
0 |
0 |
0 |
1 |
|
0 |
0 |
0 |
0 |
0 |
0 |
2 |
0 |
0 |
0 |
|
0 |
0 |
0 |
0 |
0 |
0 |
0 |
5 |
0 |
0 |
|
0 |
0 |
0 |
0 |
0 |
0 |
0 |
0 |
3 |
0 |
|
0 |
0 |
0 |
0 |
0 |
0 |
0 |
0 |
0 |
6 |
Fig.4. Confusion matrix of XgBoost on QUT dataset with combined feature
|
614 |
0 |
7 |
4 |
2 |
1 |
0 |
0 |
0 |
0 |
|
0 |
912 |
0 |
0 |
0 |
0 |
0 |
0 |
0 |
|
|
0 |
0 |
997 |
2 |
0 |
0 |
0 |
0 |
0 |
0 |
|
1 |
0 |
3 |
641 |
2 |
0 |
0 |
0 |
0 |
1 |
|
2 |
0 |
2 |
7 |
34 |
0 |
1 |
0 |
0 |
0 |
|
9 |
0 |
1 |
0 |
0 |
120 |
0 |
0 |
0 |
0 |
|
5 |
0 |
0 |
0 |
1 |
0 |
43 |
0 |
0 |
0 |
|
5 |
0 |
5 |
0 |
0 |
1 |
0 |
57 |
0 |
0 |
|
1 |
0 |
0 |
1 |
0 |
0 |
0 |
0 |
79 |
0 |
|
1 |
0 |
11 |
0 |
0 |
0 |
0 |
0 |
0 |
50 |
Fig.5. Confusion matrix of XgBoost on F4K dataset with combined feature
-
7. Conclusion
The paper presents a method to recognize fish from images. Described method uses combination of both gist feature and GLCM feature. Combination is made by concatenating both features. Classification is done by XgBoost classifier. In-spite of various of shape, color and also diversity of textures of fish images, proposed method is performed in a good way on two datasets. This study shows that gist and GLCM feature plays significant role in recognizing images. XgBoost classifier provides higher performance in compared with different classifier (KNN, random forest, SVM). This research can be a helping hand in fish industries. In future, different feature extraction method will be tried out to explore.
References Fish Image Classification by XgBoost Based on Gist and GLCM Features
- G. Cutter, K. Stierhoff, and J. Zeng, “Automated Detection of Rockfish in Unconstrained Underwater Videos Using Haar Cascades and a New Image Dataset: Labeled Fishes in the Wild,” in 2015 IEEE Winter Applications and Computer Vision Workshops, Jan. 2015, pp. 57–62, doi: 10.1109/WACVW.2015.11..
- S. Bermejo, “Fish age classification based on length, weight, sex and otolith morphological features,” 2007, doi: 10.1016/J.FISHRES.2006.12.007.
- I. S. Jacobs and C. P. Bean, “Fine particles, thin films and exchange anisotropy,” in Magnetism, vol. III, G. T. Rado and H. Suhl, Eds. New York: Academic, 1963, pp. 271–35
- A. G. Cabreira, M. Tripode, and A. Madirolas, “Artificial neural networks for fish-species identification,” ICES J. Mar. Sci., vol. 66, no. 6, pp. 1119–1129, Jul. 2009, doi: 10.1093/icesjms/fsp009.
- X. Huang and P. X. Huang, “Balance-guaranteed optimized tree with reject option for live fish recognition,” Nov. 2014, Accessed: Mar. 03, 2021. [Online]. Available: https://era.ed.ac.uk/handle/1842/9779.
- G. Lawson, “Species identification of pelagic fish schools on the South African continental shelf using acoustic descriptors and ancillary information,” ICES J. Mar. Sci., vol. 58, no. 1, pp. 275–287, Feb. 2001, doi: 10.1006/jmsc.2000.1009
- C. Qiu, S. Zhang, C. Wang, Z. Yu, H. Zheng, and B. Zheng, “Improving Transfer Learning and Squeeze- and-Excitation Networks for Small-Scale Fine-Grained Fish Image Classification,” IEEE Access, vol. 6, pp. 78503–78512, 2018, doi: 10.1109/ACCESS.2018.2885055
- S. O. Ogunlana, O. Olabode, S. A. A. Oluwadare, and G. B. Iwasokun, Fish Classification Using Support Vector Machine
- H. Yao, Q. Duan, D. Li, and J. Wang, “An improved K-means clustering algorithm for fish image segmentation,” Math. Comput. Model., vol. 58, no. 3, pp. 790–798, Aug. 2013, doi: 10.1016/j.mcm.2012.12.025.
- C. Spampinato, D. Giordano, R. Di Salvo, Y.-H. J. Chen-Burger, R. B. Fisher, and G. Nadarajan, “Automatic fish classification for underwater species behavior understanding,” in Proceedings of the first ACM international workshop on Analysis and retrieval of tracked events and motion in imagery streams, New York, NY, USA, Oct. 2010, pp. 45–50, doi: 10.1145/1877868.1877881.
- C. Svellingen, B. Totland, D. White, and J. T. Øvredal, “Automatic species recognition, length measurement and weight determination, using the CatchMeter computer vision system.,” p. 10.
- R. Rachmadi and I. Purnama, Large-Scale Scene Classification Using Gist Feature. 2014.
- A. Oliva and A. Torralba, “Modeling the Shape of the Scene: A Holistic Representation of the Spatial Envelope,” Int. J. Comput. Vis., vol. 42, no. 3, pp. 145–175, May 2001, doi: 10.1023/A:1011139631724.
- M. Douze, H. Jégou, H. Sandhawalia, L. Amsaleg, and C. Schmid, “Evaluation of GIST descriptors for web-scale image search,” in Proceedings of the ACM International Conference on Image and Video Retrieval, New York, NY, USA, Jul. 2009, pp. 1–8, doi: 10.1145/1646396.1646421.
- I. Sikirić, K. Brkić, and S. Šegvić, “Classifying Traffic Scenes Using The GIST Image Descriptor,” ArXiv13100316 Cs, Oct. 2013, Accessed: Mar. 01, 2021. [Online]. Available: http://arxiv.org/abs/1310.0316.
- P. Mohanaiah, P. Sathyanarayana, and L. GuruKumar, “Image Texture Feature Extraction Using GLCM Approach,” vol. 3, no. 5, p. 5, 2013.
- A. H. Batubara and Rafika, “The Application of Gray Level Co-Occurrence Matrix (GLCM) for Sandstone Distribution Delineation,” 2012, Accessed: Feb. 28, 2021. [Online]. Available: http://archives.datapages.com/data/ipa_pdf/083/083001/pdfs/IPA12-SG-029.htm.
- S. Singh, D. Srivastava, and S. Agarwal, “GLCM and its application in pattern recognition,” in 2017 5th International Symposium on Computational and Business Intelligence (ISCBI), Aug. 2017, pp. 20–25, doi: 10.1109/ISCBI.2017.8053537.
- D. Novitasari, A. Lubab, A. Sawiji, and A. Asyhar, “Application of Feature Extraction for Breast Cancer using One Order Statistic, GLCM, GLRLM, and GLDM,” Adv. Sci. Technol. Eng. Syst. J., vol. 4, Jan. 2019, doi: 10.25046/aj040413.
- Zhang J., Marszalek M., Local Features and Kernels for Classification of Texture and Object Categories: A Comprehensive Study, Journal of Computer Vision, 2006 Springer Science + Business Media.
- https://groups.inf.ed.ac.uk/f4k/
- http://wiki.qut.edu.au/display/cyphy/Fish+Dataset.
- Heba F. Eid, Ashraf Darwish, "Variant-Order Statistics based Model for Real-Time Plant Species Recognition", International Journal of Information Technology and Computer Science(IJITCS), Vol.9, No.9, pp. 77-84, 2017. DOI: 10.5815/ijitcs.2017.09.08
- P. S. Hiremath, Manjunatha Hiremath,"3D Face Recognition based on Radon Transform, PCA, LDA using KNN and SVM", IJIGSP, vol.6, no.7, pp.36-43, 2014.DOI: 10.5815/ijigsp.2014.07.05
- Ali Javed,"Face Recognition Based on Principal Component Analysis", IJIGSP, vol.5, no.2, pp.38-44, 2013.DOI: 10.5815/ijigsp.2013.02.06
- Mutasem Khalil Sari Alsmadi, Khairuddin Bin Omar , Shahrul Azman Noah, Ibrahim Almarashdah, ”Fish recognition based on the combination between robust features selection, image segmentation and geometrical parameters techniques using artificial neural network and decision tree” , (IJCSIS) International Journal of Computer Science and Information Security, Vol.6, No. 2, 2009.
