Force-Directed Method in Mirror Frames for Graph Drawing

Author: Jing Lee, Ching-Hsing Pei
Journal: International Journal of Intelligent Systems and Applications(IJISA) @ijisa
Article in issue: 1 vol.2, 2010.
Free access
The most widely used algorithms for graph drawing are force-directed algorithms. We should modify a hybrid force model that is coupling a traditional spring force model and a novel repulsive force model will be proposed to solve the graph drawing problems in 2-D space. Especially, regular triangle drawing frame can be applied to binary tree drawing problems that on an important contribution to computer science. And apply circle drawing frame to normal graph drawing problems, we get satisfactory and aesthetic criteria graphics.
Graph drawing, force-directed algorithm, repulsive force model, hybrid force model, frame
Short address: https://sciup.org/15010078
IDR: 15010078
Text of the scientific article Force-Directed Method in Mirror Frames for Graph Drawing
Published Online November 2010 in MECS
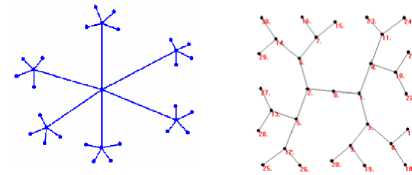
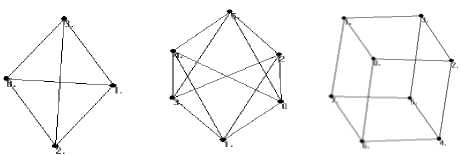
Presenting the data by graphs is an effective way to convey knowledge. Drawing problems including all of the visual relative information construction, it can be regarded as the center of the computer science. Without presenting graphs, it would be hard to imagine and think over such problems, as information construction, database, auto machines, VLSI arrangement or software engineering. And the knowledge involve fields which not only graphs theory, graphs calculation, space geometry and topology, but also visual languages [1], visual perception [2], information visualization [3], HMI [4]and logo design [5]. We know that many of the simple, beautiful, meaningful graphics work can be done by hand, even a simple and relative information set may have infinite way of drawing. Fig. 1 tells that same graph information has three different drawings. Therefore, hand drawing is not easy. Especially when drawing without understanding content of information, even drawing expert may feel thorny. Obviously, hand drawing is a complex and expensive work. Therefore, auto graph drawing tech is needed urgently.
Auto graph drawing techs possess important application in many computer science fields [6]-[7]. And its software often gets a pleasing graph satisfied with a group of objective set. Pleasing objective set often includes small area, vertex equi-distribution, and minimizing the number of edges crossing, etc [6]. Therefore, auto graph drawing problems are actually the
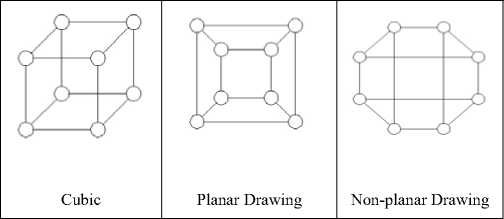
Figure 1. The same graphics data with the layout of the three different patterns ( 8 vertices and 12edges)
multi-objective optimization problem. These pleasing objective set often conflicts and makes automatic layout problems more complex and difficult. Thus, the auto graph drawing software often put one or two comparatively important pleasing objective into optimization objective function according to the needs of the graph in order to decrease the difficulty of auto graph drawing.
Force-directed method is a way that is suitable for draw general graphs. It simulates auto drawing problems by physics, the principle is easy to understand, and equations obtained are suitable for numerical solution. Besides, it can draw high quality graphs.
The algorithm shows that it is a constructive algorithm. The graph drawing problem is managed by two stages. First, the real frame with vertices is transformed into an unbounded frame with an infinite number of vertices by multiple reflection technique. Second, a hybrid force drawing algorithm is used to determine the locations of vertices.
The advantage of our method is better than traditional force-directed method because that it can consider both the area of drawing field and the boundary shape. Therefore, it can not only change the suction and repulsive force between vertices as traditional force-directed method, but transform the drawn graphs by change drawing frame boundary shapes. Thus, if we know the construction of information that we want to draw beforehand, the method could draw meaningful graphs effectively. Our method can find out the symmetrical characteristic of information, and the property is very important to computer graph drawing which primary result shows that this method possess the potential to find out the most meaningful drawing method of unknown graphs. It is very difficult in terms of other methods to do this.
-
II. THE HYBRID FORCE METHOD
A graph G including set V of vertices and set E of edges that define the relationship between the vertices. Vertices often drawn as solid or hollow circle, edge often drawn the line connect two vertices.
There are different styles of representation, suited to different types of graphs or different purposes of representation [8]. We concentrate on the most general class of graphs: undirected graphs, drawn with straight edges. We are concerned with drawing undirected graphs according to some generally accepted aesthetic criteria [9]:
-
1. Distribute the vertices evenly in the frame.
-
2. Minimize edge crossings.
-
3. Conform to the frame.
-
4. Reflect inherent symmetry.
-
5. Make edge lengths uniform.
-
6. Vertices connected by an edge should be drawn near each other.
Our method directly strive the previous four goals.
-
A. The Position of Vertices in the Kaleidoscope
Using the image method, similar to a kaleidoscope we make the vertex extends to infinity.
For the automated two-dimensional drawing, the steps are as follows. First, we appoint a 2D drawing plane, which may be rectangle, regular triangle, circle, or any other possible graphics (The image method will be able to use the map to the infinite plane). We also appoint the position of the vertex you want to draw by heuristic way or wantonly appoint one. By the image method we make drawing plane and vertex mirror to infinite 2D plane. Here we use a rectangle, regular triangle, and circle of three frames to discuss the point position. If others can use the mirror method of mapping to the infinite-dimensional shapes such as semicircle, or a quarter circles, and we can also make use of the aforementioned three kinds of frame to be amend frames that extend to infinity by image method.
-
A.1 Rectangle Frame shape
Fig.1 is a part of graph of rectangle drawing frame that extends to infinity by image method. Let the lower left corner of substrate as coordinates origin; the width and high of rectangle drawing frame is W and H. To present the relation of point Q and its mirror points, this standard of the mirror points on virtual region on the first q columns and the first p rows as ( p , q ) . We can know from the geometrical relationship
x
( p , q )
qW + x ( 0,0 ) for q = even
/q + 1 ) W - x ( 0,0 ) for q = odd
J PH + У ( 0,0 ) for P = even
(1a)
(1b)
У ( p , q ) t ( P + 1 ) H - У ( 0,0 ) for P = odd
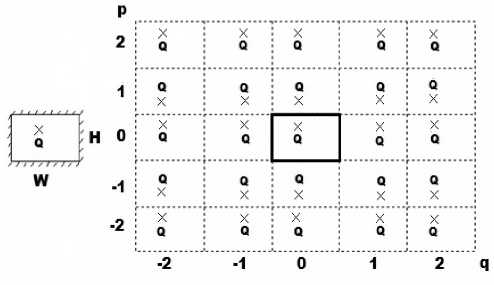
Figure 2. Rectangular extension by the image method
(a) Single boundary
(b) An infinite number of reflections boundary
From the above formula we can get location coordinates of every mirror Point of point Q .
-
A.2 Triangle Frame shape
Fig. 2 is the part of graph that regular triangle drawing frame A ABC uses image method extension to infinite drawing plane. Point p is a vertex in A ABC. pi are the mirror points that p in different mirror triangle. The distance between p and A , B , C as rA , rB and rC . The angle from p to A , B and C represent by 9 A , 0 B and 9 C . Also the angle Z p . means the angle from vertex pi to center of a circle. Owing to the geometrical relationships, we can get
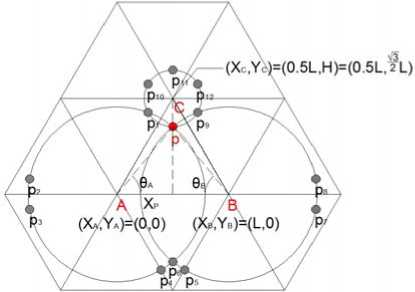
Figure 3. Triangular extension by the image method
A

p
rB =V( xp - xB)2 +(Ур - yB)2
r c = V( x p - x c У + ( У р - У с У
. j У
° = tan -1 —
A
к xp J
0 B
= - tan
-1
yp
^^^^^^B
yB
°
--sin
i
x
p
-
x
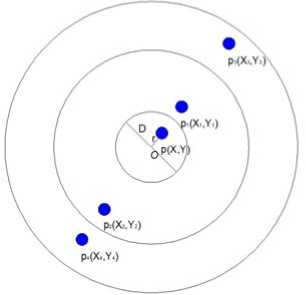
Figure 4. Circular extension by the image method
- 1
A
— sin I-- 0
к rc
i = 0,2,4
By the relationships (10a) and (10b), we can obtain every image point coordinates of p .
Zp, = <
i + 1
---n - °, 3A
i - 1
---n - °,
3 B
i - 2
B ,
П
7- ° - ,
n
C ,
n - 0C,
i = 1,3,5
i = 6,8
i = 7,9
i = 10
i = 11
i = 12
And from the relationship above we can image point coordinates location of p .
get every
Fig. 3 is a part of the map of circular drawing board extends to infinity of the drawing plane. Set the coordinate origin on the center of the round core. The distance from p to origin is r = 1 L 2 , .,2 . where p = ( x , y ) . We also set the diameter of round core is D . Then the two images of p in the k-ring can be found by relationships as follows:
( k 1) f x y 1
p. = (x,, У, ’ = Г I -,- I, к r r J
r ( ku = Dk + ( - 1 ) k r , i = 1,3,5, L , (9a)
r j ( k 2) =- Dk + ( - 1 ) k r = r , ( k ” - 2 kD , j = 2,4,6, l .(9b) where k is the ring number
Our force-directed method with repulsive force is based on the theory of heat conduction. In [10]-[11], Jing Lee proposed a novel repulsive force model to determine locations of the chips in the reliability-driven placement problem. The model begins with the transformation of the real region with vertices into an unbounded region with an infinite number of vertices. Then, each vertex pushes every other vertex with force based on the heat conduction analogy. Thus, each vertex will move in the conduction of the forces until the system achieves equilibrium. We can get the hybrid force that any vertex i gets in drawing plane is
n 11
f. = (1 - k ) ZZZ j =1 r = -1 c =-1
( r , c rr' ’I
+ z ku^ j e Adj ( i ) | r j |
where 1 < i < n n is the number of the vertex. r j , c ’ is the position vector of j^r , c ’ (minor of i ,in r row and c column) to i , й ,^' c’ is the unit vector of r rc ’ . Adj ( i ) is the adjacency vertices set of vertex i . In the above sentence, k is a control parameter, the range of k is 0 < k < 1, we posit k = 0 only consider thermal force, and k = 1 only considers spring force.
We can write the force equation of every vertex by the geometric relations between the coordinates of vertices and the mirror relationship to get equilibrium of every vertex. The equation of this system should be f, = 0,1 < i < n (11)
In other words, all we have to do is to get the answer of this system equation. Using corrected Newton-Raphson method one can get the answer. If we find force balance point of all vertex, we will get the position of vertices. Draw the relationship of edges, and then we can finish the auto graph drawing.
Our method begins with generating a random initial drawing. New drawings are iteratively computed by
modified Newton-Raphson method until a convergent solution is obtained.
-
III. EXPERIMENTAL RESULTS
Our method has been implemented in C++ language, and run on a PC with Intel 2GHz CPU, 3GB RAM. The experimental parameters are shown in Table 1. The experimental results are shown in Figs. 5 to 13.
Table 1. The parameters of experiment
Parameters
A : Control the image area
Cr : Control the repulsion of unconnected edges τ : Heat transpancy; 0 ≤ τ <0.5;
0 : Adiabatic Boundary
η : Pitch ratio
ω : The weighted value of force
-
A. Examples of the algorithm in action
It is clear that the shape of the frame for the form of the graph has great influence. It is not arbitrary frame can be applied to all of the graphics. Sometimes, it may decide which frame can be used by the structure and appearance of the graph. We can get the appropriate and beautiful graphics. In general, the rectangle frame and the circle frame can be applied for most of graphics. In fact, we found that the shape structure of triangle is similar to the binary tree structure. Drawing the binary tree by this border, it has the capability to show the binary tree structure directly.
Fig. 5 is an example by executing drafting process by our method for a graph with 16 vertices and 63 edges. From the plan of the initial of the drawing process to the complete plan, we can see in several stages, most of the graphics in the second stage has been little change, it means that the drawing time can be large reduced by modifying the program appropriately or by controlling parameters.
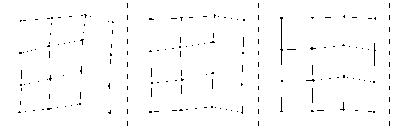
We see that the most of the graphics in the second phase has been little change, it means that the drawing time can be large reduced by modifying the program appropriately or by controlling parameters. For example, according to the results of many experiments, the size of the control parameter of the image area “A” for drawing speed has a great influence, “A” the smaller the faster. As shown in Fig.6, the executing time of drawing includes the times of drawing graph and sub-iterations. Fig.7 is a graph output of four frameworks of the tree graph with 21 vertices and 20 edges. We should emphasize that the every initial plan is random output.
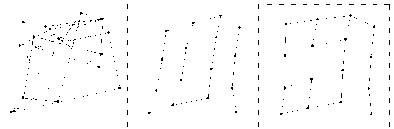
(a)initial drawing (b) ω =0.1 (c) ω =0.3
(d) ω =0.5 (e) ω =0.7 (f) ω =0.9
Figure 5. Drawing process
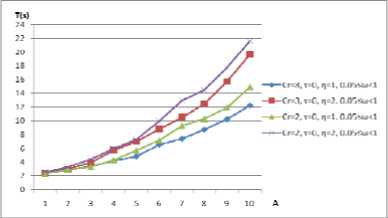
Figure 6. Relations of the image area and the implementation of time
|
Frame type |
Random input graph |
Final result graph |
|
Rectangle |
||
|
Triangle |
^^^^^ |
|
|
t*^ |
||
|
Circle |
||
|
Arc |
||
Figure 7. Random inputs and corresponding outputs of four different frame types of our method
-
B. Examples of the uniform distribution of the vertices and edges
Fig. 8 shows that effect of the vertex distribution on a graph of 36 disconnected vertices. Our method results in a pleasing even distribution.
There are examples of how edges are spread over the drawing space. Fig. 9 shows the result of 16 disconnected edges that applying the algorithm. The drawing space uniformly and the edges are essentially of the same length.
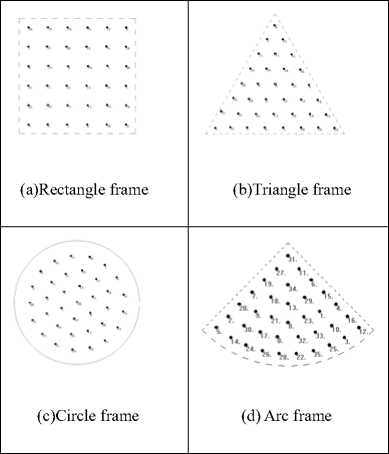
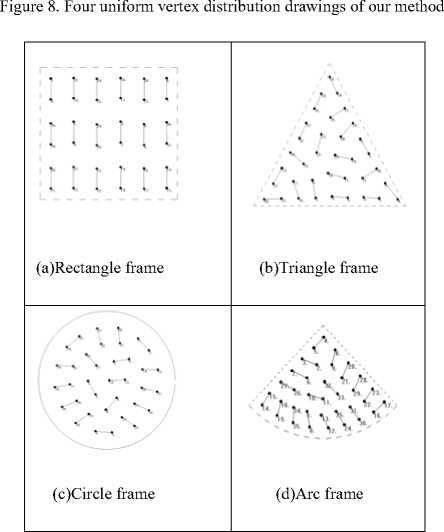
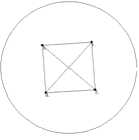
Figure 9. Four uniform length of edge and evenly distribute drawing of our method triangular frame which is without any crossing plan. It is easy to see that (d) shows the graph drawn by fan frame presented three-dimensional. In general, the rectangle frame and the circle frame can be applied for most of graphics. Actually, we found that the shape structure of triangle is similar to the binary tree structure. By drawing the binary tree in this border, there is the capability to show the binary tree structure directly
Our method usually preserves the originals and has center symmetry with clear displays. In Fig. 11, the graphs drawn by two methods are both having similar patterns and symmetry. It is clear that the edge length of graph by our method is more identical.
(a)Rectangle frame
(b) Circle frame

(c)Triangle frame

(d) Arc frame
Figure 10. The tetrahedron
(a)An output for a tree (b)Our method’s result in figure 5 from [12],
Figure 11. Two symmetry drawings of the same graph
As we use triangle frame to draw binary tree through the test results, we obtain the ideal results. We should first select the appropriate location coordinates of fixed point (root), which represents binary tree structure. The following three graphics are in the same conditions (A=5, Cr=1, τ =0, η =2, ω =0.4). The results are obtained by these three cases as follows: The case (a) is choosing the proper selection of fixed position (this position is concerned with your frame set). The case (b) is the fixed location which is selected by random. The case (c) is no fixed point. As shown in Fig.12.
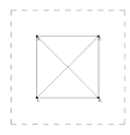
In Fig. 10, (a) and (b) are the graphs drawn by rectangle and circle frames which are both edge crossing of a two-dimensional graph and (c) is a graph drawn by
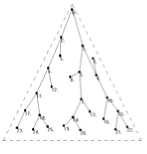
(a)fixed pt. drawing
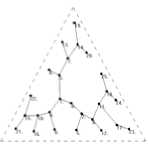
(b)fixed pt.(random)
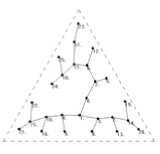
(c) no fixed pt.
Figure 12. Three different drawings of the binary tree (26 vertices and
25 edges)
(a) The tetrahedron (b) The octahedron (c) The cube
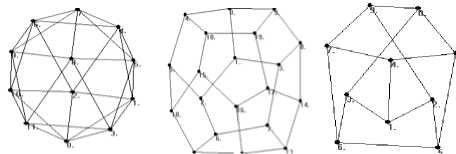
(d)The icosahedron (e) The dodecahedron (f) The Petersen graph Figure 13. Some interesting graphs that yield by our method
Finally, we use a couple of interesting graphics in Fig.13 by the graph theory (The Platonic graphs and The Petersen graph) to show the special structure of our approach for graphical presentations.
Aesthetic criteria we refer to above statements. In generally by the following features:
-
1. In the region of drawing, the vertices in graphics should be well-distributed.
-
2. The vertices in graphs should be closer to avoid the case of edge crossing.
-
3. If the graph with symmetrical characteristic, the graphics will apparent.
-
4. If we have known the construction of graph, The graphics may show the properties of this construction. For example, if the graph is binary tree, the graphics should be drawn as binary tree not to be free tree.
In force-directed method, the first features can be done by repulsion force model and the second features can be done by spring force model. The third and forth features are also done by appointing drawing space. Therefore, we look forward for these force methods that could get the higher quality of drawing.
-
IV. CONCLUSION AND FURTHER WORK
A new force-directed model that is coupling a traditional spring force model and a novel repulsive force model will be proposed to solve the graph drawing problems in 2-D frames. They are different from the conventional force-directed methods. This hybrid force model for generating a straight-line drawing not only preserving the original properties of a high degree of symmetry and uniform edge length but also modify this hybrid force model and promote it to normal drawing frame shape, especially regular triangle drawing board and circle drawing board.
Our method is easy to provide to 3D space. It is more complex than traditional force-directed method which may needs longer time to implementation of the graphics. To shorten time of drawing, we follow the steps, (1) simplify model of hybrid force model, (2) develop a tech of speed up force-directed method, and (3) find a fine-tuning code to accelerate the implementation of the program.
ACKNOWLEDGMENTS
We are grateful to Pro. J. -S. Jiang valuable guidance to our amendment.
References Force-Directed Method in Mirror Frames for Graph Drawing
- N. Amare and A. Manning, “The Language of Visuals:Text + Graphics = Visual Rhetoric Tutorial,” IEEE Trans. on Professional Communication, Vol. 50, No.1, pp.57~70, 2007.
- D. –S. Kwon, T. –H. Yang, and Y. –J. Cho, “Mechatronics Technology in Mobile Devices,” IEEE Industrial Electronics Magazine, Vol.4, No.2, pp. 36~41, 2010.
- N. Elmqvist and J. –D. Fekete, “Hierarchical Aggregation for Information Visualization: Overview, Techniques, and Design Guidelines,” IEEE Trans. On Visualization and Computer Graphics, Vol.16, No.3, pp. 439~454, 2010.
- R. Barea, L. Boquete, M. Mazo, and E. Lopez, “System for Assisted Mobility Using Eye Movements Based on Electrooculography,” IEEE Trans. on Neural Systems and Rehabilitation Engineering, Vol. 10, No. 4, pp. 209~218, 2002.
- P. Liu and J. Guan, “Computer-Aided Industrial Design & Conceptual Design, ” IEEE 10th International Conference on CAID & CD 2009, pp. 1624~1627, 2009.
- M. Kaufmann and D. Wagner (Eds), Drawing Graphs:Methods and Models, New York: Springer, 2001.
- J. Diaz, J. Petit, and M. Serna, “A survey of graph layout problems, ”ACM Computing Surveys, vol. 34, no. 3, pp. 313-356, 2002.
- M. Kaufmann and D. Wagner (Eds), Drawing Graphs: Methods and Models, New York: Springer, 2001.
- T. M. J. Fruchterman and E. M. Reingold, “Graph drawing by force-directed placement,” Software—Practice and Experience, Vol. 21, No. 11, 1991, pp. 1129-1164.
- J. Lee, “Thermal placement algorithm based on heat conduction analogy,” IEEE Trans. On Components and Packaging Technologies, vol. 26, no. 2, pp. 473-482, 2003.
- J. Lee, “A reliability-driven placement procedure based on thermal force model,” Microelectronics Reliability, vol.46, no. 3-4, pp. 973-983, 2006.
- P. Eades, W. Huang, S.-H. Hong, “A force-directed method for large crossing angle graph drawing,” Technical report / University of Sydney. School of Information Technologies ; no. 640, 2009.
