Forecasting of the leading indexes of social-economic factors on Yeniseisk district

Author: Belyakova G. Ya., Frolova A.I.
Journal: Сибирский аэрокосмический журнал @vestnik-sibsau
Section: Экономика
Article in issue: 7 (33), 2010.
Free access
In this article presents the forecast of social and economic factors influencing Yeniseisk district over 2009–2012. The main supposition of the forecast is following the existing linear trend of the main social-economic factorsdevelopment with permanence of external factors. This results in the positive track record of the growing investment in the fixed capital that is stipulated by involving large-scale investment projects.
Forecast, social and economic factors, time row, confidence interval, exponential curve, investments
Short address: https://sciup.org/148176442
IDR: 148176442
Text of the scientific article Forecasting of the leading indexes of social-economic factors on Yeniseisk district
Nowadays for being included in the world economic system every region must develop and form strategies of social and economic development, which would allow to find forms and ways of realization of the given regional advantages with the purpose to increase the standard of population living and also entering the markets of commodities, services, labour and capital of other regions. For this purpose it is necessary to expose steady tendencies and conformities to the law of social and economic processes, and also influencing factors and reasons predict their impact on the state and development of regional economy and vice versa.
Prognostication of social and economic development is the starting point of work to handle regional economy. The purpose of social and economic prognostication of region development is the adjustment of policy events and priorities in the development of regionall and economic complex.
Yeniseisk district is a municipal district of Krasnoyarsk region which is located in the middle flow of the Yenisei river. Since 1998 the quantity of population here has gone down by 7 017 persons and makes 26 324. The average age of the population is 42.4 years. On the one hand, it is the most active age to work. At this age employees achieve the peak of their professional level. On the other hand, in 5–10 years their labour productivity decreases but in future young employees are expected to relieve and that does not imply a mere substitution.
In this research the social and economic indexes of Yeniseisk district were taken over 2000–2008 as the basis for the local prognoses (tab. 1).
During 2000–2008 the number of registered unemployed persons fluctuates and makes about 1295 persons in 2001, then peaks in 2004 at the point of 2286. Also the analysis to provide the number of organizations in Yeniseisk district was proceeded. Over the period under research there is reduction of enterprises by 18 % in average that negatively effects the economy of district with growing investment in the fixed assets with every period by approximately 8.5 % [1]. Next on the basis of the obtained data the prognosis of the explored indexes was made for 2009–2012 by means of the analysis of basic tendencies in dynamic rows.
The basic pre-condition of the prognosis is saving in the future existent linear progress of basic socio-economic indexes trend at invariability of external factors.
Prognostication for 2009–2011 it is determined the quantity of the registered unemployed persons on equalization:
у = –40.16 t 2 + 474.7 t + 688.7
where y is the quantity of the registered unemployed persons; t is the period; R 2 is the index of determinates, in this prognosis it makes 0.901, that testifies to high exactness of trend model.
Vestnik. Scientific Journal of Siberian State Aerospace University named after academician M. F. Reshetnev
Table 1
Dynamics of basic indexes of Yeniseisk district over 2000–2008
|
Index |
Period, year |
||||||||
|
2000 |
2001 |
2002 |
2003 |
2004 |
2005 |
2006 |
2007 |
2008 |
|
|
Quantity of the registered unemployed persons |
1 313 |
1 295 |
1 507 |
1 993 |
2 286 |
2 208 |
2 030 |
1 667 |
1 815 |
|
Number of organizations |
402 |
370 |
382 |
460 |
347 |
366 |
372 |
379 |
281 |
|
Investments in the fixed assets (million RUR) |
26.4 |
6.7 |
5.4 |
5 |
8.2 |
13.5 |
4.4 |
7.1 |
9.4 |
Prognosis of the number of the registered unemployed persons 2011 in the Yeniseisk district is presented on fig. 1.
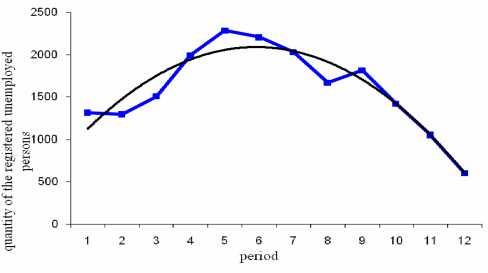
Fig. 1. The prognosis of the number of the registered unemployed persons in the Yeniseisk district by 2011
The actual number of unemployed persons in 2008 was 1667 people and the forecast number of the unemployed persons by 2009 was 1815 persons.
The prognosis for 2010 and 2011 is conducted similarly.
We determine the intervals of confidences for this prognosis for the exponential curve of growth. [2]
The confident intervals of prognosis are calculated with the formula:
U y = y n + L ± t a S y x
1 t L e t 4 - 2 t L E t 2 + nt l (1)
x 1 + + + ,
V n Et nZt*-(Et1)’ where yn + L is the point prognosis on the model for the (n + l)th moment of time; ta is the tabular value of St’yudent criterion for the level of meaningfulness and number of degrees of freedom; n is the amount of supervisions in a temporal row; Syˆ – average quadratic error of estimation of the forecast index; t is the sequence level of row number; tL is time which a prognosis is done for; L is a period of forestalling.
Results are presented in tab. 2.
Analysing findings from tab. 2 (confidence interval) showed that the model on the basis of which the prognosis was carried out is acknowledged to be adequate with confiding probability 95 %. It is possible to assert that at saving of the folded conformities to the law of development the forecast size gets within the interval formed by lower and upper limits.
Table 2
Confident intervals of prognosis for the quantity of the registered unemployed persons in the Yeniseisk district
|
Time, t |
Step, L |
Point prognosis |
Confidence interval of prognosis 95 % |
|
|
upper limit |
lower limit |
|||
|
9 |
1 |
1 420 |
2 082 |
758 |
|
10 |
2 |
1 051 |
1 713 |
389 |
|
11 |
3 |
601 |
1 264 |
–60 |
Similarly the prognosis is made for the amount of commercial organizations in the Yeniseisk district over the researched period. Thus the given forecast index was added to the factual data that allowed to multiply exactness of the given prognosis.
Prognostication of the number of organizations in the Yeniseisk district by 2009 was conducted on the basis of equalization:
y = –2.864 t 2 – 19.12 t + 368.2
where y is the number of organizations; t is the period; R 2 is the index of determination, in this prognosis it is equal to 0.855 that testifies the high exactness of trend model.
Information of prognosis for the amount of organizations by 2011 in the Yeniseisk district is presented in fig. 2.
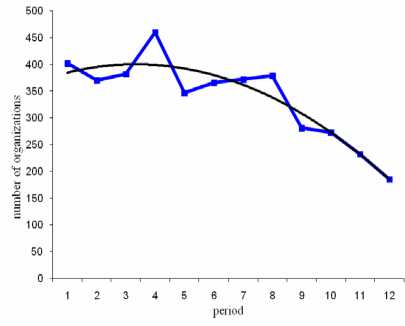
Fig. 2. The prognosis of amount of organizations in the Yeniseisk district by 2011
Actually the number of commercial organizations in the Yeniseisk district by the end of 2008 was 281. The forecast index for 2009 was 273 (the rate of growth went down by 3 %), 2010 it was 232 (rate of growth 85 %) and in 2011 it was 185 (rate of growth 80 %).
Same way as the prognosis of quantity of the registered unemployment was determined, we determine the confident intervals of the prognosis for the amount of organizations in the Yeniseisk district for the exponential curve of growth in formula (1). The results are presented in tab. 3.
Table 3
Confident intervals of prognosis for the amount of organizations in the Yeniseisk district
|
Time, t |
Step, L |
Point prognosis |
Confidence interval of prognosis 95 % |
|
|
upper limit |
lower limit |
|||
|
9 |
1 |
273 |
399 |
147 |
|
10 |
2 |
232 |
358 |
106 |
|
11 |
3 |
185 |
311 |
60 |
Findings (tab. 3) show that the model on the basis of which the prognosis was carried out is acknowledged to be adequate with confiding probability 95 %. Consequently with saving the established tendencies of development the forecast falls within the interval formed by upper and lower limits.
The investment prognosis is similarly made in the fixed assets over the researched period.
The prognostication of the investment in the fixed assets by 2009 was conducted on the basis of the following equalization:
y = 0.584 t2 – 6.855t +25.32, where y is the sum of investments in the fixed assets; t is the period; R2 is the index of determinates. In this prognosis it is equal to 0.715, that testifies the acceptable exactness of the trend model.
Information of prognosis of investments in the fixed assets by 2011 in the Yeniseisk district is presented in fig. 3.
Actually the sum of investments in the fixed assets in the Yeniseisk district in 2008 was 9.4 millions RUR. The forecast index by 2009 was 15 million RUR, by 2010 it was 20.67 million RUR and in 2011 it was 27.27 million RUR.
We determine the confident intervals of prognosis of investments in basic capital in the Yeniseisk district by 2011 for the exponential curve of growth in formula (1). Results are presented in tab, 4.
Findings (tab. 4) show that model acknowledged adequate with confiding probability 95 %.
There is positive dynamics of growth in the given prognosis, such index as investment in the fixed assets is conditioned by realization of large projects of investments. Social efficiency of the project consists of multiplying employment of population in all its implementation phases including multiplying workplaces at enterprises in the district. There is a decline of unemployment in the forecast periods, that will testify the results of realized complex of measures foreseen by the department having the special purpose program “Assistance employment of the Krasnoyarsk region’s population”.
Table 4
Intervals of confidences of prognosis of investments in basic capital in the Yeniseisk district
|
Time, t |
Step, L |
Point prognosis |
Confidence interval of prognosis 95 % |
|
|
upper limit |
lower limit |
|||
|
9 |
1 |
15.23 |
33.92 |
–3.4 |
|
10 |
2 |
20.66 |
39.35 |
1.98 |
|
11 |
3 |
27.27 |
45.95 |
8.58 |
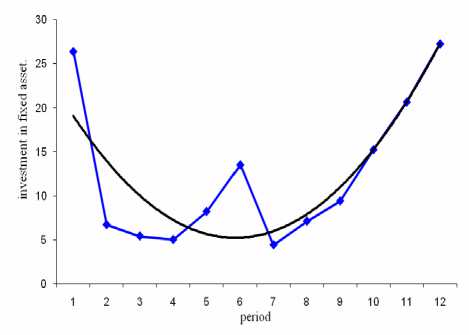
Fig. 3. The prognosis of investments in the fixed assets by 2011 in the Yeniseisk district
The prognosis findings of social and economic indicators can be used in practical activity of municipal education management.
