Forecasting Stock Market Trend using Machine Learning Algorithms with Technical Indicators

Author: Partho Protim Dey, Nadia Nahar, B. M. Mainul Hossain
Journal: International Journal of Information Technology and Computer Science @ijitcs
Article in issue: 3 Vol. 12, 2020.
Free access
Stock market prediction is a process of trying to decide the stock trends based on the analysis of historical data. However, the stock market is subject to rapid changes. It is very difficult to predict because of its dynamic & unpredictable nature. The main goal of this paper is to present a model that can predict stock market trend. The model is implemented with the help of machine learning algorithms using eleven technical indicators. The model is trained and tested by the published stock data obtained from DSE (Dhaka Stock Exchange, Bangladesh). The empirical result reveals the effectiveness of machine learning techniques with a maximum accuracy of 86.67%, 64.13% and 69.21% for “today”, “tomorrow” and “day_after_tomorrow”.
Stock price movement, technical indicators, machine learning techniques, DSE
Short address: https://sciup.org/15017453
IDR: 15017453 | DOI: 10.5815/ijitcs.2020.03.05
Text of the scientific article Forecasting Stock Market Trend using Machine Learning Algorithms with Technical Indicators
Published Online June 2020 in MECS
Stock market is the important part of economy of the country and plays an important role for the industrial and commercial instruments. Generally most of the research analyses large amounts of historical stock data and extract meaningful information [1] for forecasting stock price. The aims of this paper to create a predictive system that is able to forecast the direction changes of stock price that helps investors to take appropriate decisions for investing in a stock at the right time and make significantly best possible profit.
Stock markets have huge fluctuation. Investing in a good stock but at fall off time can make big economical loss, while investing in a stock at the right time can bear profits. Nowadays, financial investors do not properly understand which stocks to buy or which stocks to sell in order to make profit. This paper will reduce the problem, with suitable accuracy and evaluated on real time scenario.
The main goal of this work are as follows:
-
1) To identify the influencing factors that directly affecting stock market.
-
2) To identify the correlation between technical indicators and stock price trend from large set of data.
-
3) To predict the trend of stock price.
The main goal of this paper is to solve the economic predicament and generate an approximate forecasting output of each stock based on the previous historical data.
This paper is arranged as follows: beginning with this introduction, background and related works are explained in the immediate next section. The Materials and Methods are explained in Section 3 and Section 4 describes the experimental results of the proposed system. The conclusion described in the last section.
II. Background and Related Work
Due to the importance of stock price forecasting, many researchers have worked in this financial field . Stock price forecasting frequently uses technical analysis (TA) based on technical indicators (TI) values used as inputs features. The historical stock data mainly consist of open, low, high and close price values and volume size. These values uses technical analysis, over a certain time span and gave signal for making in both deciding what the stock price will be and making appropriate trading decisions . Atsalakis and Valavanis [2], proposed a model where they used TIs as input features. This approach achieved 20% accuracy.
Kimoto, Asakawa et al. (1990) [9] propose a system based on back propagation approach , was one of the first studies performed on TOPIX (Tokyo Stock Exchange Prices
Indexes) index prediction. The outcomes demonstrated that a great profit was attained. They developed various learning algorithms and prediction models for forecasting stock indexes. In order to reduce difficulties for selecting appropriate indicators or tuning their parameters several work have been done [3, 4].
Another research by Eugene F. Fama, Lawrence Fisher, Michael C. Jensen, Richard Roll and H.Cootner [5, 6, 7], was done. They used random walk theory and the Efficient Market Hypothesis (EMH) [8]. They mentioned that stock market has three levels of efficiency, strong, semi-strong and weak. Many macro- economic an environmental factors have ability to influence stock market, such as political events, firm policies, general economic conditions and investor psychology etc. has an impact on the stock market [9]. Recent research work have proven that the market forecasting depends on business cycles and TIs values [10, 11] with tuned parameters. Based on this idea, an evolutionary algorithms are designed to discover correct parameters for a popular indicator, Moving Average Convergence -Divergence (MACD) [12].
Previously, aim to discover a new technical indicators frequently used evolutionary algorithms [13, 14]. Based upon different tuned parameters of different classifiers such as naïve Bayes, C4.5, random forest, linear discriminant, and cubic support vector machine (SVM) [15] and obtained the predictive results. The outstanding performance of logistic regression was revealed. Another widely used indicator, Relative Strength Index (RSI) have been selected to obtain the buying/selling signals [16]. Kara et al. (2011) developed two efficient models based on ANN and support vector machines (SVM) for predicting daily BIST-100. Ten technical indicators were used as inputs of the proposed models. Investigational results exposed that average performance of ANN (75.74%) was significantly better than SVM (71.52%) [17]. More recently research, many financial forecasting systems used TIs values as input features [18]. These systems can detect complex patterns in large amount of market data and predict future behaviors of a stock or a financial instrument.
III. Materials and Methods
In this study, it is aimed to predict the stock’s price trend of DSE for today, tomorrow and day after tomorrow by using eleven technical Indicators (TIs). After preprocessing the historical raw data of a stock, it is feed to our model to predict the stock price trend where the target feature is close price .
-
A. Selected TIs
In this proposed system, eleven TIs were selected to form input feature vectors. Most of the TIs were trend indicator, since our main focus is predicting the price trend of a stock. The detailed description of selected TIs is given in the following.
-
1) Exponential Moving Average (EMA) is a trend indicator and a special type of moving average (MA) calculated by the following equation.
EMA=Price t × µ + EMA y × (1- µ) (1)
Where:
Price= Close price t = Current day y= Previous day
N= considering number of days in EMA (In this work, N=14 days)
µ =2 ÷ (N+1)
-
2) Moving Average Convergence Divergence (MACD) is a popular trend indicator and usually calculated by EMA.
MACD Line: (EMA(12 day) - EMA(26 day)) (2)
Signal Line: EMA(9 day) of MACD Line (3)
MACD Histogram: MACD Line - Signal Line (4)
-
3) Volatility Stop (VTS) is a powerful indictor, able to define the current trend. It plots downward and upward trend lines. These lines are generally used as trailing stops.
When Up Trend Detected, V STOP = C - β * α (5)
Up Trend Continues, V STOP = MAX (V STOP .1, C Max - β * α)
When Down Trend Detected, V STOP = C + β * α (7)
Down Trend Continues, VSTOP = MIN (VSTOP.1, CMin + β * α)
Where, C = Closing Price
β = True Range Multiplier
α = True Range
V STOP .1 = Volatility Stop Value on Previous day
C Max = Maximum Closing Price since Up Trend Began C Min = Minimum Closing Price since Down Trend Began
-
4) Triple Exponential Moving Average (T3) is developed by Tim Tillson attempts mentioned that MA performs better than EMA [19].
-
5) Parabolic SAR (SAR) concerns with trailing stop. It can detect the exit signal [20].
-
6) Bollinger Bands (BB) contains three lines. In this system middle band values were used [21].
-
7) On Balance Volume (OBV) is a momentum indicator which can predict price changes by the flow of volume [22].
-
8) Commodity Channel Index (CCI) which can detect the beginning and ending market trends. This effective indicator was developed by Donald Lambert.
-
9) Momentum (MTM) detects the changing frequency or speed of stock price.
MTM=C (t) – C (-n) (9)
Where:
C = Close price t = Current day
-n= n days ago close price
-
10) Price Oscillator (PPO) is a momentum indicator that calculated from the difference of two moving averages i.e. short & long MA.
PPO = SlowMA(C) – FastMA(C) (10)
Where:
C = Close price
-
11) Performance Indicator (PERF) is calculated the percentage changes between the current day price and the start price of the data series.
PERF= (C – C[Start]) / C[Start] × 100 (11)
Where:
C = Close price
C [Start] = First day’s close price.
-
B. System Architecture
The proposed system is elucidated in this section. The architecture design is explained here. This system can forecast the stock price trend of DSE for today, tomorrow and day after tomorrow based on TIs.
Selection of participation features is an important and complex task for forecasting stock market. Most of the research works, used technical indicators values directly as input. In this proposed system, TIs values are not used directly as input but invoke only TIs trend to achieve main goal.
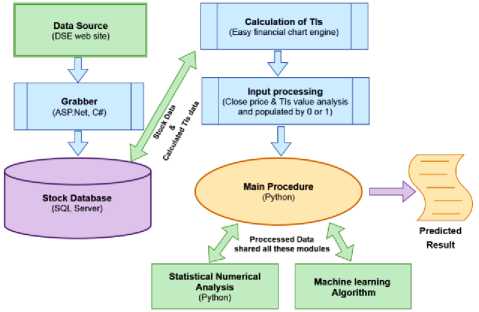
Fig.1. Overall System Architecture
In the following section we will discuss the detailed architecture of our system and its execution process.
-
1) Data Grabbing
The raw data used in this research were historical daily stock data, which are seizing from Dhaka Stock Exchange (DSE), Bangladesh web site 1 and stored in SQL server database. For this purpose, a data grabbing system is developed, which runs on every 5 minutes interval that scraps stock data. The stock data contains open, low, high, close and the size of traded volume. The open price is the opening price of the stock (PoS) at the start of the trading day, the low price represents the minimum PoS during the trading day, the high price represents the maximum PoS during the trading day and the closing price indicates the last PoS of the trading day. In this research, closing price trend is consider as target feature. The scraped raw data are presented in Table 3 .
-
2) Calculation of TIs
After grabbing, TIs were calculated by “ Easy financial chart ” engine2 for each trading day which are combined with raw data and stored in CSV files. The concise combined data are presented in Table 4 .
-
3) Input Processing
During this step, technical indicators (TIs) values are populated and represented with binary values (0 or 1). Rising up of TIs values from the previous day is represented as 1, otherwise it is 0. Thereafter, stock close price is further extended by including three new column which indicated the change of the company’s stock price at the current day, one day later and two days later which are labeled by “ today ”, “ tomorrow ” and
“ day_after_tomorrow ”. These three fields are populated and also represented by binary values (0 or 1). When close price is greater than open price, then the field is populated by 1, otherwise 0 (close price is less than equal to open price). Finally, all processed data are stored in CSV files for further use. The summarized processed data are presented in Table 5 .
-
4) Main Procedure
This module works as a coordinator and forecasts the directional changes of stock prices. A statistical analysis is done on processed data, which is described later in Result and Discussion section. For each data point, eleven input features are used for predicting the target feature, stock prices movement of “ today ”, “ tomorrow ” and “ day_after_tomorrow ”. Random Forest Classifier, Ada Boost Classifier, KNeighbors Classifier, Logistic Regression, Multi-layer Perceptron classifier (MLP) and SVM are used to detect the relationship between input features and the directional changes of stock prices. Proposed system was trained by inputs features and tested individually for each stock with eleven TIs trend values. Every performance measures the accuracy score for unseen test set and achieve the prediction result as output.
So our system takes raw data from Stock database (SQL server) and after execution it stores the calculated
TIs and predicted result to database (which is shown by dual arrow). Main procedure also executes two sub modules i.e. Statistical numerical analysis and ML algorithm module. The executed data are shared both Main procedure and sub modules (which is shown by dual arrow).
The major steps involved in this system are as follows:
-
• Grabbing stock data from DES web sites & store into the database.
-
• Calculating TIs & combining with stock data and store as CSV files.
-
• Preprocessing of the combined data and representation with binary values (0 or 1).
-
• Feed the preprocessed data to the models as input,
-
• Compute the corresponding output for “today”, “tomorrow” and “day_after_tomorrow”.
-
• Analyzed accuracy score and store the predicted result.
IV. Result and Discussion
This section designates the statistical analysis of processed data and the model performance result after properly training. Six classifier which mentioned above, evaluate on each day stock data of each company and analyses their corresponding results .
-
A. Statistical analysis
A numerical statistical analysis was done on processed data. Experiments were performed separately for each selected stock. It describes how the direction or the trend of stock price changes with the TIs values. As an example, Line chart analysis for “ ABBANK ” is presented below.
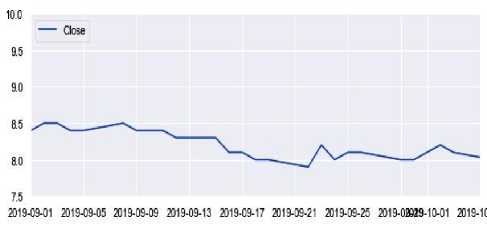
Fig.2. Line chart for Close price
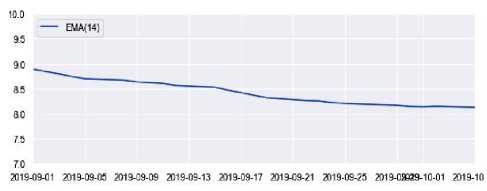
Fig.3. Line chart for EMA (14).
2019-09-01 2019-09-05 2019-09-09 2019-09-13 2019-09-17 2019-09-21 2019-09-25 2019-0392 9-10-01 2019-1С
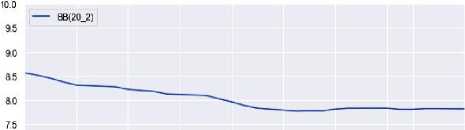
Fig.4. Line chart for BB (20, 2).
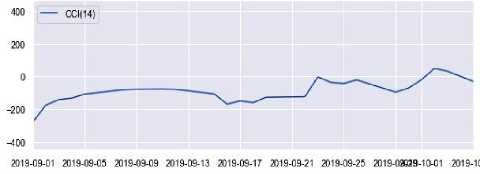
Fig.5. Line chart for CCI (14)
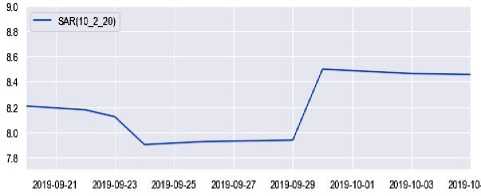
Fig.6. Line chart for SAR (10, 2, 20)
As shown in the above Fig. 2, 3, 4, 5, 6 , that TIs values changes with respect to stock price line ( Fig. 1 ),
So, when the stock price is in uptrend, the corresponding TIs also rising, or vice versa. Therefore, indicators follow the price line, i.e. TIs have ability for forecasting the stock market behavior.
-
B. Experimental Results
This subsection explained the details description of the results obtained by the proposed system. Experiments were executed separately on each stock and predict the stock price directional changes or trend. All these datasets were split into an 85% - 15% for training and test set (Inputted processed data are presented in Table 5 ). Prediction accuracy compares and describes the performance of above selected classifier. As the main objective of this paper, determining the direction changes of stock price is important, which is described by the accuracy score. The prediction accuracy obtained for a single stock was experimented with six machine learning algorithms.
After the training phase, this system predicts the future stock price trend for today, tomorrow and the day after tomorrow individually. The experimental outcomes of the accuracy percentages are shown in Table 1 & 2 for “ ABBANK ” and “ ACI ” respectively. All the results are reported on the held out test set.
Table 1. Prediction accuracy for “ ABBANK ” in percentage (%)
|
Day |
RandomForest |
AdaBoost |
KNeighbors |
Logistic Regression |
MLP |
SVC (SVM) |
|
today |
86.35 |
86.67 |
82.22 |
86.67 |
86.67 |
86.67 |
|
tomorrow |
61.59 |
64.13 |
56.19 |
64.13 |
63.17 |
64.13 |
|
day_after_tomorrow |
66.03 |
69.21 |
64.13 |
69.21 |
69.84 |
69.21 |
Table 2. Prediction accuracy for “ ACI ” in percentage (%)
|
Day |
RandomForest |
AdaBoost |
KNeighbors |
Logistic Regression |
MLP |
SVC (SVM) |
|
today |
77.43 |
78.99 |
73.54 |
78.99 |
77.82 |
79.12 |
|
tomorrow |
58.24 |
61.74 |
56.55 |
61.74 |
61.48 |
61.74 |
|
day_after_tomorroww |
58.88 |
62.13 |
55.12 |
62.13 |
62.13 |
62.13 |
Table 3. Raw data of ABBANK grabbing from DSE site
|
Date |
Open |
High |
Low |
Close |
Volume |
|
9/29/2019 |
8.1 |
8.1 |
7.9 |
8 |
257880 |
|
9/30/2019 |
8 |
8.1 |
8 |
8 |
122411 |
|
10/1/2019 |
8 |
8.2 |
8 |
8.1 |
50458 |
|
10/2/2019 |
8.1 |
8.3 |
8 |
8.2 |
62042 |
|
10/3/2019 |
8.2 |
8.3 |
8 |
8.1 |
93226 |
|
10/6/2019 |
8 |
8.1 |
8 |
8 |
115600 |
|
10/7/2019 |
8 |
8.1 |
8 |
8 |
42045 |
|
10/9/2019 |
8 |
8.1 |
7.9 |
8 |
117023 |
|
10/10/2019 |
7.9 |
8 |
7.8 |
7.8 |
296610 |
|
10/13/2019 |
7.8 |
8 |
7.8 |
7.8 |
137333 |
|
10/14/2019 |
7.8 |
8 |
7.7 |
7.9 |
110647 |
|
10/15/2019 |
8 |
8.1 |
7.9 |
8.1 |
172932 |
|
10/16/2019 |
8.2 |
8.2 |
8 |
8.1 |
23941 |
|
10/17/2019 |
8 |
8.1 |
7.9 |
7.9 |
56404 |
Table 4. Combined data of ABBANK
|
Date |
Close |
EMA(14) |
MACD |
VTS(7) |
T3(8) |
SAR |
BB |
OBV |
CCI(14) |
MTM(6_6) |
PPO(26_12_9) |
PERF |
|
9/29/2019 |
8 |
8.16424 |
0.031665 |
8.197981 |
7.942582 |
7.935285 |
7.829474 |
71022939 |
-96.4618 |
-0.08333 |
-2.8778 |
-89.445 |
|
9/30/2019 |
8 |
8.142342 |
0.035396 |
8.197981 |
7.940115 |
8.5 |
7.805291 |
71000235 |
-71.3376 |
8.88E-16 |
-2.83494 |
-89.445 |
|
10/1/2019 |
8.1 |
8.136696 |
0.053013 |
8.201769 |
7.943572 |
8.488 |
7.806663 |
70972373 |
-19.8198 |
1.18E-15 |
-2.76466 |
-89.3131 |
|
10/2/2019 |
8.2 |
8.145137 |
0.078289 |
8.200452 |
7.958103 |
8.47624 |
7.820332 |
70947613 |
49.46237 |
0.05 |
-2.65497 |
-89.1811 |
|
10/3/2019 |
8.1 |
8.139118 |
0.081335 |
8.1496 |
7.977674 |
8.464715 |
7.820341 |
70921602 |
32.09877 |
0.05 |
-2.53985 |
-89.3131 |
|
10/6/2019 |
8 |
8.120569 |
0.070103 |
8.1496 |
7.993595 |
8.453421 |
7.812972 |
70889812 |
-61.7647 |
0.016667 |
-2.44124 |
-89.445 |
|
10/7/2019 |
8 |
8.104493 |
0.063114 |
8.10088 |
8.003339 |
8.442352 |
7.830118 |
70845150 |
-53.3333 |
0.016667 |
-2.3527 |
-89.445 |
|
10/9/2019 |
8 |
8.090561 |
0.059007 |
8.098574 |
8.007275 |
8.420658 |
7.83974 |
70804864 |
-79.5699 |
1.18E-15 |
-2.26984 |
-89.445 |
|
10/10/2019 |
7.8 |
8.051819 |
0.03126 |
8.048445 |
7.996948 |
8.389419 |
7.819836 |
70749748 |
-162.963 |
-0.03333 |
-2.22937 |
-89.7089 |
|
10/13/2019 |
7.8 |
8.018244 |
0.015607 |
8.048329 |
7.973313 |
8.342265 |
7.793765 |
70703796 |
-145.299 |
-0.13333 |
-2.21288 |
-89.7089 |
|
10/14/2019 |
7.9 |
8.002478 |
0.021082 |
7.998496 |
7.945793 |
8.288039 |
7.798997 |
70663377 |
-130.025 |
-0.16667 |
-2.18756 |
-89.5769 |
|
10/15/2019 |
8.1 |
8.015481 |
0.052228 |
7.90015 |
7.929629 |
8.229235 |
7.798997 |
70641558 |
2.002861 |
-0.13333 |
-2.11324 |
-89.3131 |
|
10/16/2019 |
8.1 |
8.02675 |
0.072186 |
7.950274 |
7.928164 |
8.176311 |
7.798997 |
70619739 |
61.40351 |
-0.11667 |
-2.00727 |
-89.3131 |
|
10/17/2019 |
7.9 |
8.00985 |
0.058394 |
7.950274 |
7.92941 |
7.7 |
7.787658 |
70602209 |
-42.8135 |
-0.13333 |
-1.92221 |
-89.5769 |
|
9/29/2019 |
8 |
8.16424 |
0.031665 |
8.197981 |
7.942582 |
7.935285 |
7.829474 |
71022939 |
-96.4618 |
-0.08333 |
-2.8778 |
-89.445 |
Table 5. Processed data of ABBANK
|
today |
tomorrow |
d_a_tomorrow |
EMA |
MACD |
VTS |
T3 |
SAR |
BB |
OBV |
CCI |
MTM |
PPO |
PERF |
|
0 |
0 |
1 |
0 |
1 |
0 |
0 |
1 |
1 |
0 |
0 |
1 |
1 |
0 |
|
0 |
1 |
1 |
0 |
1 |
0 |
0 |
1 |
0 |
0 |
1 |
1 |
1 |
0 |
|
1 |
1 |
0 |
0 |
1 |
1 |
1 |
0 |
1 |
0 |
1 |
1 |
1 |
1 |
|
1 |
0 |
0 |
1 |
1 |
0 |
1 |
0 |
1 |
0 |
1 |
1 |
1 |
1 |
|
0 |
0 |
0 |
0 |
1 |
0 |
1 |
0 |
1 |
0 |
0 |
0 |
1 |
0 |
|
0 |
0 |
0 |
0 |
0 |
0 |
1 |
0 |
0 |
0 |
0 |
0 |
1 |
0 |
|
0 |
0 |
0 |
0 |
0 |
0 |
1 |
0 |
1 |
0 |
1 |
0 |
1 |
0 |
|
0 |
0 |
0 |
0 |
0 |
0 |
1 |
0 |
1 |
0 |
0 |
0 |
1 |
0 |
|
0 |
0 |
1 |
0 |
0 |
0 |
0 |
0 |
0 |
0 |
0 |
0 |
1 |
0 |
|
0 |
1 |
1 |
0 |
0 |
0 |
0 |
0 |
0 |
0 |
1 |
0 |
1 |
0 |
|
1 |
1 |
0 |
0 |
1 |
0 |
0 |
0 |
1 |
0 |
1 |
0 |
1 |
1 |
|
1 |
0 |
0 |
1 |
1 |
0 |
0 |
0 |
0 |
0 |
1 |
1 |
1 |
1 |
It is seen form the experimental results that the proposed system performs better for today i.e. this model can predict the stock’s price trend for today overall better than tomorrow and the day after tomorrow. For example, today, tomorrow and the day after tomorrow accuracy of " ABBANK " by RandomForest classifier are respectively, 86.35%, 61.59% and 66.03% respectively, where the accuracies for tomorrow and the day after tomorrow were less than today.
V. Conclusion and Future Works
References Forecasting Stock Market Trend using Machine Learning Algorithms with Technical Indicators
- G. S. Atsalakis and K. P. Valavanis, “Surveying stock market forecasting techniques – Part II: Soft computing methods,” Expert systems with applications, vol. 36, no. 3, pp. 5932–5941, Apr. 2009.
- G. S. Atsalakis and K. P. Valavanis, “Surveying stock market forecasting techniques – Part II: Soft computing methods,” Expert systems with applications, vol. 36, no. 3, pp. 5932–5941, Apr. 2009.
- D. J. Bodas-Sagi, P. Fernández-Blanco, J. I. Hidalgo, and F. J.Soltero -Domingo, “A parallel evolutionary algorithm for technical market indicators optimization,” Natural computing, vol. 12, no. 2, pp. 195–207, Sep. 2012.
- F. Andrade de Oliveira, L. Enrique Zarate, M. de Azevedo Reis, and C. Neri Nobre, “The use of artificial neural networks in the analysis and prediction of stock prices,” in Proceedings of the IEEE International conference on systems, man, and cybernetics, 2011, pp. 2151–2155.
- Fama, E., Fisher, L., Jensen, M., & Roll, R. (1969). The Adjustment of Stock Prices to New Information. International Economic Review, 10(1), 1-21. doi:10.2307/2525569
- Fama, E. (1965). Tomorrow on the New York Stock Exchange. The Journal of Business, 38(3), 285-299. Retrieved from http://www.jstor.org/stable/2351064
- In Cootner, P. H. (2001). The random character of stock market prices. London: Risk.
- Fama, Eugene. (1965). The Behavior of Stock Market Price. Journal of Business - J BUS. 38. 10.1086/294743.
- Wang, Jian-Zhou & Wang, Ju-Jie & Zhang, George & Guo, Shu-Po. (2011). Forecasting stock indices with back propagation neural network. Expert Syst. Appl. 38. 14346-14355. 10.1016/j.eswa.2011.04.222.
- J. H. Kim, A. Shamsuddin, and K.-P. Lim, “Stock return predictability and the adaptive markets hypothesis: Evidence from century-long U.S. data,” Journal of Empirical Finance, vol. 18, no. 5, pp. 868–879, Dec. 2011.
- N. Taylor, “The rise and fall of technical trading rule success,” Journal of Banking & Finance, vol. 40, pp. 286–302, Mar. 2014.
- Fernández, Pablo & Bodas Sagi, Diego J. & Soltero, Francisco & Hidalgo, Ignacio. (2008). Technical market indicators optimization using evolutionary algorithms. GECCO'08: Proceedings of the 10th Annual Conference on Genetic and Evolutionary Computation 2008. 1851-1858. 10.1145/1388969.1388989.
- Allen F., Karjalainen R. Using Genetic Algorithms to Find Technical Trading Rules. Journal of Financial Economics. Vol 5. Pp. 245-275. 1999
- Arifovic J., Evolutionary Algorithms in Macroeconomic Models. Macroeconomic Dynamics, Cambridge University Press, vol. 4(3), pags. 373-414, September 2000.
- Sharma, M.; Sharma, S.; Singh, G. Performance Analysis of Statistical and Supervised Learning Techniques in Stock Data Mining. Data 2018, 3, 54.
- Bodas Sagi, Diego J. & Fernández, Pablo & Hidalgo, Ignacio & Soltero, Francisco & Risco-Martín, José L.. (2009). Multiobjective optimization of technical market indicators. 1999-2004. 10.1145/1570256.1570266.
- Kara, Yakup & Boyacioglu, Melek & Baykan, Omer. (2011). Predicting direction of stock price index movement using artificial neural networks and support vector machines: The sample of the Istanbul Stock Exchange. Expert Systems with Applications. 38. 5311-5319. 10.1016/j.eswa.2010.10.027.
- Shynkevich, Yauheniya & Mcginnity, T.M. & Coleman, Sonya & Belatreche, Ammar & Li, Yuhua. (2017). Forecasting Price Movements using Technical Indicators: Investigating the Impact of Varying Input Window Length. Neurocomputing. 10.1016/j.neucom.2016.11.095.
- Stocks & Commodities V16:1 (33-37): Smoothing Techniques For More Accurate Signals by Tim Tillson
- Wilder, J.. (1978). New Concepts in Technical Trading Systems.
- Bollinger, John. Bollinger on Bollinger Bands. McGraw Hill, 2002. ISBN 978-0-07-137368-5
- Granville, J. E. (1976). Granville's new strategy of daily stock market timing for maximum profit. Englewood Cliffs, N.J: Prentice-Hall.
