Foreign economic activity of the NWFD regions and the republic of Belarus: condition and methodological aspects of modelling

Author: Uskova Tamara Vitalyevna, Asanovich Valeriy Yakovlevich, Dedkov Sergey Maratovich, Selimenkov Roman Yuryevich
Journal: Economic and Social Changes: Facts, Trends, Forecast @volnc-esc-en
Section: Modeling and forecast
Article in issue: 4 (12) т.3, 2010.
Free access
The article is devoted to the urgent research issues on the integration and modelling of foreign economic activity from the little-studied aspect of the system of relations “country - region of another country”. The authors examine the background and the tendencies of development of trade and economic integration of the NWFD regions and the Republic of Belarus. The need for use of mathematic tools to model and to predict the integration processes is founded in the article. The authors describe the mathematic apparatus of gravitation, econometric and inter-branch models. In the range of gravitation model the researchers make regression equations to predict the foreign trade turnover and export of the Republic of Belarus to the Russian Federation.
Foreign and economic activity of regions, trade and economic integration, trade turnover, prediction, economic and mathematic modelling
Short address: https://sciup.org/147223211
IDR: 147223211 | UDC: 339.9(470+476)
Text of the scientific article Foreign economic activity of the NWFD regions and the republic of Belarus: condition and methodological aspects of modelling
The most important features of the present are growth of cooperation and interdependence of economies of different countries, strong transition of the civilized nations from the close national economies to the open economy faced the external world and development of
* The article is written with the support of the Russian State Scientific Fund grant (project №09-02-00647a/Б).
integration processes at the macro and micro levels. One of the significant characteristics of international integration is foreign economic activity 1 including foreign trade, international production and scientific-and-technical cooperation, investment activity.
The development of the foreign economic activity promotes the growth of national economy, the optimization of structure proportions in the economy, the faster growth of technology, the increase in the efficiency of investments and the solution of social problems. One can say the same about the regions. The international cooperation at the sub-national level is an important factor of social and economic development of the regions. Due to the foreign trade the scanty resources and the narrow domestic regional and national market are retreating, the opportunity to organize mass production is being appeared, the degree of machine utilization is increasing, the efficiency of realization of new techniques and technologies is going up, the savings and the rate of economic growth are rising, we are making the most efficient use of the natural resources and the labour force.
At the present stage the foreign economic activity is a result of international and interregional geographical division of labour and a condition of increase in the efficiency of regional economy. The orientation to large-scale international exchange is safe, because it allows us to extend the set and to increase the number of various consumer services supplied the population and used in the national economy 2.
Therefore, the foreign trade relations are necessary conditions for the functioning of economic complex in any Russian region.
Under the circumstances of decrease in domestic demand the export delivery becomes one of the most important conditions for survival of regional economy. The needs for goods, for expansion of the goods range, for the raw materials and the half-finished products to provide the production processes and the need for machinery and equipment are satisfied at the expense of import.
The development of mutually advantageous cooperation is one of the aims to establish the Union state of Russia and Belarus. The analysis of preconditions for the establishment of the Russian-and-Belorussian economic alliance also shows that compared with other organisations of regional integration in the post-Soviet space it is the Union state that stands a better chance to set up the economic and political union.
The most important preconditions for making the integration of Russia and Belarus deeper are the following:
-
1. The integration of the Russian Federation and the Republic of Belarus will make it possible to solve a number of tasks in the sphere of foreign and defence policy (to eliminate the potential treat from the West, to increase the military facilities of the Union state in the field of conventional weapons, to receive the space for manoeuvre within the scope of Agreement on Conventional Weapons in Europe, to receive some additional opportunities to improve the air and anti-missile defence system, to strengthen Russia’s influence in the world policy by proving its capability to hold such large-scale action as union with the neighbouring independent state).
-
2. The political and psychological benefits are also great: closer relations between Russia and Belarus will make the syndrome of “divided nation” in Russia weaker.
-
3. The basic economic acquisitions for the Union state will be making of the common goods market, labour and capital market and elimination of the barriers on their way.
-
4. The main geo-economic benefit by the integration is that Russia will get the safe
transport passage for goods flow, especially gas flow and later oil flow, and Belarus will get the access to the Russian raw material markets.
Within the scope of the Union state the development of mutually advantageous trade ties between the NWFD regions and the Republic of Belarus is of great importance. In comparison with the mutual trade with other countries their peculiarity is that the trade structure is represented by not only the raw material goods but also the goods of substantial transformation: machines and mechanisms, foodstuffs.
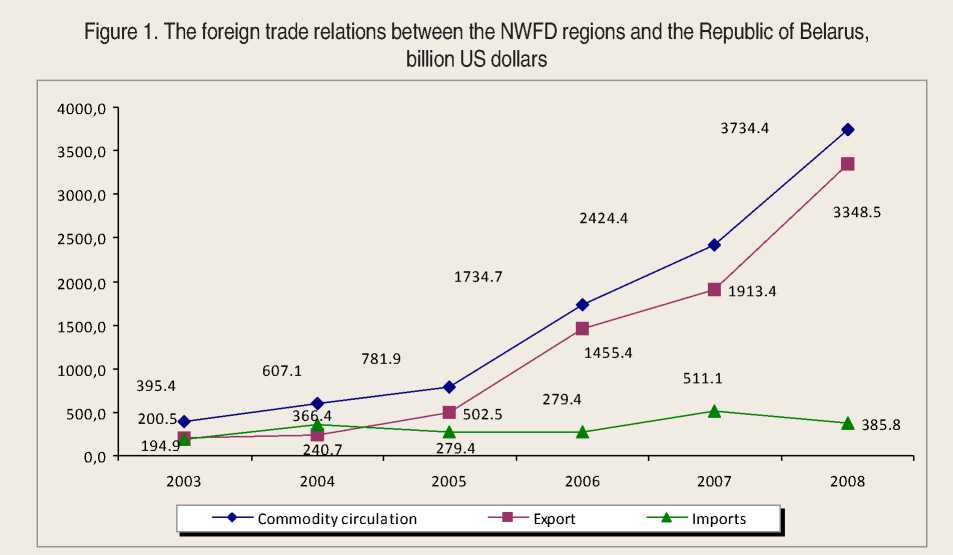
It is necessary to note that for 2003 – 2008 the foreign trade turnover of the NWFD regions with the Republic of Belarus was constantly going up. On the whole it had increased by 9.4 times: the export – over by 16.5 times and the import – by 2 times (fig. 1) .
By the trade turnover with the Republic of Belarus the city of St. Petersburg is in the lead among the NWFD regions (1 bill. 829 mln. US dollars in 2008). Vologda region takes the second place (475.1 mln. US dollars). Kaliningrad (459), Pskov (247.8) and Novgorod (11 mln. dollars) regions also have the stable foreign trade ties with Belarus.
It is possible to mark out at least two basic factors among many other positive factors promoting the growth of mutual trade turnover. They are the strengthening of the ties at the regional level and the active realization of the Union state’s programmes. The valuable thing in this process is that it includes hundreds of enterprises of Belarus and the NWFD regions.
At present over 200 agreements on the trade and economic cooperation have been concluded and are in force at the regional level. The parties solve many issues of international cooperation by the way of the business cooperation council meetings, the joint committees, working groups on cooperation, “round work tables”. The exhibitions and fairs of the Belorussian goods in Russia and the Russian goods in Belarus and the town’s day make a great contribution into the development of cooperation.
The efficient extension of the regional trade and economic cooperation is encouraged by the activity of 15 bipartite working groups, committees and councils including Leningrad, Kaliningrad and Vologda regions and the city of St. Petersburg.
The estimate of the foreign trade activity of the NWFD regions and the Republic of Belarus showed the enhancement of the trade and economic integration. It is proved by the increase in the regional foreign trade quota in six regions of the NWFD for the analyzed period (tab. 1) .
The most active growth of trade turnover of the regions with the partner country was observed in Pskov and Vologda regions and the Republic of Karelia. The degree of the NWFD regions’ resources involvement in the process of international division of labour in the Union state’s economy is characterized by the specific weight of export in the regions’ GRP (tab. 2) .
The growth of this index in almost all NWFD regions testifies dependence of their production on goods distribution in the Belorussian markets.
The growth of the index of mutual trade of the integration subjects in the volume of their GRP says about strengthening of intension of economic interaction and the absolute value shows the importance of interregional trade turnover (export and import) for the economy of the NWFD – a participant of integration ties with the Republic of Belarus (tab. 3) . Over the period under review the index of mutual trade of the North-West Federal District with the Republic of Belarus has increased by 1.8 pt. by trade turnover, by 2.0 pt. by export and it has decreased by 2.0 pt. by import.
Another index used to estimate the level of the regions’ economic interaction by the way of revealing the growth trends concerning the mutual trade of the integration participants is an index of interregional trade turnover of the integrated regions in the trade turnover with
Table 1. The regional foreign trade quota of the NWFD regions and the Republic of Belarus, %
|
Region |
The year of 2003 |
The year of 2004 |
The year of 2005 |
The year of 2006 |
The year of 2007 |
The year of 2008 |
The year of 2008 г. to the year of 2003, pt. |
|
Pskov region |
4.65 |
5.29 |
4.49 |
6.04 |
6.78 |
8.89 |
+4.24 |
|
Kaliningrad region |
6.41 |
6.23 |
4.41 |
3.78 |
2.65 |
6.66 |
+0.25 |
|
Vologda region |
2.43 |
3.31 |
3.47 |
4.37 |
3.83 |
4.20 |
+1.77 |
|
St. Petersburg |
0.22 |
2.68 |
2.32 |
3.39 |
- |
||
|
Novgorod region |
4.28 |
4.34 |
3.92 |
3.29 |
2.95 |
2.53 |
-1.74 |
|
Leningrad region |
0.99 |
0.97 |
1.36 |
1.93 |
- |
||
|
Murmansk region |
1.36 |
1.35 |
0.84 |
0.99 |
0.84 |
1.28 |
-0.08 |
|
The Republic of Karelia |
0.44 |
0.60 |
0.98 |
1.56 |
1.32 |
1.05 |
+0.61 |
|
The Republic of Komi |
1.15 |
0.76 |
0.88 |
0.56 |
1.01 |
1.04 |
-0.11 |
|
Archangelsk region |
0.93 |
0.48 |
0.32 |
0.32 |
2.31 |
0.56 |
-0.36 |
|
… – not available. |
|||||||
Table 2. The specific export weight of the Republic of Belarus in the NWFD regions’ GRP (Re, %)
|
Region |
The year of 2003 |
The year of 2004 |
The year of 2005 |
The year of 2006 |
The year of 2007 |
The year of 2008 |
The year of 2008 to the year of 2003, pt. |
|
Pskov region |
1.70 |
1.74 |
2.04 |
4.33 |
5.05 |
7.21 |
5.51 |
|
Kaliningrad region |
2.27 |
1.89 |
1.96 |
1.99 |
1.57 |
5.27 |
3.00 |
|
Vologda region |
1.44 |
1.55 |
2.41 |
3.33 |
2.95 |
3.42 |
1.98 |
|
St. Petersburg |
0.22 |
2.68 |
2.32 |
3.39 |
- |
||
|
Leningrad region |
0.99 |
0.97 |
1.36 |
1.93 |
- |
||
|
Novgorod region |
2.27 |
1.60 |
1.73 |
2.09 |
2.01 |
1.52 |
-0.76 |
|
The Republic of Karelia |
0.74 |
0.44 |
0.69 |
0.38 |
0.90 |
0.93 |
0.19 |
|
Murmansk region |
0.82 |
0.61 |
0.63 |
0.62 |
0.52 |
0.84 |
0.02 |
|
The Republic of Komi |
0.16 |
0.09 |
0.37 |
0.94 |
0.76 |
0.51 |
0.34 |
|
Archangelsk region |
0.61 |
0.18 |
0.11 |
0.09 |
0.10 |
0.23 |
-0.38 |
|
… – not available |
Table 3. Index of mutual trade of the integration subjects in the volume of their GRP, %
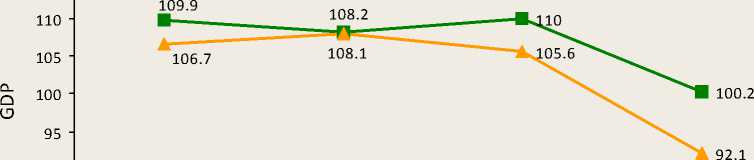
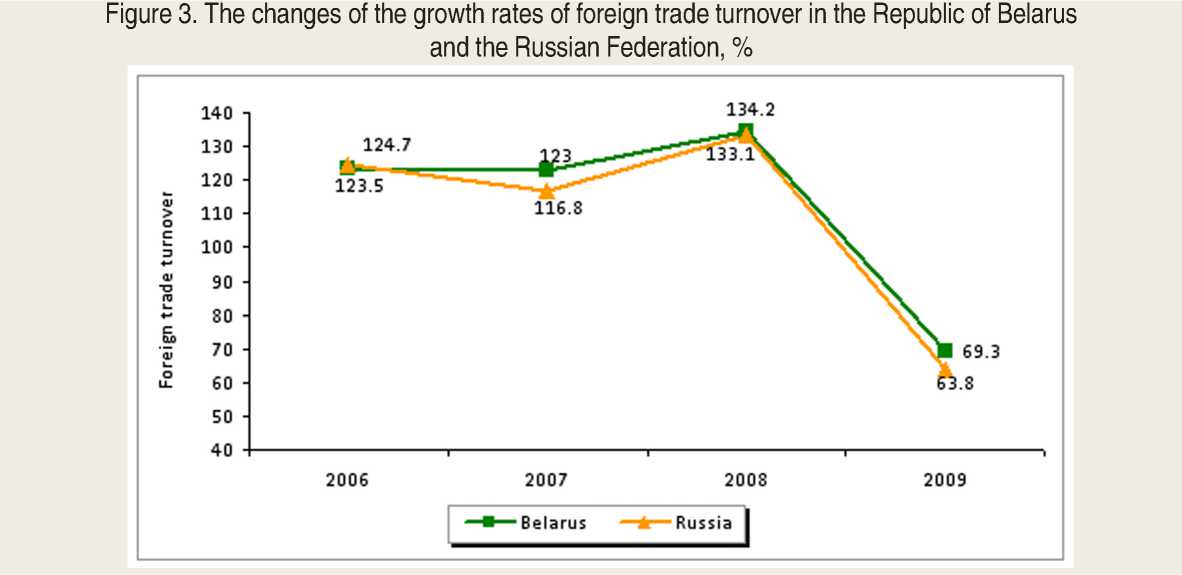
It should be noticed that in recent years the world financial crisis has introduced some significant changes into the economy of our countries. The reduction of demand led to the decline in growth rates of their economies and, as a result, to the decrease in the trade turnover between them (fig. 2, 3) .
For 2008 – 2009 the similar trend was also observed in the foreign trade between the NWFD regions and Belarus (tab. 5) .
Taking into account the importance of foreign economic activity for the development of national and regional economy one can notice that the matters of high priority are to predict the development of the Republic of Belarus within the integration process and to define the integration efficiency. At the same time for effective administration and formation of optimal foreign economic policy it is necessary to use appropriate methodical, first of all mathematical, tools estimating the efficiency of trade-and-economic ties by a number of factors.
The modern science has worked out a number of international trade models. Gravitation models belong to the class of empirical models analyzing the determinants of the interregional interaction. The key idea
Table 4. Index of interregional trade turnover of the integrated regions in the trade turnover with other regions of the country
|
The year of 2003 |
The year of 2004 |
The year of 2005 |
The year of 2006 |
The year of 2007 |
The year of 2008 |
The year of 2008 to the year of 2003, pt. |
|
|
Trade turnover |
1.8 |
2.0 |
2.0 |
3.1 |
3.3 |
3.9 |
2.1 |
|
Export |
0.9 |
0.8 |
1.3 |
2.6 |
2.6 |
3.5 |
2.6 |
|
Import |
0.9 |
1.2 |
0.7 |
0.5 |
0.7 |
0.4 |
-0.5 |
Figure 2. The changes of the GDP growth rates in the Republic of Belarus and the Russian Federation, %
80 ---------------------------------------1---------------------------------------1---------------------------------------1------------------------
2006 2007 2008 2009
— ■ —Belarus —*— Russia
of the gravitation model is the following: the intensity (volumes) of trade between the countries is directly proportional to the size of economies and inversely proportional to the goods transportation cost designed with the help of distance between the countries. Apart from this key interconnection in the model the trade also depends on resources available, on the fact whether the countries are neighbours and on some other political and cultural factors. The modelling of trade by using this methodology makes it possible to prognosticate some potential long-term trade flows [1, 2, 5, 16]. The gravitation models give us a qualitative characteristic of factors influencing on the size and the structure of foreign trade turnover: the export and import capabilities expressed in the offer of some goods in the foreign market and in the demand for other goods; taking into account the factors restraining the foreign trade turnover between the countries (transport cost, tariff system).
The influence of these factors is estimated on the basis of data concerning the factual size of trade turnover between the countries by the way of regression analysis. The parameters of gravitation model received are flexible, they show by how many percents the trade turnover between the countries can increase if the respective factor increased by 1%. This model is usually represented as a power form or a linear-to-log form.
Table 5. The changes of foreign trade turnover in the Republic of Belarus and the NWFD regions, thousand US dollars
|
Region |
The year of 2008 |
The year of 2009 |
The year of 2009 to the year of 2008, % |
|
The Republic of Komi |
116,547 |
376,538 |
3 times |
|
Archangelsk region |
63,546 |
63,152 |
99.4 |
|
Novgorod region |
111,028 |
93,615 |
84.3 |
|
St. Petersburg |
1,639372 |
986,024 |
60.1 |
|
Leningrad region |
432,318 |
251,026 |
58.1 |
|
Murmansk region |
177,962 |
98,128 |
55.1 |
|
The Republic of Karelia |
49,482 |
25,970 |
52.5 |
|
Vologda region |
480,070 |
234,477 |
48.8 |
|
Pskov region |
247,872 |
102,237 |
41.2 |
|
Kaliningrad region |
459,209 |
156,046 |
34.0 |
|
The North-West Federal District |
3,777407 |
2,387214 |
63.2 |
The gravitation model by Ya. Tinbergen is the following:
X ij = α 0 ( Y i ) α1 ( Y j ) α2 ( D ij ) α3 +ε , (1)
where Xij – cost of trade flow from the country i to the country j ;
Yi , Yj – indexes determining the nominal GDPs of the respective countries;
Dij – physical remoteness of the economic centers of the countries i и j ;
ε – random error.
The gravitation model of X. Lineman is more general and is represented as the following:
X ij = α 0 ( Y i ) α1 ( Y j ) α2 ( N i ) α3 ( N j ) α4 ( D ij ) α5 ( A ij ) α6 ( P ij ) α7 +ε , (2)
where Ni and Nj – population size in the given state;
Аij – any other factor favouring or restraining the trade (for example, borders or anti-dumping regime in one of the countries);
Pij – trade preferences existing between the states (if there are no preference agreements Pij = 1; otherwise Pij = 2);
α 1, α 2, α 3, α 4, α 5, α 6, α 7 – export elasticity in conformity with the GDP of the exporter country, with the GDP of the importer country, with the population size of the country i , with the population size of the country j , with the distance between the countries, with any other factor, with the trade preferences.
Having rewritten the equations (1) и (2) in a logarithmical form, we receive the following parameters of mutual trade (export, import):
ln Xij = ln α 0 + α1 ln( Yi )+ α2 ln( Yj )+ α3 ln( Dij ) . (3)
ln Xij = ln α0 + α1 ln( Yi )+ α2 ln( Yj )+ α3 ln( Ni )+ + α4 ln( Nj )+ α5 ln( Dij )+ α6 ln( Aij )+ α7 ln( Pij ) . (4)
The variables are measured by the following units: trade flows (Х) – in mln. US dollars; GDP (Y) – mln. US dollars; population (N) – thousand people; distance (Dij ) – in thousand km; factors influencing on the trade (Аij, Pij ) , possess the values of 1 or 2 according to specific conditions.
For example, the changes of the foreign trade turnover between Russia and the
Republic of Belarus over 1996 – 2003 were described with the following equation by Tinbergen:
ln Xij = 1,23 +0,85 ln( Yi )–0,03ln( Yj )–0,17ln( Dij ), R2 = 0,80 (5)
The correlation between the trade flow and the coefficient of regression model was received with the normal method of least squares (1):
Xij = 3,41( Yi )0,85( Yj )–0,03( Dij )-0,17. (6)
The model produces rather exact results: coefficient of determination R2 is rather high – 0.80.
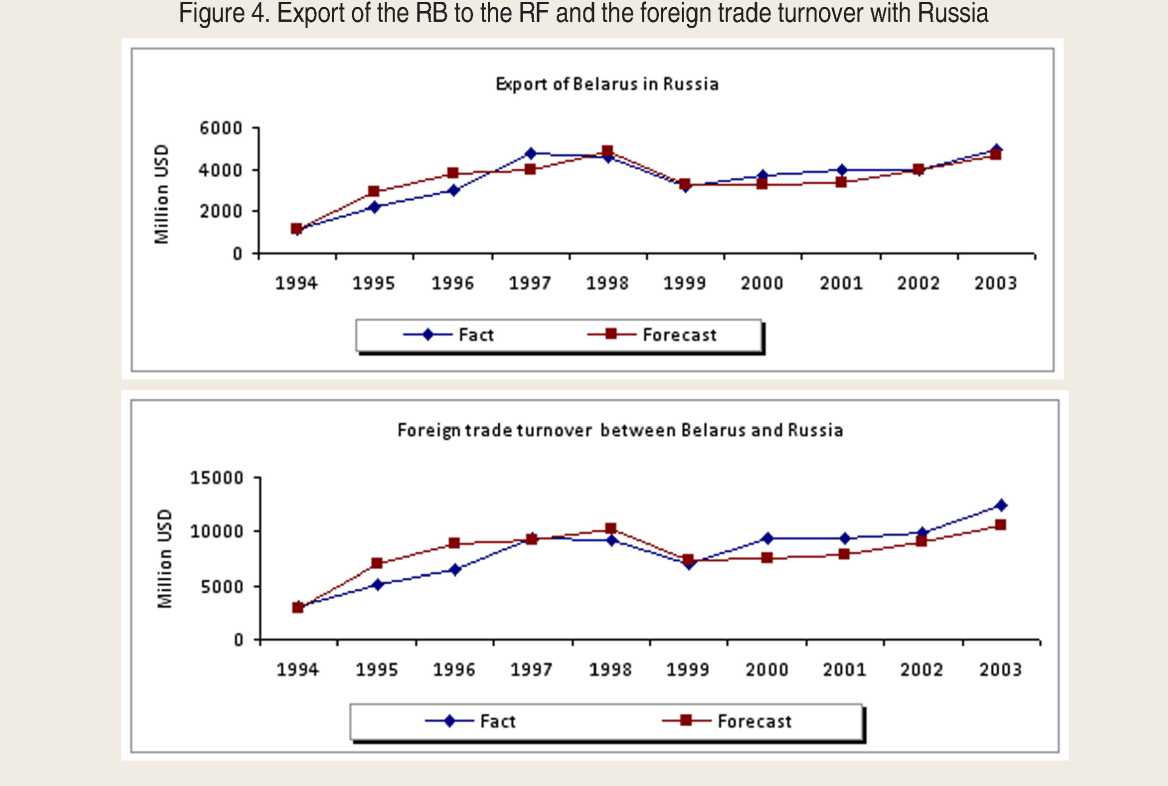
The changes of the foreign trade turnover of the RB with the RF and the export of the RB to the RF are represented in the following diagram (fig. 4) .
The prediction equation of the export of the RB to the RF according to more general gravitation model:
X ij= 0,067( Yi )0,63( Yj )–0,07( Ni )21,78( Nj )11,25, R2 = 0,91 (7)
As follows from the received calculations the general model is the most exact one, as it takes into account more number of factors influencing on the export in this case, and as a result the coefficient of determination has higher value 0.91.
However, it is necessary to notice that the actual data on the Belarus export to Russia and the foreign trade turnover with Russia differ from the forecasting data a little. It can be explained by the fact that another range of factors left out of the model influences on the foreign trade turnover and the export indices. In accordance with the theory of construction and description of the gravitation models the gross domestic product of the exporting country reflects the production capabilities while the GDP of the importing state reflects its market capacity. In the common case these two variables are connected in direct proportion to the trade volume. We note some deviations of the received model from the theory.
The export dependency and the foreign trade turnover dependency on the GDP of the export country (the coefficients standing at the
variable of the exporting country GDP are positive and have a strong static influence and it corroborates the theory) are high in all received models. But the non-elasticity of export and foreign trade turnover to the export country GDP is observed. How can one explain such result? The GDP of the importing state expresses the market capacity and must be directly proportional to the trade flow. It is explained by the difference in the size of the importing country’s GDP and the exporting country’s GDP. The population variable has a negative effect on the trade flows between the countries but the variable held constant “the RF population” is positive, in this case it can be explained by the fact that a great number of population promotes the development of the economy scale and favours accumulation of the export and it determines the positive sign of the constant “the RF population”.
Thus, the possibility to use the gravitation models in the represented way for the countries with a great difference in the produced GDP gives rise to some certain doubt.
Besides the mentioned approach to the modelling of foreign trade relations the scientists have worked out other versions of econometric modelling taking into account some concrete needs [3, 4]. For example, to analyze the import:
Mi = A ( Pfi / Pdi ) β 1(1+ Ti ) β 2( Xi ) β 3 , (8)
where Mi – the import of the country of goods i; Xi – intraregional capacity; А – normalization factor;
Pfi – import price;
Pdi – domestic price;
Ti – import duty;
β I – elasticity coefficient.
The demand for import can be predicted on the basis of the following simplified formula:
IM/P im = a 0 + a 1 y d + a 2 P im /P d , (9)
where IM – import cost by the current prices; yd – actual domestic GDP;
Pim – index of import prices;
Pd – weighted average index of the main competitors’ export prices;
а 0 ,a 1 , a 2 – coefficients of regression equation.
The prediction of the volume of exports can be based on the separate prediction of the goods the export of which depends first of all on the possibility to produce them as much as it is necessary to export them, if we assume that there is a perfect elasticity of demand for them and their export depends on the demand for them in the world market. Thereafter, the forecast is built by the demand or by the supply or some econometric combination of them.
The offer of goods for export can be estimated using the following simplified formula:
X / P x = a 0 + a 1 P x / P d + a 2 y d , (10)
where Х – export cost by the current prices;
Рх – index of export prices;
Pd – index of domestic prices;
yd – actual GDP;
а 0 , a 1 , a 2 – coefficients of regression equation.
The ratio shows that the offer of goods for export in real terms (C/Rx ) depends (with positive sign) on the export and domestic exported goods prices (Px /Pd ) and (with negative sign) on the actual domestic demand (yd), as well as on a range of other factors which are caught by the coefficient а0.
One can approach to the estimation of potentially possible volume of exports with the view to the demand for them. The demand for export is worthwhile to be estimated for those commodity groups the export of which is more dependent on the demand for them than on the capability to produce them. The demand for national export function from the world market can be estimated on the basis of the following equation:
X / P x = a 0 + a 1 y w + a 2 P x / P w , (11)
where Х – export cost by current prices;
Рх – index of export prices;
уw – actual world GDP;
Pw – weighted average index of the main competitors’ export prices;
а 0 ,a 1 , a 2 – coefficients of regression equation.
The ratio shows that the demand for the country’s export depends (with positive sign) on the size of actual world GDP, to be more precise, on the changes of actual GDP of the main trading partners and (with negative sign) on the export an world prices ratio and some other parameters. All other conditions being equal the growth of the world GDP means an increase of income in the foreign countries. It can be spent on buying some export commodities of the country. On the contrary, if the growth of export prices of the country’s commodities exceeds the growth of prices of the same commodities exported by the nearest competitors it will inevitably have a negative impact on the demand for export. It is supposed again that the coefficient а0 catches all the rest factors influencing on the demand for export.
Besides these relatively simple approaches to the modeling of economic ties between the countries we can examine more complicated approaches:
– macro structural optimization models of economy of some countries with comprehensive foreign trade block;
– inter country optimization macro structural model;
The first type of model has an advantage that it is simpler and it can take more typical account of structural peculiarities of economies of some certain countries. But the use of such models requires the follow-up difficult and labourintensive work on the adjustment of predictive estimates of some country models. The second type of models is more complicated model construction requiring some certain unification of modeling of economy structure of some certain countries. Therewith, its advantage is an automatic formal adjustment of the received solution between the countries. Of course, there may be a necessity for discussion of it in essence.
Two inter-sectoral balances of the Republic of Belarus and the Russian Federation underlie the bizonal inter-sectoral model. The latter is formulated as a task of linear programming providing the maximization of some economic indices under the fixed set of constraints [9]. The most important of them are equations of production balance and distribution of every zone’s production into productive and non-productive consumption, accumulation and basic funds wear recovery. Besides that every equation reflects export and import. The variables are not only the volume of production but also some elements of end product including the indices of inter-republic and foreign economic relations. The model also contains the equations to determine cumulative size of export and import in value terms. These equations are the basis to introduce restrictions on the quantities of foreign trade and interrepublic balance. According to the concrete problem definition there may be direct restrictions set on the production volume, interrepublic delivery, export and import in the model.
As a criterion function one can use maximization of the domestic end product representing a sum of consumption fund, accumulation and basic funds wear recovery. According to the problem definition both cumulative domestic end product of both zones and domestic end products of each zone are maximized. The maximization of cumulative domestic end product of both zones is advantageous because in this case a finding of agreed solution is simulated. Such solution provides the maximization of collective effect or minimization of collective damage for them when the connections between them are being changed.
So, it is time to determine the critical parameters and variable models. Let the index b determine the parameters’ and variables’ property to the sectors of the Belorussia’s economy and the index r – the property to the sectors of the Russia’s economy.
Then the decision variables are:
Хbi and хri – volumes of production of i-th sector of the economy of the Republic of Belarus and the Russian Federation; Gb and Gr – consumption funds in Belarus and in Russia; Sb and Sr – accumulation and basic funds wear recovery funds in the RB and in the RF; Vbi – interstate export of the production of the sector i from the RB to Russia (it is simultaneously import of the production of the Russia’s sector i from Belarus); Wbi – interstate import of the production of the Belarus sector i from Russia (it is simultaneously export of the production of the Russia’s sector i to Belarus); Ebi and Eri – export of the production of the sector i from the RB and Russia less the volume of interstate turnover; Mbi and Mri – import of the production of the sector i to Belarus and Russia; Vb and Wb –cumulative inter-republic export from Belarus and Russia and import to the RB and Russia; Еb and Еr – cumulative export of the Republic of Belarus and Russia; Мb and Мr – cumulative import of the RB and Russia.
The parameters of the model are:
aij – production cost coefficient of the sector i per unit of thе sector j ; gi – patterns of consumption by the sector i ; si – coefficient of the pattern of accumulation and basic production assets recovery; pi – index of reappraisal of the domestic prices into the foreign trade ones; Dbr – balance of the foreign trade relations between the Republic of Belarus and Russia; Db, Dr – balance of the foreign trade relations of the Republic of Belarus and Russia; x 0bi, x 0ri – limiting values of the product output of the Belarus’ and Russia’s sectors; V0b and W0b – limiting values of the interstate export-import of Belarus and Russia; E0b,E0r – limiting values of the export of the Republic of Belarus and Russia; M0b,M0r – limiting values of the import of the Republic of Belarus and Russia.
The whole system of balance equations is composed of two groups of equations – Russia and the Republic of Belarus. The basic balance equation for the sector i of the Republic of Belarus is the following:
x bi = ∑ a bj x bj + G bi + S bi + V bi – W bi + E bi –M bi . (12)
This formula is a little bit different for the economy of the Russian Federation, because the production export of the sector i from the Republic of Belarus is the production import of the sector i of the Russian Federation:
xri = ∑ a rj xrj + Gri + Sri – Vbi + Wri + Eri–Mri . (13)
The economic content of the equations (12) and (13) is that the volume of production in physical terms for a perspective period must be enough to satisfy some certain level of production consumption as well as of the volume of final use of the given item of production.
As it follows from the equations, the only balance connective determining the connection between the states is volumes of interstate delivery of Vbi and Wbi . For the task is considered from the view of the Republic of Belarus, the given variables were decided to take with the index b, all the more this approach will make it possible to decrease an order of a matrix a little due to the lack of necessity to introduce a new variable.
Depending on the purpose the restrictions on the maximum permissible volumes of production by the sectors can be introduced in the model. In some certain cases restrictions on the inter-republic delivery, export and import of some items of production are included. These restrictions take into account the available foreign trade agreements and the state of the world market. The system of these restrictions provides the management of the foreign economic relations structure.
If the task is to find an optimal economic interaction, maximization of the accumulation and consumption funds of both states can be used as a criterion function:
F = Gb + Sb + Gr + Sr → max . (14)
If you have data on some certain macroeconomic indices you can calculate the value of GDP for every state.
The GDP equation is:
Yb = α bNb, (15)
where Y – gross domestic product;
N – national income used ( N=G+S );
α – coefficient of GDP and national income ratio.
At the end one can use also the maximization of gross domestic product as a criterion function:
Y → max (16)
As the result of calculations one has determined the forecast of mutual balanced index system: the volumes of gross domestic product, of national income, consumption fund and accumulation fund; the volumes of production by the sectors and by the most important items of production; the economy’s needs for the major material resources according to the directions of their use; the volumes of foreign trade production delivery between the countries.
There is no doubt that there are much more models permitting us to model the foreign economic relations. We have tried to show that when researching the problems of foreign economic activity one can use various mathematical tools to describe its different aspects.
References Foreign economic activity of the NWFD regions and the republic of Belarus: condition and methodological aspects of modelling
- Anderson, J.E. Gravity with gravitas: a solution to the border puzzle/J.E. Anderson and van E. Wincoop//American economic review. -2003. -Vol. 93 -№ 1. -Рp. 170-192.
- Tamirisa, N. Exchange and capital controls as barriers to trade/N. Tamirisa//IMF Staff Papers. -1999. -Vol. 46. -№ 1. -Рp. 57-68.
- Asanovich, V.Ya. Economic and mathematical methods and models in the international economic relations/V.Ya. Asanovich. -Minsk: BSEU, 2003. -99 pp.
- Balatski, E.V. Modelling of increase policy of foreign trade operations efficiency/E.V. Balatski//International economic relationship. -2002. -№2.
- Belenki, V.Z. Estimate of active export-import policy on the basis of open stationary model of Russia’s economy/V.Z. Belenki, I.I. Arushanyan//Economics and mathematical methods. -1995. -Iss. 1. -Pp. 83-97.
- Belenki, V.Z. Methodological analysis of optimization versions of foreign economic relations of Russia/V.Z. Belenki, I.I. Arushanyan//Economics and mathematical methods. -1995. -Iss. 4. -Pp. 105-115.
- Grinberg, R.S. Expansion of the European Union and economic interaction of Belorussia and Russia/R.S. Grinberg//The Belarusian economic journal. -2004. -№3. -Pp. 53-58.
- Klotzvog, F.N. Use of bizonal inter-sectorial model in the analysis of inter-republic economic relations of Russia/F.N. Klotzvog, D.A. Matznev, V.A. Safronov//Economics and mathematical methods. -1994. -Vol. 30. -Iss. 1. -Pp. 67-80.
- Kireev, A.P. International economics: in 2 parts/A.P. Kireev. -M., 2000.
- Kachurovsi, E.P. New trade policy/E.P. Kachurovski. -Minsk, 2002. -120 p.
- Koval’, Yu.P. Differentiated approach to the demand assessment in the Russian Federation for the Belorussian goods export/Yu.P. Koval’//The Belorussian economy: analysis, forecast, regulation: economic report. -2005. -№2.
- Interregional inter-sectorial models of the world economy/ed. by A.G. Granberg and S.M. Men’shikov. -Novosibirsk: Science, 1983. -273 p.
- Modelling of global economic processes: teaching aid for the higher education students of the speciality “Economic cybernetics”/ed. by V.S. Dadayan. -M.: Ekonomika, 1984. -320 p.
- Smirnova, T.G. Assessment of trade and economic integration of the NWFD regions with the Republic of Belorussia/T.G. Smirnova, R.Yu. Selimenkov//Problems of territory development. -2010. -№5. -P. 20.
- Statistical data . -Access mode: http://www.belstat.gov.by; http://www.president.gov.by; http://www.nbrb.by; http://www.gks.ru; http://www.cbrf.ru
- Shaytanova, N.A. Gravitation models and possibility of using them in the prediction of foreign trade of the Russian Federation and the Republic of Belorussia/N.A. Shaytanova, V.Ya. Asanovich//Information technologies of management in economics. -2006: the materials of the republican theoretical and practical conference, Brest, the 25th -26th of April, 2006/the Pushkin’s Brest State University; ed. by S.A. Tuzik. -Brest: BrGU, 2006. -96 p.
- Rybalkin V.E., Scheprbanin Yu.A., Baldin L.V. International economic relationships. -M.: Yuniti-Dana, 1997. -384 p
