From Nature to UAV - A Study on Collision Avoidance in Bee Congregation

Author: Nahin Hossain Uday, Md. Zahid Hasan, Rejwan Ahmed, Md. Mahmudur Rahman, Abhijit Bhowmik, Debajyoti Karmaker
Journal: International Journal of Intelligent Systems and Applications @ijisa
Article in issue: 3 vol.16, 2024.
Free access
Insects engage in a variety of survival-related activities, including feeding, mating, and communication, which are frequently motivated by innate impulses and environmental signals. Social insects, such as ants and bees, exhibit complex collective behaviors. They carry out well-organized duties, including defense, nursing, and foraging, inside their colonies. For analyzing the behavior of any living entity, we selected honeybees (Apis Mellifera) and worked on a small portion of it. We have captured the video of honeybees flying close to a hive (human-made artificial hive) while the entrance was temporarily sealed which resulted in the” bee cloud”. An exploration of the flight trajectories executed and a 3D view of the” bee cloud” constructed. We analyzed the behaviors of honeybees, especially on their speed and distance. The results showed that the loitering honeybees performed turns that are fully coordinated, and free of sideslips so thus they made no collision between themselves which inspired us to propose a method for avoiding collision in unmanned aerial vehicle. This paper gives the collective behavioral information and analysis report of the small portion of data set (honeybees), that bee maintains a safe distance (35mm) to avoid collision.
Honeybee, Collision Avoidance, Safe Distance, Unmanned Aerial Vehicle
Short address: https://sciup.org/15019371
IDR: 15019371 | DOI: 10.5815/ijisa.2024.03.06
Text of the scientific article From Nature to UAV - A Study on Collision Avoidance in Bee Congregation
Researchers are increasingly looking to nature for inspiration in their hunt for novel solutions to challenging issues spanning a variety of disciplines. Bio-inspired computational techniques, which take inspiration from the diverse range of biological systems, present exciting opportunities for addressing complex problems in domains such as pattern recognition, design, and engineering, as well as optimization and optimization. This study explores the exciting field of bio-inspired computing and looks at several approaches that mimic the effectiveness, flexibility, and resilience seen in biological systems.
Human ingenuity has historically drawn inspiration from nature. Biological systems have developed sophisticated strategies to navigate and flourish in complicated settings, from the flight of birds to the resilience of ecosystems. Through comprehension and simulation of these processes, scientists have created computer models and algorithms that can resolve issues that are beyond conventional methods.
Swarm Intelligence [1] algorithms use the collective intelligence of decentralized systems to facilitate effective data grouping and optimization. Ant Colony Optimization (ACO) [2] is a technique used to solve routing and scheduling issues. It is inspired by the foraging activity of ants. In the meanwhile, complicated optimization problems like anomaly detection and intrusion detection are handled by Artificial Immune Systems (AIS) [3] and Evolutionary Algorithms (EA) [4] using concepts from immunology and genetics.
Biomimicry provides a direct translation of biological principles into inventive design and engineering solutions, going beyond computational techniques. Examples include lightweight constructions fashioned by bones and Velcro inspired by burrs. Moreover, new paradigms that bridge principles from computer science, engineering, and biology, such as Physarum Optimization [5] and Memetic Algorithms[6] , highlight the multidisciplinary character of bio-inspired computation.
Ships make use of Genetic Algorithms (GA) [7] to run predictive models that forecast the existence of obstacles and evaluate the likelihood of collisions, maximizing their course for economy based on a predetermined cost function. Enhanced Genetic Algorithms (GA)[8] combine stochastic prediction techniques with maritime traffic laws to allow ships to manage collision scenarios while following maritime navigation standards.
From our daily experience we can figure out that speedy driving around a corner can be a reason for collision. Sometime speedy driving causes the failure of maintaining a safe distance between the vehicles which ends in an accident due to collision. So, maintaining speed and a safe distance are so important for avoiding collisions in any kind of vehicle. But maintaining these two constraints often becomes tough. Bioinspired computational algorithms can be used in a variety of ways to solve these difficulties. Therefore, to prevent collusion, we extensively explore the honeybee's collision avoidance strategy in this work and determine the safe distance between two bees. This method might assist academics in improving optimistic algorithms for use with unmanned aerial vehicles and many more.
2. Literature Review
There are many algorithms developed in this field along with a huge number of applications. One of the [9]shows that the visual stimuli response mechanisms of fruit flies (Drosophila melanogaster) in both free flight and a tethered flight simulator. Fruit flies showed evidence of a dual visual response system, exhibiting high repulsion towards smaller visual stimuli and attraction towards long vertical objects. The strong aversion to small spots acts at a much greater distance, acting as a defensive mechanism against potential threats like aerial predators or collisions with other insects, while the attraction toward long stripes suggests a navigation strategy toward favorable locations like vegetative perches or feeding sites. In contrast to conventional looming reflexes, the observed distance-dependent functioning of the aversion to tiny spots highlights the flies' sophisticated capacity to perceive and respond to visual stimuli. The work highlights a basic mechanism of object classification that drives the flies' behavioral decisions and establishes a foundation for investigating the neurological underpinnings of decision-making in the genetic model organism during flight.
Van Breugel et. al [10]investigate fruit flies' (Drosophila melanogaster) landing behavior in detail while they are free to fly. By using high-speed digital imaging and a real-time 3D tracking system, the researchers record the entire landing sequence with the goal of comprehending the complex sensorimotor processes involved in identifying a visual target, turning toward it, slowing down, and extending the leg in preparation for landing. The results show that the landing behavior is organized into three modules: a directed body saccade that initiates an active turn towards a stationary target, a deceleration that is based on the size and expansion rate of the visual target, and leg extension that is triggered by a specific retinal size threshold of about 60 degrees. Furthermore, a comparison of the "fly-by" trajectories offers valuable information on the decision-making processes involved in successful landings as opposed to flight paths that result in abortion. This comparison highlights a focused unpleasant saccade in the latter case, where the target subtends a retinal size of around 33 degrees. All things considered, this work provides important new understandings of the coordinated sensorimotor modules that underlie the landing and search actions of insects.
Milde, M. et. al. [11] tries to transform mobile agents (biological or robotic) in terms of collision avoidance capabilities by utilizing a dynamic vision sensor (DVS) to effectively extract optic flow information for obstacle identification. The research addresses computing problems by actively separating rotational and translational optic flow components through the adoption of a saccadic method inspired by insects such as flies and bees. Using a plane-fitting technique, the event-based data from the DVS provides a simplified method for extracting depth-structure from translational optic flow. An effective and reliable collision avoidance method that has been successfully tested on a robotic platform in an open-loop situation is demonstrated in practice by the calculated collision avoidance direction, which is obtained from the depth-structure.
In a semi-outdoor setting with a large number of bees flying close to one another, [12] examined the turning flight characteristics of loitering honeybees (Apis Mellifera). The findings showed that loitering bees performed turns that are fully coordinated and free of side slips, meaning that no collisions occurred between those honeybees in their experiment.
Ravi, S. et. al [13]presents a collision avoidance model that takes its cues from optic flow characteristics on a spherical eye during translation and insect behavior. Insects actively segregate translational and rotational optic flow components via a saccadic method. With the help of local spherical eye characteristics, the suggested model ensures collision avoidance by extracting depth information from translational optic flow. The effectiveness of the model under closed-loop settings is demonstrated by testing using geometrically specified optic flow. Replicating the behavior of insects, the integration of bio-inspired correlation-type elementary motion detectors improve collision avoidance even further. The model demonstrates goal-directed behavior that is similar to insect navigation algorithms when paired with goal direction in crowded surroundings.
To better understand how honeybees use optical expansion signals while landing on vertical surfaces, Goyal et. al. [14]investigate how they respond to visual inputs with their sensory-motor control mechanisms. A modular landing control system is demonstrated by honeybees, who defy expectations of a constant optical expansion rate set-point by gradually modifying their optical expansion rate throughout approach flights. The landing model that was discovered and first noticed in bumblebees turns out to be the most appropriate for honeybees. Step-by-step adaptation of the optical expansion rate by bees enables safe and dependable landings on landing platforms in a variety of flying situations and visual patterns. These findings offer promise for bioinspired guiding systems in flying robots, as well as insights into the intricate landing methods of honeybees.
In order to avert undesirable scenarios, this research investigates the collision avoidance methods and dynamic speed and distance modifications made by loitering honeybees. The next sections offer a thorough explanation of our strategy, methods, and experimental configuration from Section 2, together with information on participants, driving forces, and the steps involved in capturing and reassembling 3D trajectories. A comprehensive study of honeybee distance and speed is provided in Section 3, along with a summary of the main conclusions drawn from our research. While Section 5 summarizes the article with findings from our investigation and suggests directions for future research, Section 4 discusses the results.
Path planning, formation control, vision-based surveillance, and navigation in unmanned aerial vehicles can all be enhanced by bio-inspired computing[15]. Unmanned Aerial Vehicles (UAVs) can effectively monitor extensive infrastructures by utilizing wireless networks to gather data.[16] used environmental parameters and sensor data to create an ideal flight path using multi-objective bio-inspired algorithms. First, they used data points which are obtained using UAV-sensor communication, and then the path between neighboring sites is determined. Sensing, energy, time, and risk considerations are prioritized while choosing the optimal flight path through the use of a combined genetic algorithm and ant colony optimization. Inspiration from collision avoidance strategies could emphasize the studies.
To improve performance in unfamiliar surroundings, the bio-inspired path planning algorithm for UAV obstacle avoidance delivers quick speed, fewer route points, and low latency real-time planning [17] provide a 3D route planning algorithm that draws inspiration from biology and imitates plant development principles like phototropism and negative geotropism. Unmanned aerial vehicle (UAV) navigation is made efficient by this algorithm, which has quick planning and few route points for real-time, low-latency navigation. Its viability is validated using ROS in the Gazebo simulator, and then autonomous obstacle avoidance is demonstrated through real-world UAV flying testing.
The development of autonomous vehicles depends on resolving legal and safety issues; collision avoidance technology is essential for reducing collisions. We present a bio-inspired collision avoidance technique employing virtual pheromones, inspired by natural swarm systems. Although earlier studies showed promise, creating individual controllers for swarm optimization is difficult. Deep reinforcement learning and virtual pheromones are used in bees' bio-inspired collision avoidance tactics to train controls for autonomous vehicle.[18] provide a unique deep reinforcement learning (DRL) method that improves stability, efficacy, and robustness over manual tuning by utilizing noise-augmented weights and Highlight Experience Replay. The effectiveness of our DRL-based controller is confirmed by experimental results in a range of traffic conditions. The Highlight Experience Replay approach shortens the training period greatly.
A hybrid approach[19], which is based on biotracking and mimics the actions of ants and bats, successfully prevents prototype cars from colliding with obstacles, improving safety and bridging the gap between engineering and nature has been investigated. Conventional approaches find it difficult to meet the requirement for smooth trajectories while arriving at the goal rapidly, which prompts research into bio-mimicry approaches such as Swarm Intelligence. The hybrid model, which uses ultrasonography to identify obstacles and make avoidance judgments, emulates the behaviors of ants and bats and successfully avoids collisions in prototype cars. The combination of natural senses with mechatronics has the potential to improve safety and build connections between engineering, nature, and theoretical mathematics.
According to the resent studies [20] new bioinspired algorithms are being developed to address the complicated difficulties related to multi-UAV route planning, including avoiding collisions and environment navigation under fast changing conditions. Studies investigate local route planning techniques for UAVs to safely maneuver in the event of an impending collision, even in the lack of global environmental information. Hybrid path planning techniques are also becoming more and more popular; these are especially useful for effectively traveling across partially understood areas. Initiatives include the creation of mission settings and reference maps with varying levels of complexity to aid in the assessment and comparison of new ideas. Furthermore, concerted attempts are underway to create benchmark maps particularly designed to address the special difficulties posed by UAV operations in three-dimensional situations.
For analyzing the behavior of any living entity, we selected honeybees and worked on a small portion of it. There are several motivations for selecting honeybees as our experimental subject. For example, bees never collide with each other while flying in close proximity, million years of evolution have made them successful in achieving flight behavior and the significant part is they are very intellectual while their brains are less than two cubic millimeters in volume which is only about 0.0002 percent of our human brain. For experimenting the honeybee’s behavior, we visited a farm where the honey farmers collect the honey by providing human made hives (artificial hives) to their honeybees (Apis Mellifera).
-
3.2. Experimental Configuration
We temporarily blocked the entrance of a hive for experimenting with their behavior like how they would communicate with each other without making any collision. By blocking their entrance, the returning bees were temporarily denied to have entry into the hive but they were flying and loitering near to the entrance of the hive and attempting to make the entry into the hive which caused the ‘bee cloud’ (Please see Appendix A for clear view).
Meanwhile we made the calibration using a checkerboard (as shown in Fig 2) for two cameras from a different angle and distance.
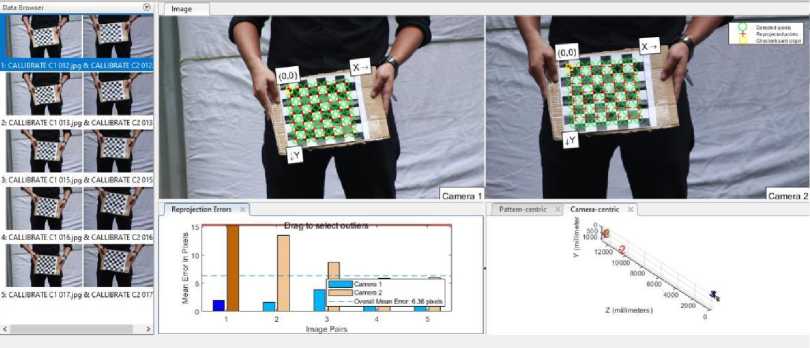
Fig.1. Calibration using a checkerboard
The measurement of a single rectangle of this checkerboard was 1 inch or 26 . 4 mm , the distance between two cameras was 8 cm and the heights from the ground of the both cameras were 30 cm . We filmed that bee cloud by using two synchronized digital cameras (canon) to capture the stereo data as shown in animated Fig 2. The cameras recorded video at 29 . 970 fps with 1920 X 1080 (Width X Height) pixels resolution.
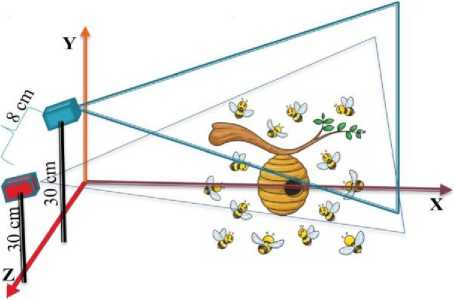
Fig.2. Experimental setup
-
3.3. Recording
-
3.4. Reconstruction of 3D Trajectories
After performing the stereo camera calibration, we filmed the video by those two cameras with a good synchronization so that we could clearly identify each bee’s head and tail positions graphically in each frame to acquire the bee’s position coordinates in each view. First, we split the video of both cameras into several durations. Then we took the same split of the video of both cameras and converted each video into 696 number of frames. Then we selected same 15 (approximately 0 . 5 second) suitable frames from each camera’s generated frames for our experiments. Each frame contained 0 . 033 second.
We analyzed the bees position using “Labelme” [21] by manually annotating each bee’s position from frame to frame by drawing a rectangle on each bee with different id name (as shown in Fig 3) which resulted the JSON files consist of the coordinates of the loitering honeybees for each frame.
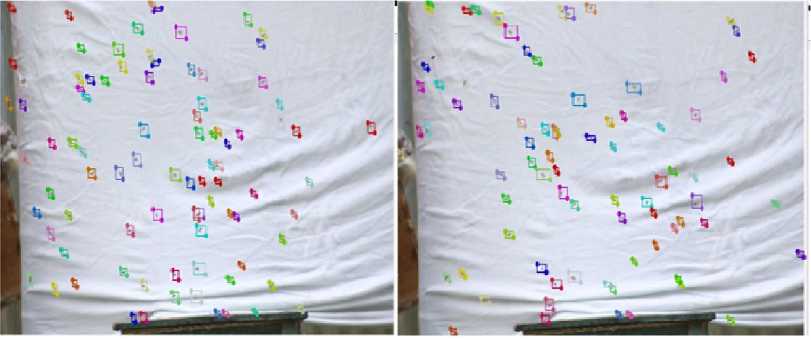
Camera: 2
Camera: 1
Fig.3. Bee annotation
We wrote a program in Python which took the JSON file as input and read those JSON files and play the frames sequentially so that it should appear like a video where every bee’s position was traced and clearly identified. And later we reconstructed a 3D view of the” bee cloud” of 101 honeybees covered in the frames(1 - 15) as shown in the Fig 4.
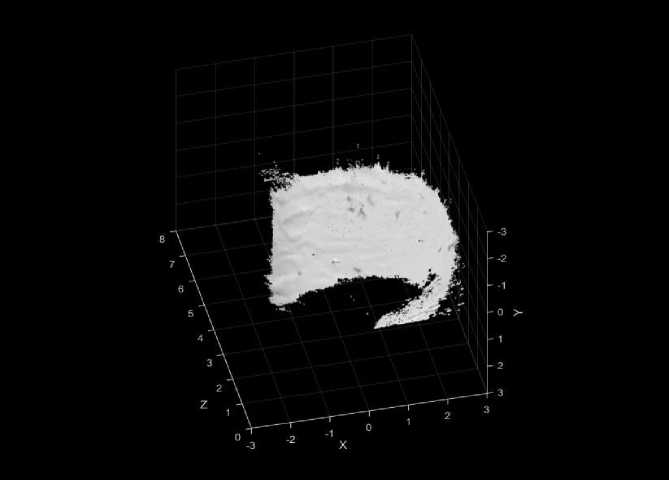
Fig.4. 3D view of the” Bee Cloud” of 101 honeybees
To compute linear distance between honeybees we used the Euclidean distance formula [22]is shown in Equation (1)
d(p,q) = d(q,p) = J^^ i -P t )
Here, p & q are two different points. We used distance( d ) and time( t ) to compute the speed( s ) of the honeybees is shown in Equation (2)
d
s = -t
4. Results
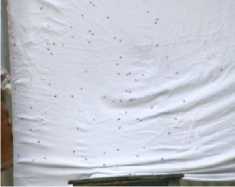
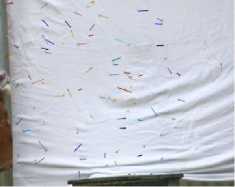
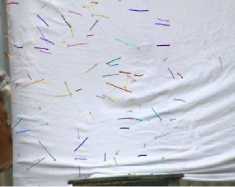
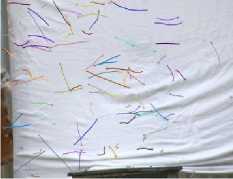
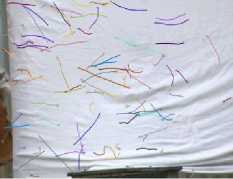
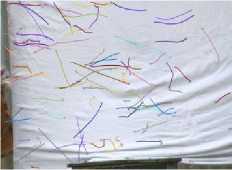
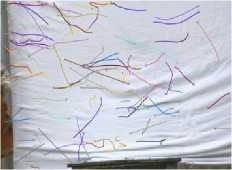
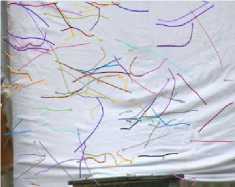
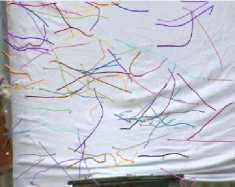
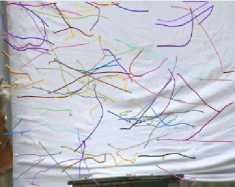
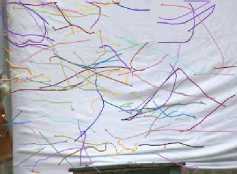
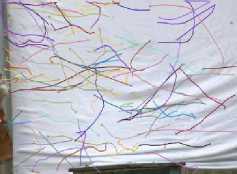
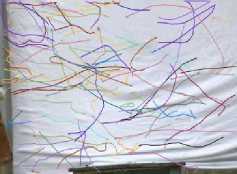
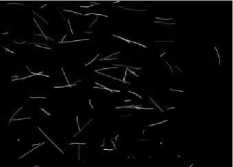
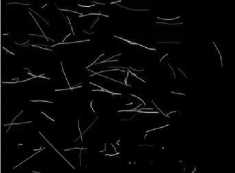
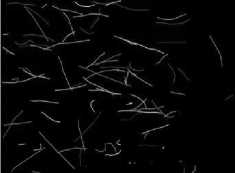
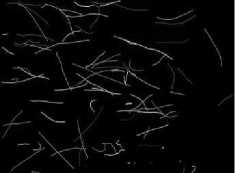
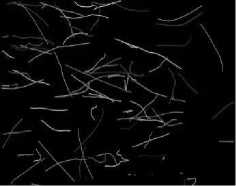
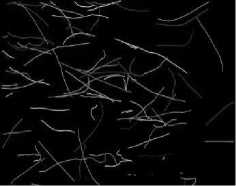
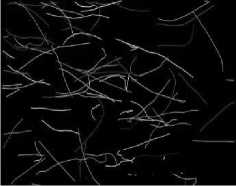
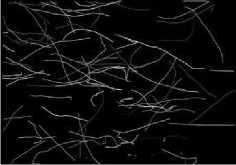
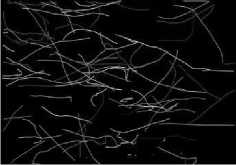
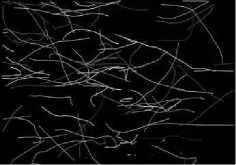
We plotted the trajectory of the bees (as shown in Fig 5) by tracing the midpoint which we saved in the JSON file. The bee trajectory frames were placed sequentially to make the trajectory video. As we took 15 frames, each frame contains 0.033 sec. In this fraction of second, we analysis the bee trajectory, its speed, and the distance. We set up some criteria to identify these parameters. In Fig 5, The bee’s trajectories are directly shown from the actual frame to frame. Then we change the background to have a clear vision of the bee trajectories as shown in Fig 6.
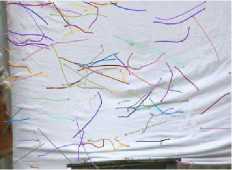
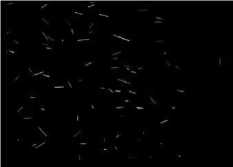
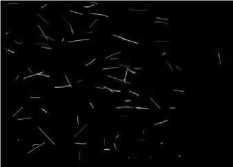
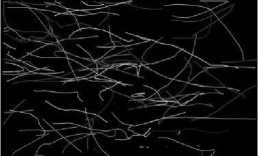
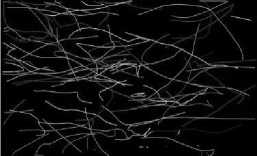
In Fig 6, we didn’t count Frame: 1 as it is the start of trajectory so it reflects nothing in this clear vision background. It looks meaningless at first glance but when we get the data as per our parameters, we found a lot of facts related to this trajectory path. First, we generated 3D positions of the bees in our frames. To do that we performed camera calibration. We used Matlab[23] for camera calibration. There are some steps in 3D position generation. First of all, we generate rectified camera frames. From the rectified camera frames, we generate disparity map. Disparity map generation is important for merging the two camera views. Then we generated 3D visualization and positions of the bees. The area is plotted in millimeter scale. The axis information is then converted to a JSON file and later it converts to CSV file format. After that, we randomly selected 10 bees and calculated distance for every bee from our selected bees. The selected bees were random but there was a criterion that the selected bees are present in every frame. We found many bees which were present in every frame in these 15-frame season. We call our selected bees “Target bees”. From target bees we calculated distance for every other bee by using Euclidean distance theorem from Equation (1). We plotted this in a radar view graph for every frame as shown in Fig 7.
After this step we generated CSV files for further analysis. We implemented KNN for our target bees. We considered a threshold of different radius. A threshold is a radius of surrounding area of our targeted bees. We considered every bee entering this threshold. The entering bees were the nearest neighbor for our target bees as we implemented KNN algorithm. We calculated their speed and distance from our target bees. Graphs in Fig 9 are the bees distance bar chart. We reduced the threshold value and checked the results for different thresholds, and we got the result that bees were maintaining this minimum distance from other bees. Sometimes the distance was crossed but the majority number of bees were maintaining a specific distance.
(a) Frame: 1
(b) Frame: 2
(c) Frame: 3

(d) Frame: 4
(e) Frame: 5
(f) Frame: 6
(g) Frame: 7
(h) Frame: 8
(i) Frame: 9
(j) Frame: 10
(k) Frame: 11
(l) Frame: 12
(m) Frame: 13
(n) Frame: 14
(o) Frame: 15
Fig.5. Bees trajectory
(b) Frame: 3
(a) Frame: 2
e) Frame: 6
(c) Frame: 4
d) Frame: 5
h) Frame: 9
Frame: 7
Frame: 8
(j)
Frame: 11
Frame: 12
i) Frame: 10
Frame: 13
(k)
(m) Frame: 14
(l)
(n) Frame: 15
Fig.6. Bees Trajectory in clear vision
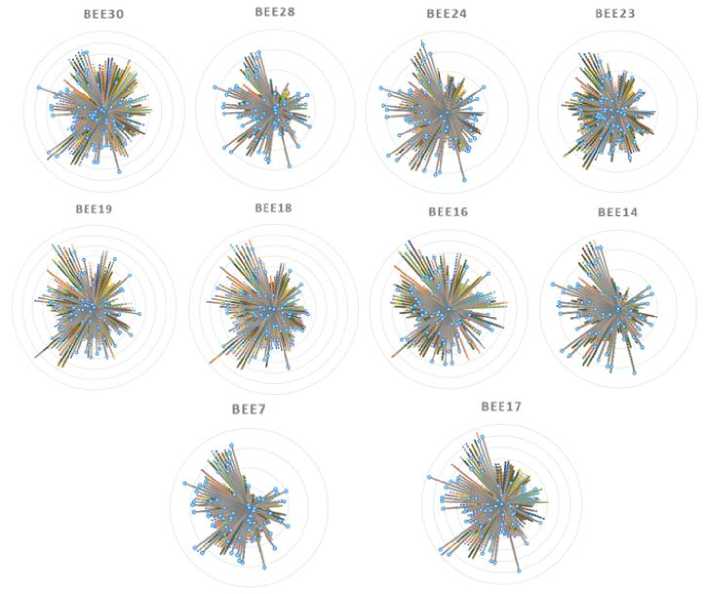
Fig.7. 3D Radar view graph for different target bees
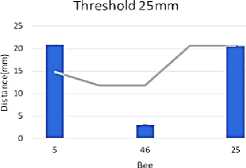
In fig 8 the X axis represents the number of bees, and the Y axis represents distance in millimeters. Here the average distance is plotted as a line over the bar charts to understand how much distance is maintained by individual bees. The error bars are standard deviation for the distance. It is clear by these charts that bees are maintaining a distance between 30mm to 35mm, this threshold values gives us the best result. We found majority of the bees were maintaining a minimum distance under this threshold values. For clear representation of the error bars of these graphs of distance comparison for different threshold according to the target bees, we generated a graph (as shown in fig. 9) of error vs threshold where X axis defines the sequence of graphs from Fig 8 and Y axis defines the threshold values.
We also calculated the speed for every bee that came into the threshold area and generated a bar chart to show the speed of the bees. Graphs in Fig 10 represent the speed comparison of the loitering honeybees for different thresholds according to target bees.
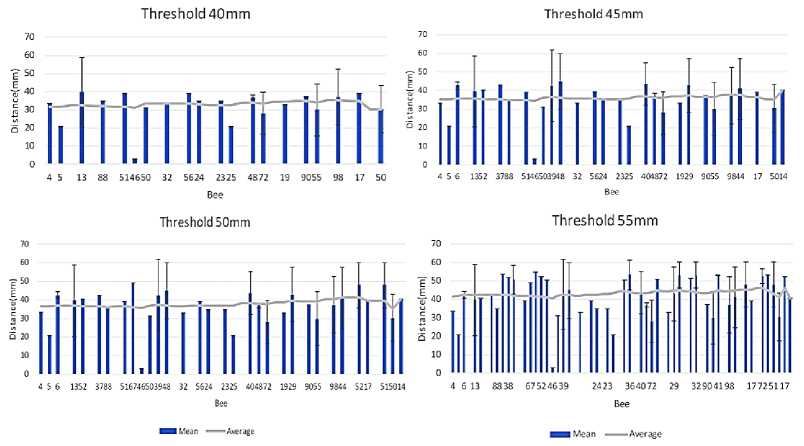
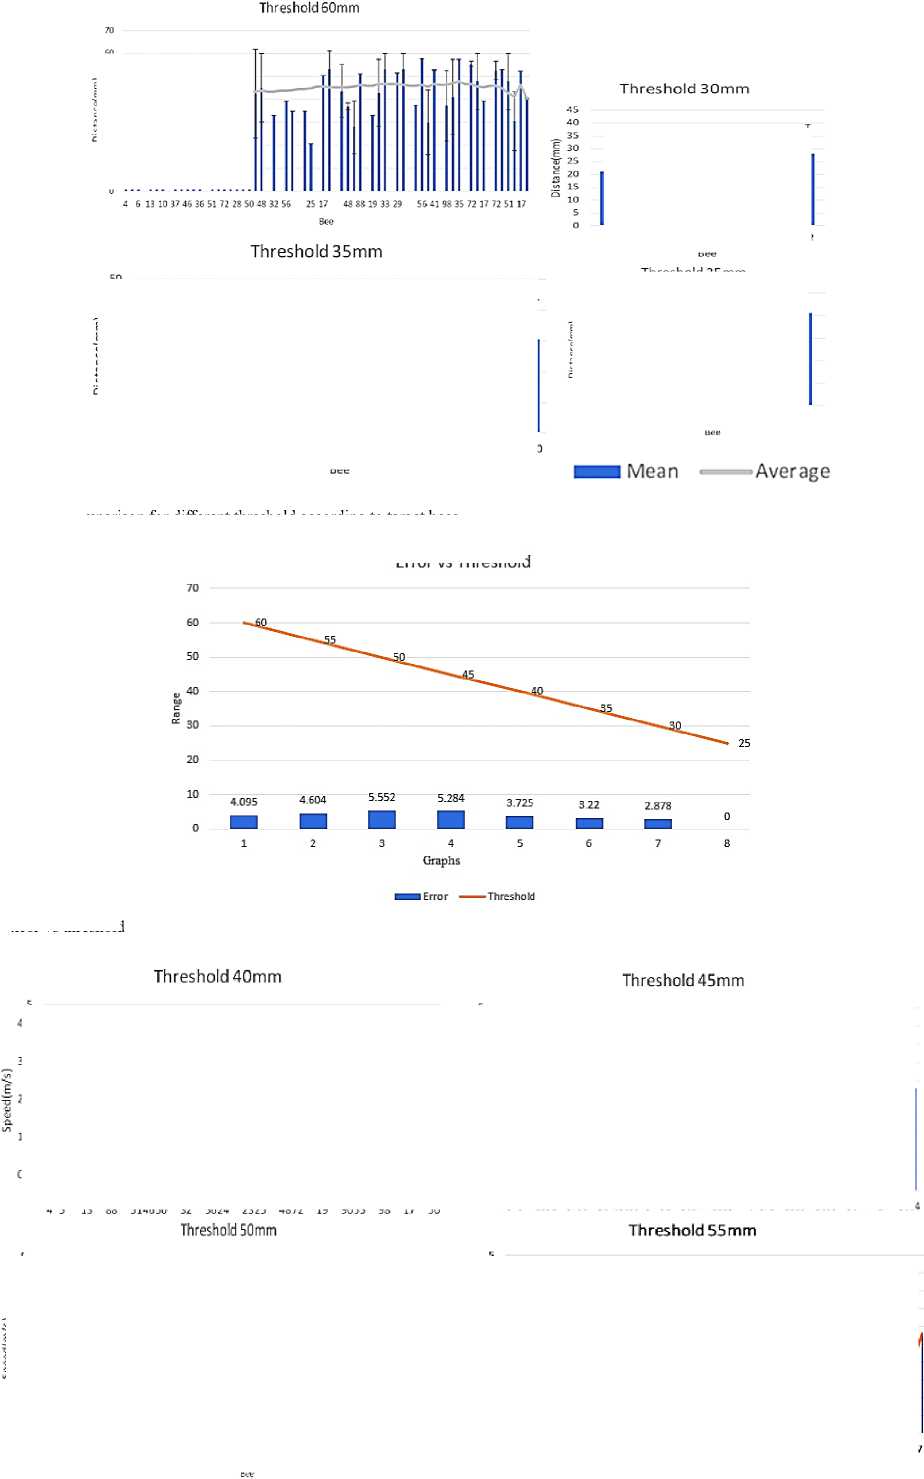
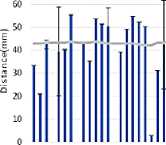
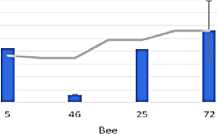
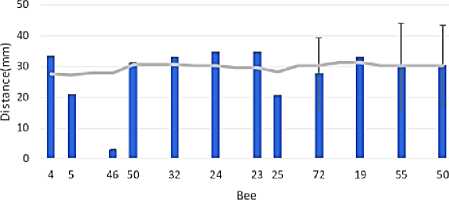
Fig.8. Distance comparison for different threshold according to target bees
Error vs Threshold
Fig.9. Error vs threshold
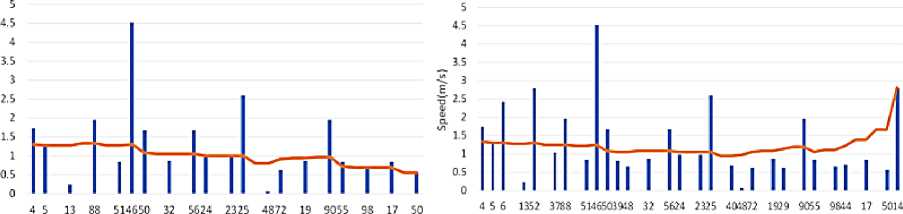
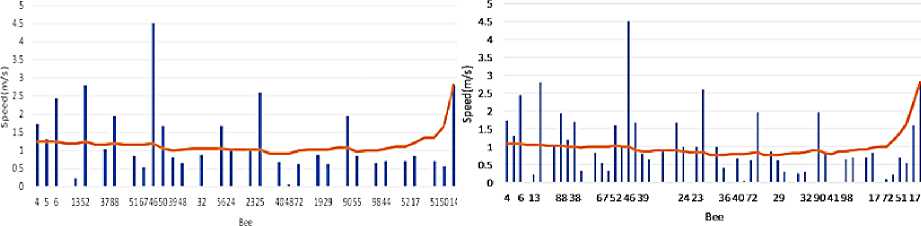
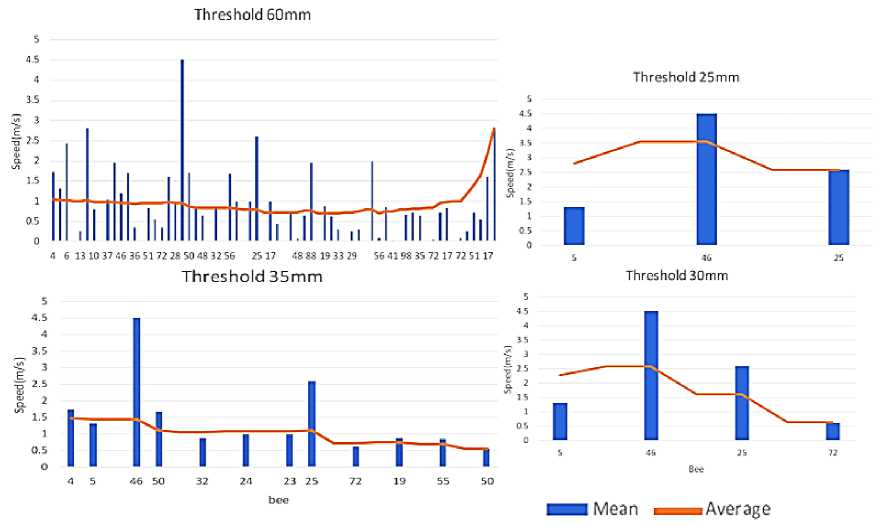
Fig.10. Speed comparison for different threshold according to target bees
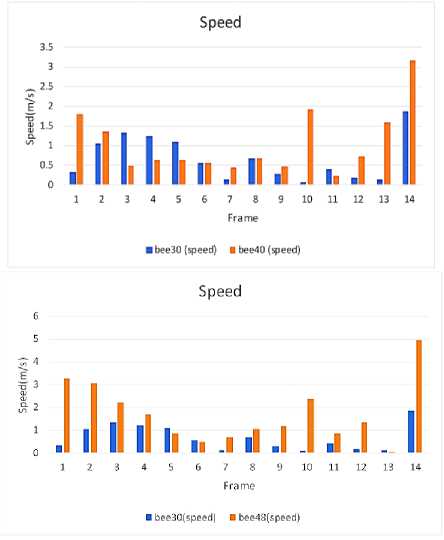
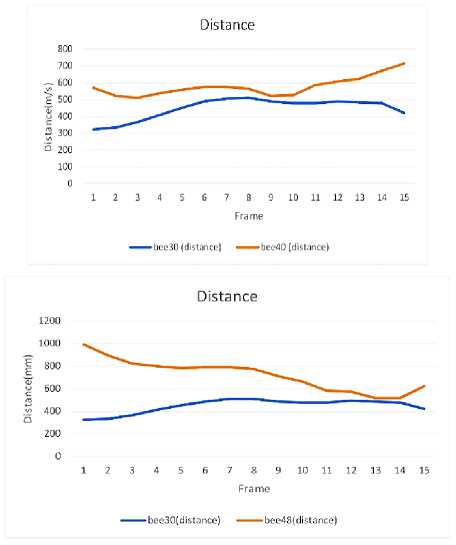
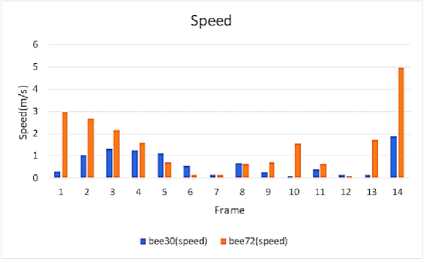
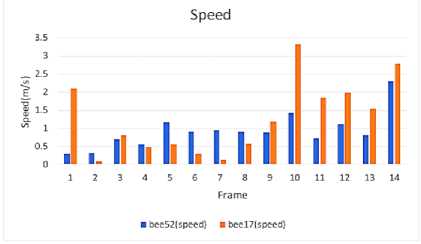
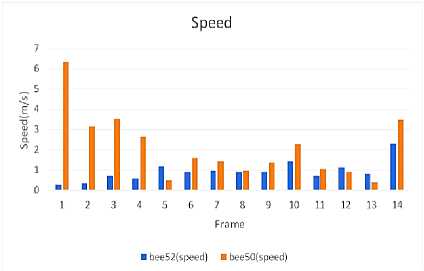
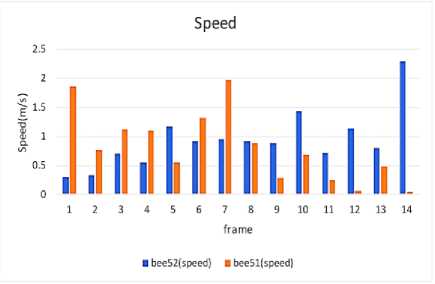
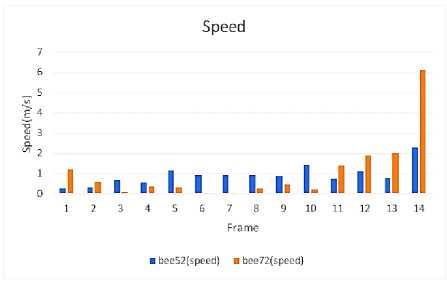
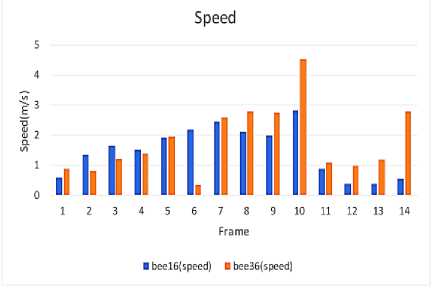
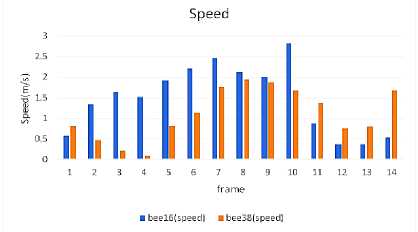
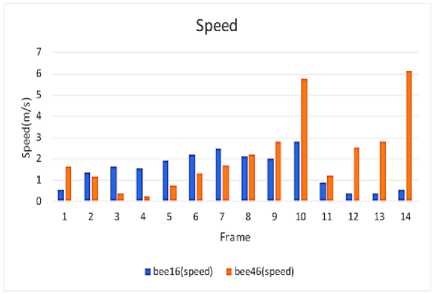
Here in fig 10, X axis represents number of bees, and the y axis represents speed in meter per second. There is no variation in speed, but it gives an interesting result. We considered speed along with distance for two bees respectively. Our target bees and any other bees within the threshold are selected for this experiment. We considered speed along with their distance in our chosen15 frames. We considered speed and distance in every frame and their rate of change for these two bees. The following graphs in Fig 12 to 15 represent the result of this experiment.
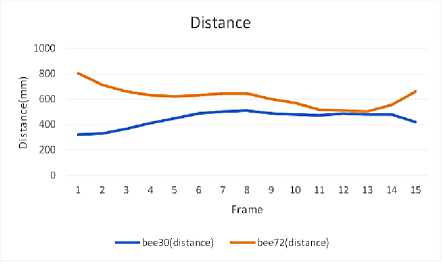
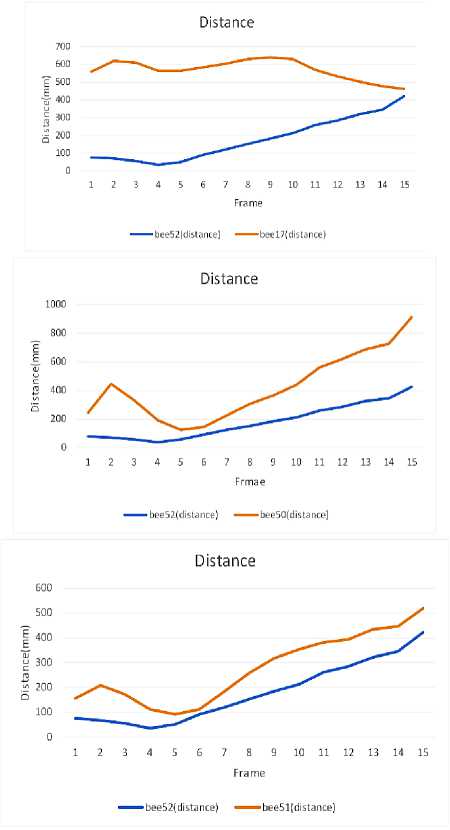
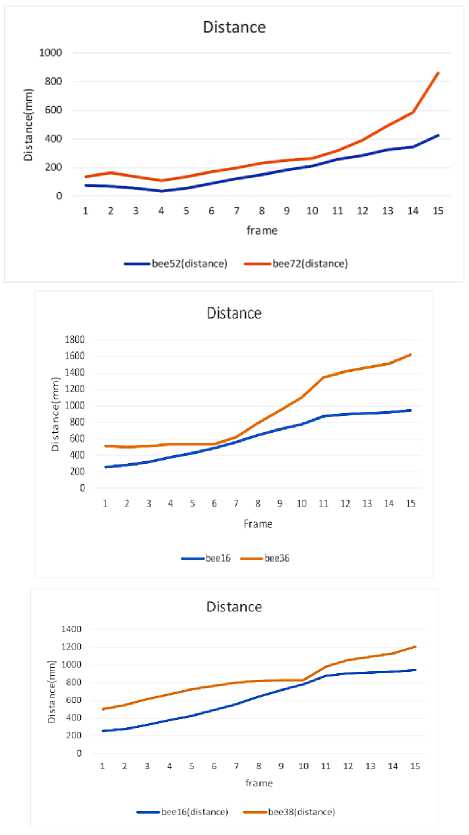
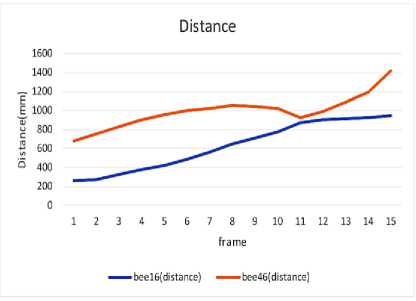
In fig 11 to fig 14 X axis represents speed in meter per second and Y axis represents frame. From these graphs we can clearly see that, when two bees came closer, they reduced their speed dramatically. Most of the time the two bees maintain a slow speed. When the distance increases, the bees also increase their speed. In some frames we can see that one bee reduces speed dramatically, but the other bee did not. But it was not often. Often both bees reduced speed when they came closer. This is for avoiding collision which is the main goal of our project. By analyzing these graphs, we can come to a conclusion that, the bees maintain a minimum distance with each other. We took the measure also, which is explained previously. So, we can state that when two bees came closer, they reduced their speed and maintained a distance to avoid collision.
5. Discussion
For the experimental setup, we selected an open field with a covered area where bees were dancing. A white background proposed for the covered area. For making 3D video we used 2 cameras to generate 3D video. From ground to the target area, it was difficult to do 3D video by keeping the measurement correct for both cameras. The camera position and distance from the ground to camera height was challenging. The focus for each camera was correct to generate 3D video. Bees’ entry into the hive was blocked temporarily so that bees could fly in the target zone. As cameras were set up according to the target zone, the flying position of the bee was recorded for a while. Several videos were taken in time difference. In that meantime the camera position and frame rate were the same. After analyzing the videos, we selected the best video where the number of bees were better in the target area. Bees were flying so some of the bees were out of the frame sometimes and again included after some time. Maximum bees were flying in the target frame.
We selected the same frame from both of the cameras where the bees were in the same position for cameras. By calculating their 3D position, we generated some speed graph, distance graph individually and combined the graph to determine the process more visualize, assumed some threshold radius to show their movement processing, how the interact one another to avoid collision. As the path of the bee was nonlinear so we can avoid the collision by their nature. If we follow the linear position of the bee, it would create a problem for collision avoidance in real life. Because UAV are not moving in a straight direction and if they move in a straight direction the speed and turning speed will be same for UAV which is not a real-life solution.
A definite amount of distance and limit of speed helped the bees to avoid collision. A certain amount of area and distance they maintained. The speed was decreased by their position to a certain time. In maximum time both of the bee’s compromised to reduce their speed and we found that safe distance of bee is 35mm. It could be applied to UAV where the speed will reduce and maintain safe distance in such a certain direction.
6. Conclusions
From exploring the result, it can be said that bee maintains a safe distance to avoid collision and it was 35mm. It was called a threshold value to determine the safe distance. As collision avoidance occurs, another term called speed will be included to calculate the result. It was almost 1 m/s to maintain their speed. After they accelerate and decelerate their speed range, they find a solution to avoid collision. It can be called a game of cooperative. It means two bees reach a point to compromise their decision. A cluster had been made by the algorithm of KNN. A threshold value generated to determine the minimum distance. Our result section shows that real visualization of bee nature and the mechanism for collision avoidance and the graphs represent the actual measurement of our experiment. It can clearly visualize the speed, distance and threshold combination that helps mathematical accuracy. For developing the proposed method in future, we have selected some areas for improvement. The acceleration of bee will help more to reduce collision in future. Magnitude of centrifugal force and center of curvature will help to develop the speed. Micro-controllers can be used for more control in some density areas. The UAV algorithm can be inspired by the study to accelerate the accuracy of traditional approach.
References From Nature to UAV - A Study on Collision Avoidance in Bee Congregation
- S.-C. Chu, H.-C. Huang, J. F. Roddick, and J.-S. Pan, “Overview of Algorithms for Swarm Intelligence,” 2011, pp. 28–41. doi: 10.1007/978-3-642-23935-9_3.
- M. Dorigo and M. Birattari, “Ant Colony Optimization,” in Encyclopedia of Machine Learning, Boston, MA: Springer US, 2011, pp. 36–39. doi: 10.1007/978-0-387-30164-8_22.
- “Artificial Immune Systems,” in Introduction to Evolutionary Algorithms, London: Springer London, 2010, pp. 355–379. doi: 10.1007/978-1-84996-129-5_9.
- P. A. Vikhar, “Evolutionary algorithms: A critical review and its future prospects,” in 2016 International Conference on Global Trends in Signal Processing, Information Computing and Communication (ICGTSPICC), IEEE, Dec. 2016, pp. 261–265. doi: 10.1109/ICGTSPICC.2016.7955308.
- L. Liu, Yuning Song, H. Ma, and X. Zhang, “Physarum optimization: A biology-inspired algorithm for minimal exposure path problem in wireless sensor networks,” in 2012 Proceedings IEEE INFOCOM, IEEE, Mar. 2012, pp. 1296–1304. doi: 10.1109/INFCOM.2012.6195492.
- N. Krasnogor, “Memetic Algorithms,” in Handbook of Natural Computing, Berlin, Heidelberg: Springer Berlin Heidelberg, 2012, pp. 905–935. doi: 10.1007/978-3-540-92910-9_29.
- X.-M. Zeng, M. Ito, and E. Shimizu, “Collision avoidance of moving obstacles for ship with genetic algorithm,” in 6th International Workshop on Advanced Motion Control Proceedings, IEEE, 2000, pp. 513–518. doi: 10.1109/AMC.2000.862927.
- Xiao-ming Zeng, M. Ito, and E. Shimizu, “Building an automatic control system of maneuvering ship in collision situation with genetic algorithms,” in Proceedings of the 2001 American Control Conference. (Cat. No.01CH37148), IEEE, 2001, pp. 2852–2853 vol.4. doi: 10.1109/ACC.2001.946330.
- G. Maimon, A. D. Straw, and M. H. Dickinson, “A Simple Vision-Based Algorithm for Decision Making in Flying Drosophila,” Current Biology, vol. 18, no. 6, pp. 464–470, Mar. 2008, doi: 10.1016/j.cub.2008.02.054.
- F. van Breugel and M. H. Dickinson, “The visual control of landing and obstacle avoidance in the fruit fly Drosophila melanogaster,” Journal of Experimental Biology, vol. 215, no. 11, pp. 1783–1798, Jun. 2012, doi: 10.1242/jeb.066498.
- M. B. Milde, O. J. N. Bertrand, R. Benosmanz, M. Egelhaaf, and E. Chicca, “Bioinspired event-driven collision avoidance algorithm based on optic flow,” in 2015 International Conference on Event-based Control, Communication, and Signal Processing (EBCCSP), IEEE, Jun. 2015, pp. 1–7. doi: 10.1109/EBCCSP.2015.7300673.
- M. Y. Mahadeeswara and M. V. Srinivasan, “Coordinated Turning Behaviour of Loitering Honeybees,” Sci Rep, vol. 8, no. 1, p. 16942, Nov. 2018, doi: 10.1038/s41598-018-35307-5.
- S. Ravi et al., “Bumblebees display characteristics of active vision during robust obstacle avoidance flight,” Journal of Experimental Biology, vol. 225, no. 4, Feb. 2022, doi: 10.1242/jeb.243021.
- P. Goyal, E. Baird, M. V. Srinivasan, and F. T. Muijres, “Visual guidance of honeybees approaching a vertical landing surface,” Journal of Experimental Biology, vol. 226, no. 17, Sep. 2023, doi: 10.1242/jeb.245956.
- H. Duan and P. Li, Bio-inspired Computation in Unmanned Aerial Vehicles. Berlin, Heidelberg: Springer Berlin Heidelberg, 2014. doi: 10.1007/978-3-642-41196-0.
- Q. Yang and S.-J. Yoo, “Optimal UAV Path Planning: Sensing Data Acquisition Over IoT Sensor Networks Using Multi-Objective Bio-Inspired Algorithms,” IEEE Access, vol. 6, pp. 13671–13684, 2018, doi: 10.1109/ACCESS.2018.2812896.
- Y. ZHOU, Y. SU, A. XIE, and L. KONG, “A newly bio-inspired path planning algorithm for autonomous obstacle avoidance of UAV,” Chinese Journal of Aeronautics, vol. 34, no. 9, pp. 199–209, Sep. 2021, doi: 10.1016/J.CJA.2020.12.018.
- S. Na, H. Niu, B. Lennox, and F. Arvin, “Bio-Inspired Collision Avoidance in Swarm Systems via Deep Reinforcement Learning,” IEEE Trans Veh Technol, vol. 71, no. 3, pp. 2511–2526, Mar. 2022, doi: 10.1109/TVT.2022.3145346.
- Q. D. Hossain, M. N. Uddin, and Md. M. Hasan, “Collision avoidance technique using bio-mimic feedback control,” in 2014 International Conference on Informatics, Electronics & Vision (ICIEV), IEEE, May 2014, pp. 1–6. doi: 10.1109/ICIEV.2014.6850784.
- F. Aljalaud, H. Kurdi, and K. Youcef-Toumi, “Bio-Inspired Multi-UAV Path Planning Heuristics: A Review,” Mathematics, vol. 11, no. 10, p. 2356, May 2023, doi: 10.3390/math11102356.
- Wada Kentaro, “Labelme: Image Polygonal Annotation with Python.”
- A. H. Rorres, Elementary linear algebra : applications version. Wiley, 2000.
- M. U. S. MATLAB and Statistics Toolbox Release R2021a. Natick, “MathWorks, Inc.”
