Funding problems of regional housing and utilities sector and the ways to solve them

Author: Barabanov Andrey Sergeyevich
Journal: Economic and Social Changes: Facts, Trends, Forecast @volnc-esc-en
Section: Young researchers
Article in issue: 5 (23) т.5, 2012.
Free access
The need to reform a housing and utilities sector has escalated and become actual in terms of the overwhelming dominance of state ownership and high centralization of management. Unfortunately, the artificial monopolization and significant dependence of this sphere on subsidies have resulted in the distorted behavioral motivation of all the subjects and overall inefficiency of housing and utilities services. The article shows the analysis of current state of housing and utilities sector in the regions of the North-West Federal District; it deals with the problems of its funding and offers the promising directions to improve the regional policy effectiveness in the housing and utilities sector.
Funding of housing and utilities sector, government budgetary policy, housing and utilities sector investment
Short address: https://sciup.org/147223387
IDR: 147223387 | UDC: 332.8
Text of the scientific article Funding problems of regional housing and utilities sector and the ways to solve them
The development of housing and utilities sector, which has a lot of unresolved acute problems requiring immediate solving, is a very important branch of social policy in today’s Russia. This sphere affects the interests of a large number of social subjects: population, all the levels of government authority, industrial enterprises, business and nonprofit organizations.
Diverse functions of this sector in the process of social reproduction come to two basic points:
1) in economic terms, housing and utilities services are a powerful factor in the reproduction of the main force of society – labour force, as
well as in making the gross national product and national income, ensuring economic growth, increasing economic efficiency;
2) in social terms, housing and utilities services are an effective factor in the stabilization of social standard of living in the period of making market economy, future growth in standard and quality of living, the most complete implementation of social equity principle.
Under these circumstances, the state of today’s housing and utilities sector can be described as critical. Prolonged systemic crisis leads to an increase in the depreciation of fixed assets in the industry and, as a result, to an
Table 1. Housing stock (total housing floor space; thsd. sq. m)
|
Territory |
2000 |
2006 |
2007 |
2008 |
2009 |
2010 |
2010 to 2000, % |
|
Kaliningrad Oblast |
17573 |
18768 |
19126 |
19880 |
20793 |
21609 |
123.0 |
|
Leningrad Oblast |
36778 |
39256 |
40210 |
41228 |
42239 |
43334 |
117.8 |
|
St. Petersburg |
93471 |
100326 |
102547 |
105583 |
107882 |
109937 |
117.6 |
|
Vologda Oblast |
28002 |
29425 |
29585 |
30107 |
30461 |
30969 |
110.6 |
|
Novgorod Oblast |
15840 |
16408 |
16549 |
16732 |
16998 |
17249 |
108.9 |
|
Republic of Karelia |
15226 |
15621 |
15729 |
16111 |
16259 |
16354 |
107.4 |
|
Arkhangelsk Oblast |
29406 |
30068 |
30137 |
30326 |
30609 |
30778 |
104.7 |
|
Pskov Oblast |
18124 |
18471 |
18569 |
18604 |
18964 |
18963 |
104.6 |
|
Republic of Komi |
22126 |
22260 |
22348 |
22429 |
22383 |
22192 |
100.3 |
|
Murmansk Oblast |
19710 |
19465 |
19448 |
19391 |
19357 |
19374 |
98.3 |
|
North-West FD, mln. sq. m |
296 |
310 |
314 |
320 |
325 |
330 |
111.6 |
|
Russia, mln. sq. m |
2787 |
2955 |
3003 |
3060 |
3116 |
3177 |
114.0 |
|
Source: Housing and utilities sector and household services. 2010: Stat. Coll. Rosstat. Moscow, 2010. |
|||||||
Table 2. The distribution of the total housing floor space according to the years of building (in % to the total housing floor space)
|
Territory |
Years of building |
||||
|
Before 1920 |
1921-1945 |
1946-1970 |
1971-1995 |
After 1995 |
|
|
Republic of Karelia |
2.1 |
6.0 |
34.9 |
48.3 |
8.7 |
|
Pskov Oblast |
1.6 |
4.5 |
32.9 |
49.4 |
11.6 |
|
Novgorod Oblast |
4.1 |
7.4 |
32.1 |
45.3 |
11.1 |
|
Murmansk Oblast |
0.1 |
2.3 |
31.9 |
64.4 |
1.5 |
|
Arkhangelsk Oblast |
4.5 |
9.8 |
30.9 |
47.8 |
6.9 |
|
Vologda Oblast |
4.4 |
7.0 |
30.3 |
43.7 |
14.6 |
|
Leningrad Oblast |
2.6 |
5.7 |
26.9 |
45.3 |
19.5 |
|
St. Petersburg |
13.9 |
2.0 |
26.6 |
38.5 |
19.0 |
|
Republic of Komi |
1.3 |
3.3 |
25.8 |
60.2 |
9.3 |
|
Kaliningrad Oblast |
0.2 |
27.2 |
14.6 |
37.3 |
20.7 |
|
North-West FD |
6.3 |
6.1 |
27.9 |
45.1 |
14.6 |
|
Russia |
2.6 |
4.8 |
30.9 |
43.7 |
18.0 |
Source: Housing and utilities sector and household services. 2010: Stat. Coll. Rosstat. Moscow, 2010.
Table 3. Distribution of apartment houses according to a depreciation rate in 2010 (in % to the total housing floor space)
|
Territory |
Depreciation rate |
|||
|
From 0 to 30 |
From 31 to 65 |
From 66 to 70 |
Over 70 |
|
|
Kaliningrad Oblast |
28.2 |
58.3 |
10.6 |
2.9 |
|
Leningrad Oblast |
34.7 |
57.6 |
6.3 |
1.4 |
|
Vologda Oblast |
27.9 |
56.2 |
11.7 |
4.2 |
|
Pskov Oblast |
43.3 |
53.1 |
3.0 |
0.6 |
|
Arkhangelsk Oblast |
31.6 |
51.0 |
13.7 |
3.7 |
|
Novgorod Oblast |
39.0 |
46.2 |
9.3 |
5.6 |
|
Republic of Karelia |
44.6 |
45.0 |
9.6 |
0.8 |
|
St. Petersburg |
52.8 |
44.7 |
1.9 |
0.7 |
|
Republic of Komi |
37.3 |
40.4 |
16.8 |
5.5 |
|
Murmansk Oblast |
49.9 |
39.7 |
9.9 |
0.5 |
|
North-West FD |
36.7 |
51.2 |
9.5 |
2.7 |
|
Russia |
39.5 |
51.7 |
6.4 |
2.3 |
Source: Housing and utilities sector and household services. 2010: Stat. Coll. Rosstat. Moscow, 2010.
Table 4. Old and failing housing stock (in % to the total housing floor space)
|
Territory |
2000 |
2006 |
2007 |
2008 |
2009 |
2010 |
Change in 2000 – 2010, p.p. |
|
Republic of Komi |
6.3 |
7.8 |
9.4 |
8.7 |
8.7 |
9.0 |
2.7 |
|
Arkhangelsk Oblast |
3.5 |
7.8 |
8,2 |
8.3 |
8.3 |
7.9 |
4.4 |
|
Vologda Oblast |
2.1 |
5.5 |
6.0 |
5.6 |
5.6 |
6.0 |
3.9 |
|
Republic of Karelia |
3.9 |
2.8 |
3.6 |
3.7 |
3.7 |
3.6 |
-0.3 |
|
Novgorod Oblast |
1.5 |
4.4 |
4.7 |
4.5 |
4.5 |
3.6 |
2.1 |
|
Leningrad Oblast |
0.8 |
2.7 |
3.0 |
3.1 |
3.1 |
3.0 |
2.2 |
|
Kaliningrad Oblast |
2.4 |
3.6 |
2.0 |
2.4 |
2.4 |
2.3 |
-0.1 |
|
Murmansk Oblast |
1.7 |
1.7 |
2.1 |
2.1 |
2.1 |
2.3 |
0.6 |
|
Pskov Oblast |
1.6 |
3.2 |
3.1 |
1.2 |
12 |
1.2 |
-0.4 |
|
St. Petersburg |
0.5 |
0.6 |
0.6 |
0.6 |
0.6 |
0.7 |
0.2 |
|
North-West FD |
2.0 |
3.3 |
3.4 |
3.3 |
3.3 |
32 |
1.2 |
|
Russia |
2.4 |
3.2 |
3.2 |
3.2 |
3.2 |
3.1 |
0.7 |
|
Source: Housing and utilities sector and household services. 2010: Stat. Coll. Rosstat. Moscow, 2010. |
|||||||
Table 5. Total costs for the capital repair of apartment houses, mln. rub.
|
Territory |
2009 |
2010 |
2010 to 2009, % |
|
Pskov Oblast |
235.5 |
801.6 |
340.4 |
|
Kaliningrad Oblast |
290.7 |
771.7 |
265.5 |
|
Arkhangelsk Oblast |
534.8 |
1245.6 |
232.9 |
|
Novgorod Oblast |
296.4 |
648.9 |
218.9 |
|
Republic of Karelia |
119.3 |
240.6 |
201.7 |
|
Murmansk Oblast |
726.5 |
1136 |
156.4 |
|
Republic of Komi |
387.9 |
528.5 |
136.2 |
|
Vologda Oblast |
890.6 |
987.2 |
110.8 |
|
Leningrad Oblast |
1379.3 |
1305.5 |
94.6 |
|
St. Petersburg |
15804.4 |
6619.3 |
41.9 |
|
North-West FD |
20665.4 |
14284.9 |
69.1 |
|
Russia |
120572.3 |
137469.5 |
114.0 |
|
Source: Housing and utilities sector and household services. 2010: Stat. Coll. Rosstat. Moscow, 2010. |
|||
Table 6. Total floor area of rebuilt apartment houses, thsd. sq. m
|
Territory |
2009 |
2010 |
2010 to 2009, % |
|
Novgorod Oblast |
14.0 |
71.4 |
510.0 |
|
St. Petersburg |
284.6 |
460.8 |
161.9 |
|
Arkhangelsk Oblast |
47.1 |
69.4 |
147.3 |
|
Pskov Oblast |
55.1 |
79.0 |
143.4 |
|
Leningrad Oblast |
230.7 |
301.3 |
130.6 |
|
Republic of Komi |
96.4 |
121.1 |
125.6 |
|
Vologda Oblast |
1024.2 |
594.2 |
58.0 |
|
Murmansk Oblast |
1350.7 |
753.2 |
55.8 |
|
Kaliningrad Oblast |
962.5 |
250.3 |
26.0 |
|
Republic of Karelia |
15.4 |
3.2 |
20.2 |
|
North-West FD |
4080.7 |
2703.9 |
66.3 |
|
Russia |
44276.3 |
41138.5 |
92.9 |
|
Source: Housing and utilities sector and household services. 2010: Stat. Coll. Rosstat. Moscow, 2010. |
|||
Table 7. Total cost per 1 square meter of apartment houses rebuilding, rub.
The extremely low economical efficiency of housing and utilities services in most regions of the Russian Federation, which causes low productivity, poor management and extremely high resource consumption, has a direct impact on the quality and cost of services. The funds received from customers as their payment for services often do not cover the cost of housing and communal companies.
With an extremely high depreciation degree of pipes and water and wastewater treatment facilities, only a few companies are able to operate at a profit, which, however, does not exceed 5%. But according to experts, the profit can account for 30% with an adequate tariff policy [10].
The tension in this sector is proved by statistics, which indicate that there are persistent negative trends that are common for all the Russian regions in the dynamics of most indicators [3].
Consider the state of housing and communal services in the regions of the North-West Federal District for the period from 2000 to 2010. Housing stock is a basis of the housing and utilities sector.
It amounted to 330.0 mln. sq. m at the end of 2010 due to the increase by 12% over eleven years that was slightly below a nationwide rate (14%). There was the fastest housing stock increase in the Kaliningrad Oblast (growth rates were 23% in 2000 – 2010), the Leningrad Oblast and St. Petersburg (17%). There were no changes in the housing floor space in the Republic of Komi during the period under our study, and it reduced by 2% in the Murmansk Oblast (tab. 1) .
Most houses in the country were built in the period of mass building. In the regions of the North-West Federal District almost 28% of apartment houses were built in 1946 – 1970 and about 45% of houses were built in 1971 – 1995 (these figures are slightly different from the nationwide indicators – 31% and 44%, respectively). St. Petersburg stood out against a background of the situation, where 14% of houses were built before 1920 (tab. 2) .
Housing stock in the regions of the NorthWest Federal District is characterized by high depreciation. In 2010, the depreciation rate of more than half apartment houses varied from 31% to 65%. There were the similar nationwide statistics in Russia (52%; tab. 3 ).
The share of old and failing housing stock in the total housing stock in the regions of the North-West Federal District amounted to 3% at the end of 2010.
There was a similar trend in Russia. The smallest share of old and failing housing was in St. Petersburg – less than 1% in the total housing floor space. There were the highest rates in the Vologda Oblast, the Arkhangelsk Oblast and the Republic of Komi – 6%, 8% and 9%, respectively (tab. 4) .
Deteriorating housing stock requires significant expenditures on new housing construction and capital repairing. Total costs for capital repairing in the regions of the North-West Federal District were high, except for St. Petersburg and the Leningrad Oblast.
There was the same nationwide trend in Russia: capital repairing cost amounted to 137 billion rubles in 2010 that was 14% more than in 2009 (tab. 5) .
However, the total floor area of rebuilt housing reduced. For example, there was a decrease of this rate by 74% and 80% in the Kaliningrad Oblast and the Republic of Karelia, respectively (tab. 6) .
As for the total cost per 1 square meter of apartment houses rebuilding, they increased in most regions of the North-West Federal District.
It is necessary to note the Kaliningrad Oblast, the Republic of Karelia, the Murmansk, Pskov and Vologda Oblasts, where the total cost per 1 square meter of apartment houses rebuilding increased 2.0 – 10.2-fold in 2010 as compared with 2009. On the contrary, there was a cost reduction in the Leningrad Oblast, the Novgorod Oblast and St. Petersburg (tab. 7) .
Communal infrastructure is also characterized by a high degree of depreciation and technological backwardness. The depreciation rate of gas supply facilities accounted for 59%, heat facilities – 50%, water supply facilities – 60% and sewerage facilities – 49% in the regions of the North-West Federal District at the end of 2010 (vs. 48%, 48%, 54% and 12% in Russia, respectively). There were the most depreciated fixed assets on the Murmansk Oblast (tab. 8) .
The depreciation of communal infrastructure affected mainly the amount of lost resources. Heat losses in the operation of existing heating systems exceeded the established standards by 4 – 7%1, and there was a total trend to worsen the situation in the period from 2000 to 2010. Thus, average heat losses in the regions of the North-West Federal District were equal to 8.3% at the end of 2010, i.e. 1.5 percentage points more than in 2000.
There were the greatest heat losses in the Novgorod Oblast (13.2%), the Pskov Oblast (12.4%) and the Vologda Oblast (10.1%) (tab. 9) .
However, heat supply systems are repaired insufficiently. Only 3.4% of the total length of heating networks was replaced in the regions of the North-West Federal District in 2010. These figures were higher a little bit than a nationwide rate (2.6%; tab. 10 ). It is noteworthy that only old heating systems that served their time long ago are replaced, while wrecking systems are still considered as repairable.
There are similar trends in the communal services. High depreciation of organizations’ fixed assets and small amounts of utilities reconstruction cause the great losses of resources. Deteriorating public utilities require significant investments in this sphere.
Analysis of the process and expected results of housing reform, which has been undertaken since the early 1990s, shows that the government continues to develop market relations in this sphere and reduces the state support for this sector.
The expenses of consolidated regional budgets for housing and utilities sector have increased 10-fold over the period from 1998 to 2011, but their share in the total expenditures has decreased from 23 to 12.0% and in GDP – from 3.5 to 2.2% (fig. 1) .
Table 8. Depreciation rate of organizations’ fixed assets according to the types of economic activity related to the communal complex, in 2010,%
|
Territory |
Types of economic activity |
|||
|
Production and distribution of fuel gas |
Production, transmission and distribution of heat energy |
Collection, purification and distribution of water |
Sewage and wastes disposal and similar activities |
|
|
Republic of Karelia |
66.5 |
27.5 |
14.6 |
57.1 |
|
Republic of Komi |
39.7 |
27.3 |
37.6 |
52.8 |
|
Arkhangelsk Oblast |
59.8 |
50.5 |
56.3 |
51.2 |
|
Vologda Oblast |
36.8 |
55.0 |
56.0 |
49.6 |
|
Kaliningrad Oblast |
47.7 |
34.4 |
56.2 |
59.1 |
|
Leningrad Oblast |
84.8 |
40.7 |
31.8 |
35.9 |
|
Murmansk Oblast |
73.2 |
77.7 |
61.9 |
51.1 |
|
Novgorod Oblast |
49.2 |
47.7 |
40.8 |
51.2 |
|
Pskov Oblast |
45.6 |
53.2 |
52.0 |
38.4 |
|
St. Petersburg |
15.9 |
44.5 |
59.8 |
53.3 |
|
North-West FD |
58.8 |
49.8 |
59.0 |
49.3 |
|
Russia |
47.5 |
48.1 |
53.8 |
11.6 |
Source: Housing and utilities sector and household services. 2010: Stat. Coll. Rosstat. Moscow, 2010.
Table 9. Heat losses in the heat supply systems (in% of heat supply)
|
Territory |
2000 |
2006 |
2007 |
2008 |
2009 |
2010 |
Change 2000 – 2010, p.p. |
|
Novgorod Oblast |
12.3 |
12.6 |
13.7 |
13.5 |
13.6 |
13.2 |
0.9 |
|
Pskov Oblast |
7.7 |
9.8 |
10.9 |
11.1 |
12.8 |
12.4 |
4.7 |
|
Vologda Oblast |
4.6 |
9.1 |
8.5 |
10.6 |
9.3 |
10.1 |
5.5 |
|
Arkhangelsk Oblast |
6.7 |
8.1 |
9.0 |
9.3 |
9.4 |
9.6 |
2.9 |
|
Murmansk Oblast |
8.8 |
8.5 |
10.2 |
9.5 |
8.9 |
9.5 |
0.7 |
|
Kaliningrad Oblast |
5.0 |
11.2 |
12.3 |
9.9 |
9.0 |
8.8 |
3.8 |
|
Leningrad Oblast |
9.1 |
8.4 |
7.9 |
8.0 |
8.3 |
7.9 |
-1.2 |
|
Republic of Karelia |
4.7 |
4.9 |
6.5 |
6.2 |
6.6 |
7.3 |
2.6 |
|
St. Petersburg |
5.5 |
7.3 |
7.0 |
7.1 |
7.5 |
7.3 |
1.8 |
|
Republic of Komi |
8.4 |
7.1 |
8.0 |
7.7 |
7.6 |
7.1 |
-1.3 |
|
North-West FD |
6.8 |
7.9 |
8.3 |
8.3 |
8.4 |
8.3 |
1.5 |
|
Russia |
7.2 |
9.1 |
9.3 |
9.2 |
9.6 |
10.1 |
2.9 |
|
Source: Housing and utilities sector and household services. 2010: Stat. Coll. Rosstat. Moscow, 2010. |
|||||||
Table 10. Replaced two-pipe heat and steam systems in 2010
|
Territory |
Replaced two-pipe heat and steam systems, total, km |
Including old systems |
The share of replaced two-pipe heat and steam systems in the total heat and steam systems spread, % |
|
Leningrad Oblast |
156.3 |
133.9 |
5.6 |
|
St. Petersburg |
184.1 |
100.0 |
4.5 |
|
Novgorod Oblast |
27.9 |
27.6 |
3.2 |
|
Kaliningrad Oblast |
22.8 |
17.0 |
2.7 |
|
Arkhangelsk Oblast |
54.1 |
38.3 |
2.6 |
|
Pskov Oblast |
22.5 |
16.3 |
2.4 |
|
Republic of Komi |
43.0 |
27.6 |
2.1 |
|
Vologda Oblast |
40.3 |
36.5 |
2.1 |
|
Republic of Karelia |
18.4 |
16.9 |
2.0 |
|
Murmansk Oblast |
21.3 |
19.7 |
1.9 |
|
North-West FD |
590.7 |
433.8 |
3.4 |
|
Russia |
4527.7 |
3630.8 |
2.6 |
|
Source: Housing and utilities sector and household services. 2010: Stat. Coll. Rosstat. Moscow, 2010. |
|||
Figure 1. The share of housing and utilities expenses in the consolidated budgets of the RF subjects, mln. rub.
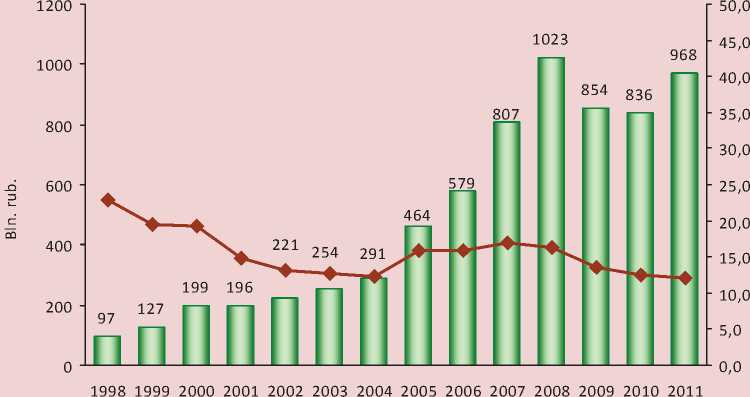
I-----1 Expenses for housing and utilities services, bln. rub. (left sca le)
--0=The share of expenses for housing and utilities services in the tota l expenditures, % (right scale)
There were traditional maximum investment in the housing and utilities sector in the Chukotka Autonomous Okrug (76.4 thousand rubles. per person annually), Nenets Autonomous Okrug (66.9) and Yamalo-Nenets Autonomous Okrug (31.4), as well as in the metropolitan centres – Moscow (33.9) and St. Petersburg (22.3 thousand rubles per person annually).
The peak of absolute investment in the industry was in financially successful 2008, when the maximum income allowed to invest over 1 trillion rubles from the consolidated budgets of the RF subjects or 16.4% of the total consolidated assets to the housing and utilities sector.
As for the regions of the North-West Federal District, there are the similar nationwide trends here (fig. 2) .
There are significant swings in financing of the industry at the regional level. For example, despite the increase in housing and utilities expenses in the Vologda Oblast, their share in the total expenditures of the regional consolidated budget has been reduces annually since 2000 (fig. 3).
Comparing the housing and utilities expenses in the regions of the North-West Federal District in 2011 shows that there were the highest expenses per capita in St. Petersburg (14,575 rubles), the Murmansk Oblast (10,658 rubles) and the Kaliningrad Oblast (7,362 rubles). The expenses varied from 4 to 6 thousand rubles in other regions (tab. 11) .
However, there is information about exorbitant housing and utilities expenses of regional and local budgets in the scientific literature and official documents and about the need to shift them onto the consumers.
It is possible to use a coefficient of patronizing2 (Cpatron) the housing and utilities sector by the consolidated budget system and a coefficient of recompensing3 (Crecomp) service cost by population [4].
Figure 2. Housing and utilities expenses in the consolidated budgets of the regions of the North-West Federal District, mln. rub.
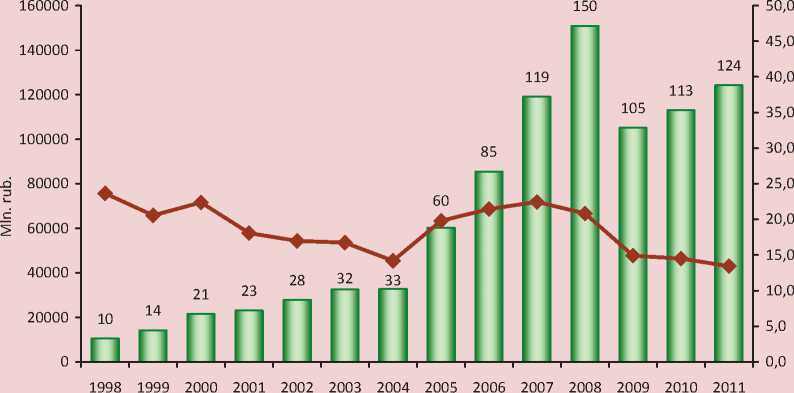
I—I Subjects’ expenses for housing and utilities services, mln. rub. (left scale)
—0=The share of expenses for housing and utilities services in the total expenditures, % (right scale)
Figure 3. Housing and utilities expenses in the consolidated budgets of the Vologda Oblast, mln. rub.
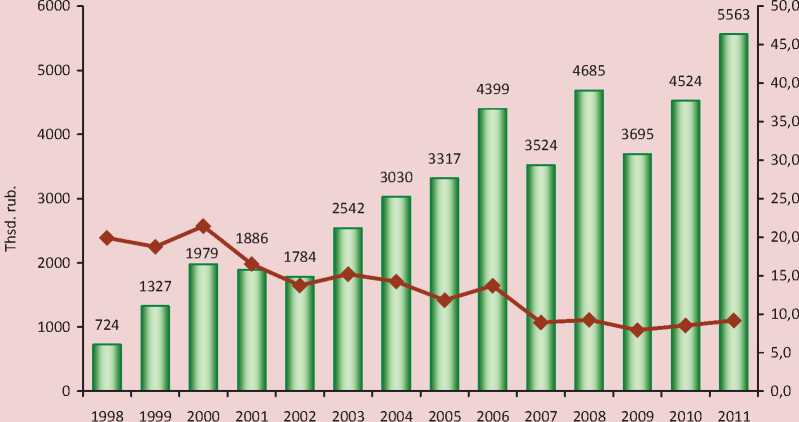
Table 11. Housing and utilities expenses per capita in the regions of the North-West Federal District, rub.
|
Territory |
ОО CD CD |
g |
g |
о |
g |
о |
CD S |
g |
О ^ ■^ oo S 2 |
|
|
St. Petersburg |
719.2 |
1620.5 |
7992.0 |
11989.8 |
18451.5 |
22339.2 |
12826.8 |
13180.6 |
14575.0 |
20.3 |
|
Murmansk Oblast |
1516.3 |
2282.7 |
2503.9 |
6607.5 |
6318.8 |
7873.2 |
7268.3 |
8095.3 |
10658.1 |
7.0 |
|
Kaliningrad Oblast |
442.9 |
1329.4 |
3444.4 |
4560.9 |
5188.6 |
6206.2 |
6480.5 |
7112.6 |
7362.2 |
16.6 |
|
Arkhangelsk Oblast |
411.2 |
953.9 |
1635.7 |
2686.4 |
3963.0 |
6530.9 |
4991.2 |
5671.0 |
6807.7 |
16.6 |
|
Republic of Komi |
1202.8 |
1851.8 |
2832.8 |
2891.6 |
2810.1 |
5220.1 |
3885.8 |
4712.0 |
5421.0 |
4.5 |
|
Leningrad Oblast |
706.4 |
1324.3 |
2766.0 |
2744.6 |
3763.7 |
5361.5 |
5882.0 |
5516.6 |
4797.6 |
6.8 |
|
Vologda Oblast |
550.3 |
1523.6 |
2664.4 |
3562.4 |
2872.2 |
3834.1 |
3044.3 |
3760.7 |
4624.5 |
8.4 |
|
Novgorod Oblast |
775.0 |
1286.6 |
2726.3 |
3145.4 |
3389.6 |
5794.2 |
5520.9 |
5217.2 |
4466.0 |
5.8 |
|
Pskov Oblast |
317.5 |
1061.9 |
1555.2 |
1136.2 |
1803.2 |
2314.3 |
3810.0 |
2741.2 |
3944.0 |
12.4 |
|
Republic of Karelia |
577.8 |
1114.6 |
1459.2 |
1518.5 |
1918.2 |
2329.4 |
2622.8 |
3926.2 |
3912.3 |
6.8 |
|
Source: Housing and utilities sector and household services. 2010: Stat. Coll. Rosstat. Moscow, 2010. |
||||||||||
As a result of targeted federal policies, funding of the sector was characterized by the decline of budget expenditures for supporting the complex in the period from 1997 to 1999.
At the same time, the Government of the Russian Federation delayed the increase in the tariffs for the population. In 2000 – 2004, after thawing of housing and utilities tariffs, the main burden of housing and utilities costs was shifted onto the population; people had not had time to react quickly to subsidy programmes and took the brunt of the “crouch start” on themselves4. In 2005 – 2008, the coefficient of recompensing increased from 0.35 to 0.48 due to the gradual involvement of the budget system in the direct support of the housing and utilities sector (mainly in the form of direct targeted subsidies to the populations and partial participation in the capital expenditures on housing repair and commissioning of utilities). There was the highest growth of the coefficient in Moscow and St. Petersburg.
There was a sharp decline in the coefficient of patronizing down to the level of 2005 (0.35; tab. 12 ) in all the regions of the North-West
Federal District and in the whole country in 2009 after the maximum budget allocations to the housing and utilities sector in 2008.
In fact, it was the result of a belated response to the financial crisis broken out in 2008. If almost all the subsidy refund budget commitments were met and capital funds were drawn in the housing and utilities sector during the crisis, then most of them were not even planned in 2009. At the same time, there was a significant increase in housing and utilities tariffs, which were covered by the payments of households.
There were more significant changes in the coefficient of recompensing as compared with the coefficient of budget patronizing: there was about 3-fold gap between the maximum coefficient (St. Petersburg – 1.26) and minimum coefficient (Arkhangelsk Oblast – 0.43), which identified the deeper spatial differences in forming households’ incomes in comparison with territories’ fiscal capacity (tab. 13) .
In addition, the comparison of two coefficients showed that the budget expenditures per one reference housing unit were 2 – 2.5 times lower than population expenses. It is evidence of a significant increase in housing and communal tariffs that are covered mainly by the payments of households (fig. 4) .
Table 12. Coefficient of budget patronizing the housing and utilities sector in the regions of the North-West Federal District *
|
Territory |
2005 |
2006 |
2007 |
2008 |
2009 |
2010 |
Changes in 2005 – 2010 |
|
St. Petersburg |
1.04 |
1.28 |
1.69 |
1.81 |
0.95 |
0.90 |
-0.14 |
|
Kaliningrad Oblast |
0.42 |
0.43 |
0.41 |
0.43 |
0.40 |
0.38 |
-0.04 |
|
Murmansk Oblast |
0.17 |
0.42 |
0.35 |
0.40 |
0.33 |
0.32 |
0.15 |
|
Vologda Oblast |
0.35 |
0.46 |
0.32 |
0.38 |
0.27 |
0.30 |
-0.05 |
|
Leningrad Oblast |
0.30 |
0.23 |
0.27 |
0.34 |
0.33 |
0.29 |
-0.01 |
|
Novgorod Oblast |
0.30 |
0.23 |
0.21 |
0.32 |
0.28 |
0.23 |
-0.07 |
|
Republic of Komi |
0.23 |
0.22 |
0.19 |
0.32 |
0.22 |
0.22 |
-0.01 |
|
Arkhangelsk Oblast |
0.17 |
0.17 |
0.22 |
0.32 |
0.22 |
0.22 |
0.05 |
|
Republic of Karelia |
0.17 |
0.13 |
0.14 |
0.16 |
0.16 |
0.20 |
0.03 |
|
Pskov Oblast |
0.17 |
0.09 |
0.12 |
0.14 |
0.21 |
0.15 |
-0.02 |
|
Russian Federation |
0.35 |
0.35 |
0.42 |
0.48 |
0.35 |
0.30 |
-0.05 |
|
*Author’s calculations. |
Table 13. Coefficient of recompensing the housing service cost by population*
|
Territory |
2005 |
2006 |
2007 |
2008 |
2009 |
2010 |
Changes in 2005 – 2010 |
|
St. Petersburg |
1.03 |
1.17 |
0.96 |
1.21 |
1.28 |
1.26 |
0.23 |
|
Leningrad Oblast |
0.52 |
0.44 |
0.48 |
0.44 |
0.69 |
0.98 |
0.46 |
|
Republic of Komi |
0.70 |
0.82 |
0.82 |
0.81 |
0.99 |
0.95 |
0.25 |
|
Vologda Oblast |
0.46 |
0.62 |
0.69 |
0.70 |
0.80 |
0.95 |
0.49 |
|
Murmansk Oblast |
0.64 |
0.73 |
0.77 |
0.76 |
0.79 |
0.84 |
0.20 |
|
Republic of Karelia |
0.53 |
0.47 |
0.54 |
0.50 |
0.56 |
0.68 |
0.15 |
|
Kaliningrad Oblast |
0.41 |
0.45 |
0.46 |
0.59 |
0.60 |
0.61 |
0.20 |
|
Novgorod Oblast |
0.37 |
0.34 |
0.43 |
0.52 |
0.59 |
0.60 |
0.23 |
|
Pskov Oblast |
0.42 |
0.39 |
0.37 |
0.44 |
0.44 |
0.56 |
0.14 |
|
Arkhangelsk Oblast |
0.50 |
0.38 |
0.39 |
0.42 |
0.40 |
0.43 |
-0.07 |
|
Russian Federation |
0.61 |
0.64 |
0.64 |
0.68 |
0.71 |
0.74 |
0.13 |
|
* Author’s calculations. |
Figure 4. The ratio of the coefficient of budget patronizing the housing and utilities sector to the coefficient of recompensing the housing service cost by population in 2010
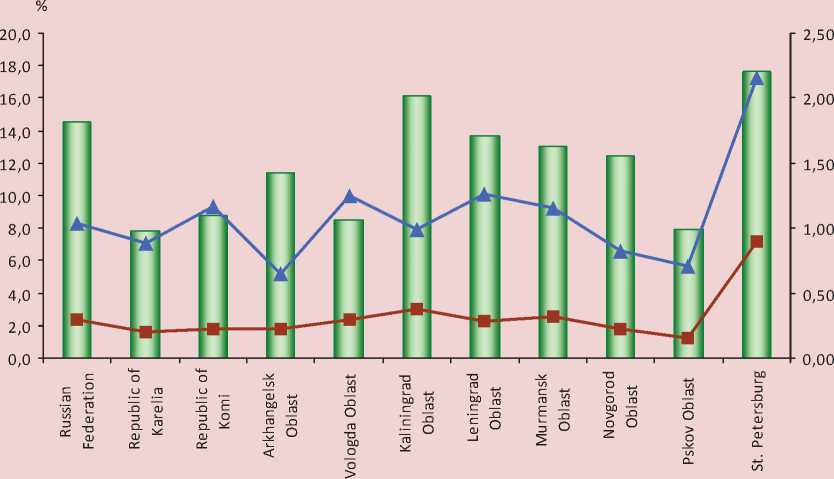
The share of RF subjects’ expenses for housing and utilities services C patron C recomp
-
✓ using public-private partnerships as a mechanism to attract private investment in the infrastructure sector (budget co-finan-cing of private investments to the projects on the modernization of communal infra-structure);
-
✓ increasing the target orientation of housing and communal subsidies.
Thus, only the gradual actions of federal, regional and municipal governments and private investors, coordinated in the economic, social and political terms, are able to make the conditions for balanced financing of the housing and utilities complex and the rapid modernization of the sector.
References Funding problems of regional housing and utilities sector and the ways to solve them
- Boldyreva I.A. Directions of structural changes in the financial mechanism of housing and communal services. Finance and Credit. 2007. No. 36. P. 69-75.
- Barabanov A.S., Taslunov A.N. Resource-saving as a basic priority of the reforms in the housing and utilities sector (in the case of water supply in Vologda). In: RISC: Resources, Information, Supply, Competition. 2011. No. 4. P. 386-368.
- Housing and utilities sector and household services. 2010: Stat. Coll. Rosstat. Moscow, 2010. -339 p.
- Naiden S.N. Public goods and communal services. Moscow: Economics, 2004. 176 p.
- Taslunov A.N., Barabanov A.S. Analysis of tariff regulation in housing and utilities economy (in the case of the city of Vologda). Economic and social changes: facts, trends, forecast. 2011. No. 6. P. 106.
- Taslunov A.N. Housing and communal services sustainable development peculiarities (in the case of Vologda city). Problems of development of territories. 2012. No. 3. P. 33.
- Uskova T.V. Gordina O.N., Barabanov A.S. Reforming housing and communal services: regional aspect. Problems of development of territories. 2010. No. 5. P. 14-19.
- Long-term fiscal strategy of the Russian Federation until 2023. Available at: http://info.minfin.ru/
- Official website of the State Corporation Fund of assistance to reforming housing and communal services. Available at: http://www.fondgkh.ru/
- The official website of the Kommersant Newspaper. Available at: http://www.kommersant.ru/
