Fuzzy clustering of sequential data

Author: B.K. Tripathy, Rahul
Journal: International Journal of Intelligent Systems and Applications @ijisa
Article in issue: 1 vol.11, 2019.
Free access
With the increase in popularity of the Internet and the advancement of technology in the fields like bioinformatics and other scientific communities the amount of sequential data is on the increase at a tremendous rate. With this increase, it has become inevitable to mine useful information from this vast amount of data. The mined information can be used in various spheres; from day to day web activities like the prediction of next web pages, serving better advertisements, to biological areas like genomic data analysis etc. A rough set based clustering of sequential data was proposed by Kumar et al recently. They defined and used a measure, called Sequence and Set Similarity Measure to determine similarity in data. However, we have observed that this measure does not reflect some important characteristics of sequential data. As a result, in this paper, we used the fuzzy set technique to introduce a similarity measure, which we termed as Kernel and Set Similarity Measure to find the similarity of sequential data and generate overlapping clusters. For this purpose, we used exponential string kernels and Jaccard's similarity index. The new similarity measure takes an account of the order of items in the sequence as well as the content of the sequential pattern. In order to compare our algorithm with that of Kumar et al, we used the MSNBC data set from the UCI repository, which was also used in their paper. As far as our knowledge goes, this is the first fuzzy clustering algorithm for sequential data.
Clustering, Fuzzy Clustering, Sequence mining, Similarity measures, Pattern mining
Short address: https://sciup.org/15016562
IDR: 15016562 | DOI: 10.5815/ijisa.2019.01.05
Text of the scientific article Fuzzy clustering of sequential data
Published Online January 2019 in MECS
Clustering of data is an integral part of Data Mining and serves an important role in many fields such as pattern recognition, scientific data exploration, taxonomy, medicine, geology, business, engineering systems, information retrieval, text mining and image processing. It is a process of grouping data based on their similarity such that elements in individual groups are having more similarity than elements in different groups. There are several approaches to classify the processes of clustering.
With respect to the formation of clusters, it may be hierarchical or non-hierarchical. Hierarchical clustering can further be divided into agglomerative (bottom-up) or divisive (top-down). The additional feature of a sequential dataset in comparison to the normal datasets is the order of occurrence of elements. Sequential data analysis is one of the vital research areas which include deriving better similarity measures, clustering and classification. Several forms of sequential data sets are available; like weblogs, music files, transaction records, and genomic data. There has been an enormous growth in data in various domains including scientific and commercial. These data have inherent sequential nature. Clustering and classification of this sequential data have various applications. As has been found in literature, there have been various methods to classify/cluster sequential data using model-based techniques like the most widely used Hidden Markov models and feature based techniques.
The central problem is the similarity measure that can capture both the content and sequential nature of the items in the given sequential data. In this paper, we will be using kernel-based functions to capture the sequential nature and Jaccard's set similarity measure to capture the content of the sequences. We used fuzzy clustering algorithms to cluster the data into various overlapping clusters based on the similarity or dissimilarity of the sequences.
The rest of the paper is organized as follows. In section 2, a brief literature review along with the problem statement is provided. A new similarity measure called Kernel and Set Similarity Measure (KS2M) is introduced in section 3. In section 4, a brief description of the data set is given that is used for experimentation; also a comparison is made between the new similarity measure KS2M and Sequence and Set Similarity Measure (S3M). In section 5, a brief overview of fuzzy set theory and fuzzy clustering algorithms is provided. The proposed algorithm is introduced in section 6. The analysis of the experiment and results obtained are presented in section 7 and we conclude our findings in this paper in section 8.
-
II. Literature Review and Problem Statement
Clustering can be classified on a broader level into hierarchical and non-hierarchical clustering methods. The main difference between the two methods is that in non-hierarchical clustering methods, a desired number of clusters is assumed at the start while in hierarchical methods, a series of successive fusions or divisions are performed based on some external similarity or dissimilarity parameters. Hierarchical clustering methods include agglomerative clustering of data which is bottom-up i.e. starting from single elements or data points they will be merged into a cluster based on some similarity measure, and divisive where the elements/data points are partitioned into smaller partitions (clusters) in the top to bottom manner. Then we have different methods of selecting the data to be clustered like feature based; where we extract some features form the given data and satisfies the following characteristics in the context of sequence mining [35].
-
1. Effectiveness in capturing the sequential relations between the different set of elements contained in the sequences
-
2. Wide presence in sequences
-
3. Completeness of the derived feature space
There are various methods suggested for feature selection or alternatively feature pruning in literature like the global and local approach in [19].
We also have model-based clustering techniques, the strategies discussed before i.e. feature based and hierarchical, directly work on the raw data with a definition of the distance or similarity measure or indirectly extract features from the raw data and use the existing clustering algorithms for feature vector based data. The models can be Gaussian, t-distribution for nonsequence data clustering. Among all the possible models, the hidden Markov model (HMM), perhaps the most important one is widely used in speech recognition extensively. We also have other models for sequence clustering like Mixtures of ARMA Models, Mixture of Markov Chains and Mixture of Polynomial models [35].
Along with hard clustering algorithms as mentioned above, in which a particular data point or sequence can only belong to one cluster, Soft clustering algorithms are also there which are based on the principles of the fuzzy set theory [50], rough sets [28]. In soft clustering, a data point or sequence can belong to multiple clusters with a membership value lying in (0, 1) to each cluster.
Work has been done to get Rough overlapping clusters using a Sequence and Set Similarity Measure (S3M) [5], which are defined as:
53M ( A, B ) = p * SeqSim( A, B ) + q * SetSim(A, B ) , where p + q =1 (1)
SeqSim(A, B ) = LLCS ( A, B ) / max(| A |,| B |) (2)
and SetSim (A, B) is the Jaccard similarity coefficient given by:
j-' = -S B
Various comparisons were made between this S3M and other similarity measures in [24].
As to be pointed out in the next section, there are some drawbacks of using Length of Longest Common Subsequence (LLCS) to measure the similarity of the order or sequence in a given sequential data. To overcome this problem we have introduced a new similarity measure based on string kernels. The soft clusters obtained by the rough clustering approach don’t specify the degree or membership of a particular sequence to different clusters. We develop a fuzzy clustering method that provides us the degree to which a particular sequence belongs to a cluster.
-
III. Proposed New Similarity Metric
We first start with the main issues which are associated with measures of similarity of two sequences defined through LLCS. The following points need attention:
-
1. LLCS does not take the position of items into account.
-
2. LLCS does not consider the length of the part which is not common into account (uses the length to normalize the result.)
We consider the following example to illustrate the above two points. Let us take the three sequences,
A = a , b, c, d, e , B = q, a , e , m, n and C = a , e , t, r, s.
The length of the longest common sub-sequence in all three is two; the subsequence being {a, e} irrespective of the location of the items. Intuitively the pair {B, C} should be more similar than {A, C}, and {A, B}. But, LLCS returns the value ‘two' for all the pairs.
Jaccard’s similarity index is a good similarity index for obtaining the content similarity between given sequences but we can’t infer anything about the order of the items/elements in the given sequence.
For example, consider two sequences: A = {1, 2, 3, 4} and B = {4, 3, 2, 1} using the Jaccard’s measure the similarity between A and B is ‘1’; i.e. both are completely similar but from the sequential perspective, the two are completely different as the order of occurrence of elements is in the two sequences is completely different.
On a broader level, we can say that in the similarity measure S3M, the first component LLCS is used to get the sequential order from the data and the second component, which is set similarity, is used to get the content of the given data set.
Basing upon the two notes above, we propose that instead of using LLCS, some other better measure can be used, so that it will take into account the position and length of the matching sub-sequence/substring. As a solution to this, we find that Kernel methods for comparing the sequential parts are a good candidate. There are many popular Kernel methods in the literature like Graph kernels, Polynomial kernel, Radial basis function kernel, String kernels as analyzed in [20].
Again, for strings we have various types of kernel methods; like the string sub-sequence kernel (SSK) [26] which allow the gaps or mismatch, whereas some others like the spectrum, compare only exactly matching substrings of the sequences. A nice presentation and analysis on string kernels is provided in [1]. For the sake of completeness, we provide below an overview of some of the commonly used string kernels.^
Spectrum: This kernel considers only matching the substring of exactly specified length. Each such substring is given a constant weight.
Boundrange: This kernel considers only matching substrings of length less than or equal to a given number N .
Constant: This kernel considers all matching substrings and assigns constant weight to each of them.
Exponential: Also called exponential decay kernel has the property that the weights of the substrings decay as the matching substring get longer. This kernel requires a decay factor.
It is worth noting that although string kernels take care of the order of the items and to some extent the content (as common substrings are similar in order as well as content); by using only substring matches they ignore the non-sequential part which might be similar in content. So, it is felt that in order to consider the content of the sequences we can use the same Jaccard's similarity coefficient instead. Both the components; the order of items and their contents are essential as in some applications like web mining, the order of the items is more important/ relevant than the content whereas in some other areas related to bioinformatics the content is more important. Taking into account the abovementioned factors we propose the following Kernel andKS2M .
KS2M ( A, B ) = p * SK ( A, B ) + q * J ( A, B ) (4)
where p + q = 1 such that values of p and q act as weight factors, and can be varied as per the requirements of the application domain or area. SK stands for any String based kernel we have done used to string kernels one is the Exponential Decay String Kernel from [1] and the other one is String Subsequence Kernel [26] for the sake of comparison between different kernels.
To overcome the limitations of LLCS we used the exponential string kernel in which the substring weight decays as the matching substring gets longer. For example, consider the three random strings: x = "abcdefl”, y = "agbjckd” and z = "abncdmv". The matching substring in these strings is “abcd”. But a closer look at the sequences says that the similarity between x and y should be less than the similarity between x and z as the length of the matching substring is seven (agbjckd) in case of y and that for z it is five (abncd).
This kernel requires a decay factor [1] lambda >1.The decay factor is used to assign more weight to those substrings in which the length of matching substring is smaller in comparison to those in which the length is larger as explained in the above example of three sequences x, y, and z.
It is mentioned in [14] that in order to qualify as a good metric, a similarity measure should satisfy the properties of symmetricity, non-negativity and normalized. All these are satisfied by as
Symmetric: KS 2 M (A, B) = KS 2 M (B, A)
Let's take two strings "abcde" and "bc", length of common matching substring taken into consideration by the string kernel is three i.e. to match the common pattern "bc", first three characters of string "abcde" has to be considered. This is symmetric in the sense that the length will remain same for KS 2 M (“abcde”, “bc”) and for (“bc” , “abcde”).
Non-negativity: By its definition, KS 2 M generates non-negative similarity value.
At maximum the value returned by KS2M can be zero because the similarity between two strings at worst can be zero i.e. they are completely different strings. There is no meaning of negative similarity in KS2M as components, the string kernel, and the Jaccard's similarity index are based only on the common pattern between two given sequences which can be zero at the minimum for two totally different sequences.
Normalized: The value returned by KS 2 M is normalized to lie in the unit interval [0, 1] for better comparison between the different set of sequences.
There are kernels like String Subsequence Kernel (SSK) [28] which takes into account the position of matching substring or subsequence. SSK appears to be too strict on limited length sequential data as shown in the next section.
-
IV. Description of the Dataset and Comparison of KS 2 M WITH S 3 M
Internet Information Server (IIS) logs for MSNBC.com and news related portions of msn.com for the entire day of September 28, 1999, is collected from the UCI dataset repository. Each sequence in the dataset corresponds to page views of a user during that twenty-four hour period. There are 17 page categories, namely ‘frontpage', 'news', tech', ‘local', ‘opinion', ‘on-air', ‘misc', ‘weather', 'health', ‘living', ‘business', ‘sports', ‘summary', ‘bbs', ‘travel', ‘msn-news', and ‘msn-sports'. Table 1 below shows the characteristics of the dataset.
Table 1. Characteristics of the Data Set
|
Number of users |
989,818 |
|
Minimum session length |
1 |
|
Maximum session length |
500 |
|
Average number of visits per user^ |
5.7 |
To compare the validity and effectiveness we will be taking the same data samples taken in [26] which consider the following ten random sequences from the above-mentioned dataset of length 6 (as average length is 5.7):
T1: on-air misc misc misc misc on-air misc
T2: news sports tech local sports sports
T3: bbs bbs bbs bbs bbs bbs
T4: frontpage frontpage sports news news local
T5: on-air weather weather weather weather sports
T6: on-air on-air on-air on-air tech bbs
T7: frontpage bbs bbs frontpage frontpage news
T8: frontpage frontpage frontpage frontpage frontpage bbs
T9: news news travel opinion opinion msn-news
T10: frontpage business frontpage news news bbs
We will be using average silhouette width to compare the given similarity measures [33]. Silhouette width value varies between -1 to 1 and in general the greater the value the better are the clusters. The method for the computation of silhouettes as described in [33] is as follows:
Table 2. Similarity Matrix Using Proposed Metric KS 2 M With P = 0.5
|
T1 |
T2 |
T3 |
T4 |
T5 |
T6 |
T7 |
T8 |
T9 |
T10 |
|
|
T1 |
1.000 |
0.011 |
0.006 |
0.014 |
0.165 |
0.245 |
0.011 |
0.010 |
0.041 |
0.011 |
|
T2 |
0.011 |
1.000 |
0.138 |
0.580 |
0.208 |
0.147 |
0.333 |
0.152 |
0.253 |
0.336 |
|
T3 |
0.006 |
0.138 |
1.000 |
0.151 |
0.040 |
0.274 |
0.528 |
0.448 |
0.076 |
0.334 |
|
T4 |
0.014 |
0.580 |
0.151 |
1.000 |
0.184 |
0.075 |
0.485 |
0.387 |
0.267 |
0.551 |
|
T5 |
0.165 |
0.208 |
0.040 |
0.184 |
1.000 |
0.175 |
0.099 |
0.063 |
0.078 |
0.095 |
|
T6 |
0.245 |
0.147 |
0.274 |
0.075 |
0.175 |
1.000 |
0.203 |
0.216 |
0.091 |
0.182 |
|
T7 |
0.011 |
0.333 |
0.528 |
0.485 |
0.099 |
0.203 |
1.000 |
0.664 |
0.228 |
0.724 |
|
T8 |
0.010 |
0.152 |
0.448 |
0.387 |
0.063 |
0.216 |
0.664 |
1.000 |
0.120 |
0.650 |
|
T9 |
0.041 |
0.253 |
0.076 |
0.267 |
0.078 |
0.091 |
0.228 |
0.120 |
1.000 |
0.262 |
|
T10 |
0.011 |
0.336 |
0.334 |
0.551 |
0.095 |
0.182 |
0.724 |
0.650 |
0.262 |
1.000 |
In the case of dissimilarities, take any object i (in our case any sequence) in the data set and denote by A the cluster to which it has been assigned. When cluster A contains other objects apart from i, then we can compute:
a(i) =average dissimilarity of i to all other objects of A
Now consider any cluster C which is different from A and compute:
d(i, C) =average dissimilarity of i to all objects of C.
Do this for all clusters C ≠ A , select the smallest of those numbers and denote it by b(i). Basically what we are looking for is the cluster apart from A which can be a good candidate or second best choice for the assignment of object i. Then the number s(i) silhouette of i is obtained by combining a(i) and b(i) as follows:
1 - {й(/) / b(ff if a^f < b(f);

b(i) / a(f)
, if a(i) = b(if , if cfi) > b(if
when cluster A contains only a single object it is unclear how a(i) should be defined and then it is simply set to zero, as a value of zero appears to be most neutral. As mentioned earlier, we can easily observe from the above definitions that -1 ≤ s(i) ≤ 1 for each object i . In case similarities are used then the same definition can be used with slight modifications as explained in [33].
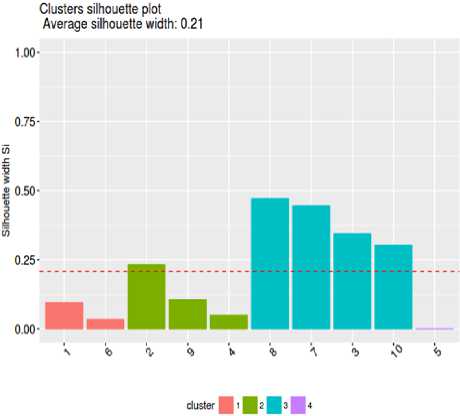
Fig.1. Cluster Silhouette plot with k = 4 using KS 2 M (lambda = 1.3) similarity measure
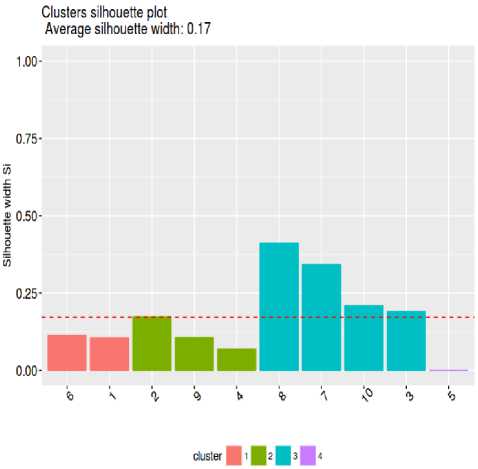
Fig.2. Cluster Silhouette plot with S 3 M similarity measure with k=4 and p=0.5
As is clearly visible from the silhouette plots, average silhouette width value (greater the better) is greater when KS 2 M it is used as similarity measure instead of S3M leading to the conclusion that KS 2 M is comparable to S3M.Similar results were obtained when compared with a larger number of transactions.
In the next section, a brief overview of Fuzzy sets and fuzzy clustering is presented, to put our proposed algorithm in the proper perspective. The reason for developing a soft clustering technique like fuzzy clustering instead of hard clustering is that the elements of sequential data sets might be similar to each other, some are more similar and some are less. For example, let's take the A = {a, b, c, d, e, f}, B = {b, c, d, e, g, h}, and C = {e, g, h, j, k, l}. The similarity of the pair of sequences A and B is higher than that of the pair B and C, as A and B have common sequential part {b, c, d, e} of length four; whereas B and C have the common sequential part {e, g, h}, which has length three. So, similarities of sequences are graded and also the clusters formed have common elements. Hence, scenarios like this can be taken care in a better way by soft clustering methods than hard computing algorithms.
-
V. Fuzzy Set and Clustering
Uncertainty in data has become an inherent issue in modern-day datasets. To handle such uncertainty many uncertainty based models have been proposed over the years. Fuzzy set theory introduced by Zadeh in 1965 [49] is one of the most fruitful of such methods. In contrast to dichotomous nature of crisp sets where an element may be in a set or may not be in it, fuzzy set permits graded membership of elements in it. A fuzzy subset X of a universal set U is given by a function µ : U → [0, 1] such that ∀ x ∈ U , µ ( x ) = α ∈ [0, 1] .
Extending the notion of non-membership value of elements in a fuzzy set, the notion of non-membership functions was introduced by Atanassov in [4]. It captures the uncertainty in data in a more realistic manner. Fuzzy set theory for cluster analysis was first proposed in Bellman et al [5] followed by the fuzzy c-means (FCM) algorithm in Ruspini [36-38]. The objective function approach to fuzzy c-means started by Ruspini [37]. This was followed by its improvement by Roubens [33], as the objective function in [36] was complicated and difficult to interpret. But, the objective function in [33] was unstable and Libert and Roubens [25] tried to modify it. This trend was followed by modification of objective functions in Hathaway et al [12, 13] and Bezdek et al [9, 10]. An iterative algorithm which is a variation of the coordinate descent method was described in [35]. But, perhaps the FCM what is used now a day has its origin in the paper by Dunn [13], which was generalized by Bezdek [6]. This method is widely used and applied in a variety of substantive areas. Rough sets were introduced by Pawlak in 1982 [30]. The above approach is now followed extensively in developing clustering algorithms which are either extension like intuitionistic fuzzy C-means (IFCM) [12] and the hybrid algorithm of rough fuzzy c-means (RFCM) [28, 29, 31] and the rough intuitionistic fuzzy c- means (RIFCM) [11]. It may be noted that several generalized versions of FCM exist in the literature [7, 8, 15, 17, 36, 48, 50]. However, there are no fuzzy algorithms to cluster sequential data available in the literature [32]. In this paper, our attempt is to develop a fuzzy clustering algorithm for sequential data.
Variants of fuzzy set based or its hybrid models have been used in developing clustering algorithms to handle specific situations in data analysis. For example Hu et al [24, 27] have extended fuzzy clustering to ordinal scale and further by using likelihood functions. Genetic algorithms are now well-known methods to handle optimization situations. Using particle swarm optimization (PSO) an efficient clustering algorithm is proposed in [5]. Incomplete data sets are common in modern societies due to various reasons. Handling such data sets have been dealt with from different angles. A fuzzy clustering algorithm is proposed in this direction in [26]. A Clustering technique has been proposed in [47] which deals with unstructured activity analysis using the generalised notion of covering rough sets. Graph clustering algorithms are relatively rare in the literature. A brief account of such algorithms based on FMST with a comparative analysis is found in [39]. Datasets may be heterogeneous, i.e. they may contain categorical and nominal attributes together. Several algorithms have been developed in the literature to handle clustering of such data sets using rough set theory. The latest one which generalises the family of such algorithms is presented in [45], called the Min Mean Mean Rough set clustering algorithm (MMeMeR), which has been found to be the most efficient and the authors have observed that this algorithm if extended by using existing techniques followed in the family of algorithms leading to this does not provide any improvement in the clustering process. An adaptive clustering approach is provided in [16] and an application to medical diagnosis is provided in [15, 41].
cycle FANNY performs a loop over all the pairs of objects and in case of Fuzzy C-Means the looping is over the measurement variables and the number of objects is normally more than double of the number of variables. In the improved algorithm the following objective function is to be minimized:
k z p =1
Z" j =1 ^ j d ( i , j ) 2V " ^m
Z—i j =1 ip
Here, the membership of the ith object to cluster p is represented by ^p . It may be noted that the numerator of the objective function contains dissimilarities d ( i , j ) and the membership coefficients to be determined and the sum is over all pairs of objects unlike objective functions of other algorithms which contain the sum of distances of objects from cluster centres. The factor ‘2’ in the denominator takes care of distances between a pair of objects being counted twice because of similarity.
To measure the fuzziness of the clusters we have used the Dunn’s partition coefficient (1976) given by
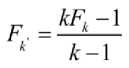
F = y« yk Hp_ k z I=1z p=1 n
The expression in (4) assumes the minimal value 1/k, l when the clustering is complete and the maximal value ‘1’ occurs for crisp partitioning. The normalized version F is given by
-
VI. Moving Towards the Fuzzy Clusters
The c-means algorithms (hard or fuzzy) are popular and effective tools in order to cluster n objects into groups of similar individuals for data available as a set of n feature vectors in RP. It may be noted that for data sets described in terms of relational data cannot be handled by these algorithms directly [18, 48, 49].There are various algorithms in the literature to handle relational data for fuzzy clustering including the "Relational dual of the c-means clustering algorithm" [18] which is the dual of the most widely used Fuzzy c-Means algorithm. There are some constraints on using these algorithms, some require that the distance or similarity(dissimilarity) measure should be derived from the Euclidean distance[RFCM].To overcome this distance measure constraint a new algorithm NERFCM which involves extra computations for data expansion(Beta-spread transformation)was introduced [18].
We will be using a variant of FANNY(by Kaufman and Rousseeuw) [23], which is extended by Martin M. et al [27] to allow user-specified parameters like the value of fuzzifier (m), which is fixed to 2 in the original algorithm. It is more robust to spherical cluster assumption and also provides a novel graphical display, the silhouette plot. When compared to the likes of Fuzzy C-means, FANNY is a bit slower as in each iteration
and ranges between 0 and 1.In the next section, the overall outline of the algorithm is given, which is used for clustering of the above-mentioned datasets.
-
A. Algorithm for Fuzzy Clustering of Sequential Data
Fanny requires the dissimilarity matrix or the pairwise dissimilarity of the given objects. The clustering algorithm is free from the distance or similarity metric used to generate the pairwise similarity. Here, we use the KS 2 M similarity metric to generate the similarity matrix, then to obtain the entries of the dissimilarity matrix we take the 1’s complement of corresponding entries in the similarity matrix, which provides us the respective pairwise dissimilarity. The dissimilarity matrix is required because FANNY starts with a collection of dissimilarities and doesn’t depend upon any other measure. Overall, the detailed description of the algorithm is as follows:
Algorithm: Fuzzy Clustering of Sequential data
Input:
T: A set of n transactions
K: No. of clusters
m: Fuzzifier value tol: tolerance value max_it: Maximum no. of Iterations
Output:
K number of overlapping clusters
-
V: normalized Dunn’s partition coefficient
P: a silhouette plot for each transaction/sequence.
Begin:
Step 1: Construct the similarity matrix (sim_m) using KS 2 M measure.^
Step 2: Construct dissimilarity (diss) matrix by taking 1’s complement of sim_m.
Step 3: while (not converged and iterations< max_it): fanny(diss,k,m,max_it,tol)
Step 4: Return K clusters.
End
iterations are given as input parameters.
In the next section, the above-mentioned algorithm is used on variable sizes of the dataset. While performing the experimental analysis, it was observed that sometimes the computation time for more transactions (sequences) is less as compared to a smaller number of transactions i.e. the number of iterations needed is smaller for the prior. The time complexity of FANNY cannot be computed or hard to do so as the data size determines the number of iterations. One can go through chapter 4 of [25] for the detailed explanation of FANNY along with its similarities to other fuzzy clustering algorithms like Fuzzy c-means and others.
-
VII. Experimental Results
We have conducted experiments on data sets of variable size ranging from ten to three thousand randomly selected transactions. Results obtained are summarized in Table 5. For the better selection of the number of clusters we have used the average Silhouette width as a cluster validation factor; that is, we have selected the number of clusters as the value of the maximum average silhouette width for a given set of inputs. This is shown in Fig. 3.
The clusters obtained are overlapping clusters i.e. each transaction is assigned to different clusters with different memberships. To have a look at the structure of the clusters formed, we present the results of fifty randomly selected transactions. The categories are labelled with integers; like labels of ‘frontpage' and ‘news' are ‘1’ and ‘2’ respectively. The hits of a user are presented in the rows of Table 4.
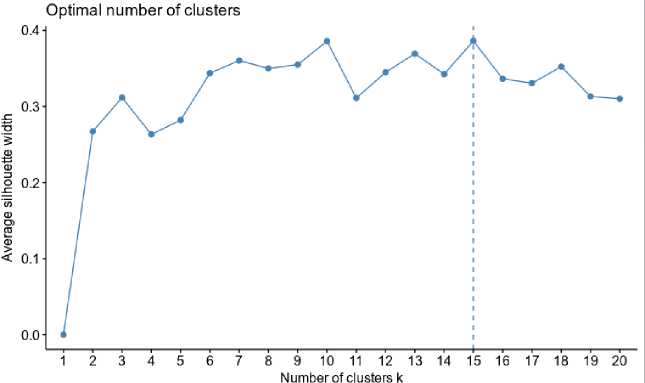
Fig.3. Computation of the no. of clusters using average Silhouette width for transactions listed in Table 3
Table 3. Sample of Fifty Web Transactions
|
1 |
(‘3’, ‘2’, ‘2’, ‘4’, ‘2’, ‘2’) |
26 |
(‘6’, ‘2’, ‘2’, ‘2’, ‘15’, ‘2’) |
|
2 |
(‘6’, ‘7’, ‘7’, ‘7’, ‘6’, ‘6’) |
27 |
(‘1’, ‘14’, ‘1’, ‘14’, ‘1’, ‘1’) |
|
3 |
(‘6’, ‘9’, ‘4’, ‘4’, ‘4’, ‘10’) |
28 |
(‘9’, ‘7’, ‘7’, ‘9’, ‘4’, ‘4’) |
|
4 |
(‘8’, ‘8’, ‘1’, ‘7’, ‘8’, ‘8’) |
29 |
(‘1’, ‘14’, ‘14’, ‘14’, ‘14’,’14’) |
|
5 |
(‘13’, ‘7’, ‘13’, ‘7’, ‘7’, ‘13’) |
30 |
(‘1’, ‘1’, ‘14’, ‘1’, ‘14’, ‘14’) |
|
6 |
(‘13’, ‘8’, ‘13’, ‘13’, ‘13’, ‘14’) |
31 |
(‘8’, ‘8’, ‘8’, ‘8’, ‘8’, ‘8’) |
|
7 |
(‘13’, ‘13’, ‘13’, ‘13’, ‘13’, ‘13’) |
32 |
(‘1’, ‘1’, ‘11’, ‘11’, ‘11’, ‘1’) |
|
8 |
(‘1’, ‘1’, ‘11’, ‘1’, ‘12’, ‘1’) |
33 |
(‘9’, ‘9’, ‘13’, ‘13’, ‘13’, ‘13’) |
|
9 |
(‘14’, ‘14’, ‘14’, ‘14’, ‘14’, ‘14’) |
34 |
(‘6’, ‘6’, ‘6’, ‘15’, ‘5’, ‘6’) |
|
10 |
(‘9’, ‘12’, ‘9’, ‘9’, ‘9’, ‘9’) |
35 |
(‘1’, ‘3’, ‘3’, ‘1’, ‘1’, ‘1’) |
|
11 |
(‘1’, ‘2’, ‘1’, ‘14’, ‘14’, ‘14’) |
36 |
(‘1’, ‘1’, ‘10’, ‘1’, ‘1’, ‘1’) |
|
12 |
(‘1’, ‘4’, ‘7’, ‘1’, ‘10’, ‘10’) |
37 |
(‘9’, ‘9’, ‘9’, ‘4’, ‘4’, ‘4’) |
|
13 |
(‘1’, ‘1’, ‘4’, ‘10’, ‘10’, ‘10’) |
38 |
(‘4’, ‘4’, ‘4’, ‘4’, ‘4’, ‘4’) |
|
14 |
(‘8’, ‘8’, ‘8’, ‘8’, ‘8’, ‘8’) |
39 |
(‘6’, ‘6’, ‘6’, ‘6’, ‘6’, ‘6’) |
|
15 |
(‘9’, ‘7’, ‘9’, ‘7’, ‘7’, ‘9’) |
40 |
(‘8’, ‘8’, ‘14’, ‘14’, ‘14’, ‘4’) |
|
16 |
(‘4’, ‘4’, ‘10’, ‘10’, ‘10’, ‘10’) |
41 |
(‘9’, ‘7’, ‘9’, ‘5’, ‘5’, ‘5’) |
|
17 |
(‘8’, ‘8’, ‘8’, ‘8’, ‘8’, ‘13’) |
42 |
(‘1’, ‘2’, ‘1’, ‘2’, ‘1’, ‘6’) |
|
18 |
(‘1’, ‘1’, ‘1’, ‘12’, ‘1’, ‘10’) |
43 |
(‘9’, ‘3’, ‘4’, ‘6’, ‘7’, ‘7’) |
|
19 |
(‘13’, ‘13’, ‘13’, ‘13’, ‘13’, ‘13’) |
44 |
(‘9’, ‘5’, ‘5’, ‘5’, ‘5’, ‘5’) |
|
20 |
(‘13’, ‘13’, ‘13’, ‘14’, ‘14’, ‘14’) |
45 |
(‘1’, ‘11’, ‘17’, ‘1’, ‘1’, ‘6’) |
|
21 |
(‘5’, ‘5’, ‘5’, ‘5’, ‘5’, ‘5’) |
46 |
(‘12’, ‘12’, ‘12’, ‘14’, ‘14’, ‘14’) |
|
22 |
(‘11’, ‘1’, ‘1’, ‘1’, ‘2’, ‘1’) |
47 |
(‘13’, ‘13’, ‘13’, ‘13’, ‘13’, ‘13’) |
|
23 |
(‘8’, ‘8’, ‘8’, ‘8’, ‘8’, ‘8’) |
48 |
(‘1’, ‘14’, ‘14’, ‘14’, ‘14’, ‘1’) |
|
24 |
(‘9’, ‘9’, ‘9’, ‘9’, ‘9’, ‘5’) |
49 |
(‘1’, ‘6’, ‘6’, ‘10’, ‘10’, ‘10’) |
|
25 |
(‘1’, ‘2’, ‘2’, ‘2’, ‘2’, ‘2’) |
50 |
(‘12’, ‘12’, ‘12’, ‘12’, ‘12’, ‘12’) |
Tolerance =1e-5
No. of clusters (k) =15
p = 0.6, q = 0.4 (order of the sequence is given more weight) m = 1.7
Clusters silhouette plot Average silhouette width: 0.36
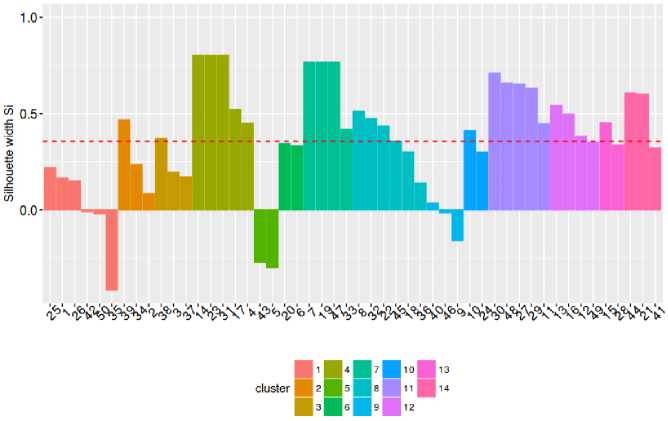
Fig.4. Cluster Silhouette plot with k=15 using the KS 2 M similarity measure
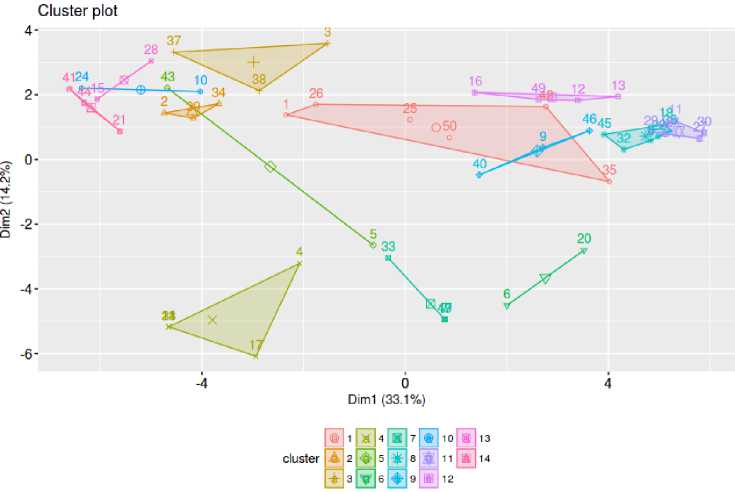
Fig.5. Crisp cluster plot of the transactions in Table 2
Underlying cluster structure: As we have used fuzzy clustering algorithms, the clusters should have an overlapping structure i.e. one transaction can belong to various clusters with varying membership values lying in (0, 1).A crisp cluster plot can be shown by assigning the data sequences to those clusters in which they have the maximum membership value, the tie is broken by selecting anyone cluster randomly, such a plot is shown in Fig. 5. In Table 4 we have listed the degrees of belongingness of the first 10 transactions from Table 3, to 15clusters.
Table 4. Membership Values of First Ten Transactions
|
C1 |
C2 |
C3 |
C4 |
C5 |
|
|
T1 |
0.1247107547 |
4.786556e-02 |
6.306157e-02 |
4.150351e-02 |
0.1247107547 |
|
T2 |
0.1017356296 |
1.279904e-01 |
6.065663e-02 |
3.979379e-02 |
0.1017356296 |
|
T3 |
0.0083193159 |
4.042299e-03 |
9.301986e-01 |
2.620698e-03 |
0.0083193159 |
|
T4 |
0.1062574976 |
4.283117e-02 |
4.715071e-02 |
1.190521e-01 |
0.1062574976 |
|
T5 |
0.1085935313 |
4.055198e-02 |
4.606384e-02 |
3.515933e-02 |
0.1085935313 |
|
T6 |
0.0104532972 |
3.597261e-03 |
4.435396e-03 |
4.195599e-03 |
0.0104532972 |
|
T7 |
0.0001727610 |
6.942278e-05 |
7.907199e-05 |
6.127987e-05 |
0.0001727610 |
|
T8 |
0.0644565646 |
1.475648e-02 |
1.780729e-02 |
1.274614e-02 |
0.0644565646 |
|
T9 |
0.0118194561 |
4.261906e-03 |
6.505562e-03 |
3.719402e-03 |
0.0118194561 |
|
T10 |
0.0945576283 |
4.018902e-02 |
5.780429e-02 |
3.502571e-02 |
0.0945576283 |
|
C6 |
C7 |
C8 |
C9 |
C10 |
|
|
T1 |
5.547569e-02 |
4.433506e-02 |
5.948177e-02 |
5.596454e-02 |
4.890683e-02 |
|
T2 |
4.861291e-02 |
3.972324e-02 |
5.263081e-02 |
4.877193e-02 |
4.661362e-02 |
|
T3 |
3.796023e-03 |
2.818474e-03 |
4.037273e-03 |
4.761592e-03 |
4.031263e-03 |
|
T4 |
6.109563e-02 |
3.968123e-02 |
6.427554e-02 |
5.020444e-02 |
4.333372e-02 |
|
T5 |
9.241485e-02 |
9.259198e-02 |
6.178594e-02 |
5.153410e-02 |
4.095466e-02 |
|
T6 |
9.060171e-01 |
1.404459e-02 |
6.199910e-03 |
7.163494e-03 |
3.657663e-03 |
|
T7 |
3.330332e-04 |
9.983418e-01 |
1.089503e-04 |
9.114765e-05 |
7.050041e-05 |
|
T8 |
2.354641e-02 |
1.719810e-02 |
5.890399e-01 |
2.274222e-02 |
1.503953e-02 |
|
T9 |
8.445114e-03 |
4.426664e-03 |
6.770689e-03 |
8.814046e-01 |
4.335732e-03 |
|
T10 |
4.627521e-02 |
3.730241e-02 |
5.513418e-02 |
4.623465e-02 |
1.711853e-01 |
|
C11 |
C12 |
C13 |
C14 |
C15 |
|
|
T1 |
4.858132e-02 |
6.107853e-02 |
5.058996e-02 |
4.902339e-02 |
0.1247107547 |
|
T2 |
4.324751e-02 |
5.211687e-02 |
8.672480e-02 |
4.791062e-02 |
0.1017356296 |
|
T3 |
4.113494e-03 |
6.988868e-03 |
4.110347e-03 |
3.523083e-03 |
0.0083193159 |
|
T4 |
5.266665e-02 |
5.980031e-02 |
5.694969e-02 |
4.418633e-02 |
0.1062574976 |
|
T5 |
4.754302e-02 |
5.763058e-02 |
6.618988e-02 |
4.179925e-02 |
0.1085935313 |
|
T6 |
6.235334e-03 |
5.658205e-03 |
3.758548e-03 |
3.677021e-03 |
0.0104532972 |
|
T7 |
8.445117e-05 |
9.891202e-05 |
7.216886e-05 |
7.101965e-05 |
0.0001727610 |
|
T8 |
3.006254e-02 |
3.339625e-02 |
1.527503e-02 |
1.502042e-02 |
0.0644565646 |
|
T9 |
2.872958e-02 |
7.121539e-03 |
4.463450e-03 |
4.357355e-03 |
0.0118194561 |
|
T10 |
4.134532e-02 |
4.830115e-02 |
8.335657e-02 |
5.417334e-02 |
0.0945576283 |
Table 5. Experimental Results
|
No. of data samples |
No. of overlapping Clusters(k) |
Fuzzifier(m) |
Average Silhouette Width |
p |
Normalized Dunn’s Partition coefficient |
|
10 |
4 |
1.96 |
0.20 |
0.5 |
0.26 |
|
25 |
9 |
1.85 |
0.27 |
0.5 |
0.33 |
|
50 |
18 |
1.8 |
0.22 |
0.5 |
0.42 |
|
250 |
78 |
1.8 |
0.26 |
0.5 |
0.47 |
|
500 |
136 |
1.8 |
0.30 |
0.5 |
0.48 |
|
1000 |
187 |
1.7 |
0.28 |
0.5 |
0.44 |
|
2000 |
430 |
1.6 |
0.36 |
0.5 |
0.53 |
|
3000 |
515 |
1.7 |
0.39 |
0.5 |
0.50 |
|
3000 |
550 |
1.6 |
0.40 |
0.5 |
0.51 |
-
A. Result analysis
When the object set is increased in size, its dimension also goes up. It has been observed that the value of the fuzzifier m needs to be decreased so that proper clustering can be achieved. But robustness of a clustering algorithm varies directly as the value of m. As clearly visible from Table 6, the value of m has decreased from the maximum 1.96 to a minimum of 1.6 as the sample size increases from 10 to 3000.
Normalized Dunn's partition coefficient is used to measure the degree of fuzziness of the clusters formed. The value of Dunn's coefficient lies between 0 and 1, a value nearer to 1 represents crisper clusters while a value close to zero represents less crisper i.e. more fuzziness in the clusters formed. The value of this coefficient should increase as we decrease the value of fuzzifier (m), as the degree of fuzziness is controlled by the value of fuzzifier. There is no fixed value of fuzzifier that should be used, generally, a value between [1.5, 2.5] is suggested for obtaining fuzzy clusters [6].We have used the same range for our experimental analysis. As clearly visible from the Table 6, the value of Dunn’s coefficient agrees with our above observation between same data samples (3000 at 1.7 and 1.6) as well as between different data samples.
We have kept equal weightage for both parts the sequence and the content which can be varied as per the requirement of the domain as mentioned earlier, in some domains related to bioinformatics, the content is more important in that case the value of p can be decreased while in some domains related to web mining the sequence or order of items is more important in that case we can increase the value of p.
The algorithm used is stable can be established by the fact that the value of average silhouette width is always above 0.25 in most of the cases. In fact, as visible from Table 6, the value starts increasing as we increase the no. of data samples. The value of average silhouette width as mentioned earlier ranges between [-1, 1] and measures how good a given data sample belongs to its own cluster in comparison to the nearby clusters. The greater the value the good the clusters formed. The reason why we have used average silhouette width along with Dunn’s partition coefficient as a measure of cluster quality is that both of these two indices are used in the original algorithm as described in [23][24].
-
VIII. Conclusions
In this paper, we applied the concept of fuzzy clusters to classify different sequential patterns in different groups based on the sequence as well as content similarity. We introduced a new similarity measure KS 2 M which in comparison to other similarity measures like cosine similarity, Jaccard's similarity index and S3M captures the order and the content of the elements/items in the sequences more appropriately. In S3M, LLCS is used which has some limitations as mentioned above.
We have obtained overlapping clusters similar to what is obtained in [24] but the main difference lies in the specification of the degree (membership) of a particular sequence to a particular cluster instead of only the no. of overlapping clusters, a sequence or pattern belongs to. We would like to note that an integrated covering based rough fuzzy set based clustering algorithm was developed in [44] for sequential data which extends the algorithm proposed in [24]. ^
Different initial membership matrices will lead to different cluster structure, here we used a random initial membership matrix, and work can be done in future to improve this initial membership matrix to obtain more meaningful clusters. We have used silhouette width as an index to get a rough estimate of the number of clusters (k), other methods like analysis of kernel matrix; elbow method etc. can be compared to obtain an appropriate estimate of the value of k.
References Fuzzy clustering of sequential data
- K. Alexandros, A. Smola, K. Hornik and A. Zeileis, “kernlab - An S4 Package for Kernel Methods in R”, Journal of Statistical Software, vol. 11(9), (2004), 1-20.
- Anuradha, J., B.K.Tripathy and A. Sinha: Hybrid Clustering algorithm using Possibilistic Rough C-means, International journal of Pharma and Bio-informatics, vol.6, issue 4, (2015), pp.799-810.
- Anuradha, J. and Tripathy, B.K.: An optimal rough fuzzy clustering algorithm using PSO, Int. Jour. of Data Mining, Modeling and Management, vol.7, issue 4, (2014). pp. 257-275.
- Atanassov, K. T., Intuitionistic Fuzzy Sets, Fuzzy Sets and Systems, 20(1) (1986) 83-96.
- Bellman, R., Kalaba, R., and Zadeh, L. A., Abstraction and pattern classification, Journal of Mathematical Analysis and Applications, 2, (1966), 581-586.
- Bezdek, J. C., Pattern Recognition with Fuzzy Objective Function Algorithms, Plenum Press, New York, (1981).
- Bezdek, J. C., Coray, C., Gunderson, R. and Watson, J., Detection and characterisations of cluster substructure: I. Linear structure: Fuzzy C-lines, SIAM J. Appl. Math. 40(2) (1981), 339-357.
- Bezdek, J. C., Coray, C., Gunderson, R. and Watson, J., detection and characterisations of cluster substructure: II, Fuzzy c-varieties and convex combinations thereof, SIAM Journal of Applied. Math. 40(2) (1981), 358-372.
- Bezdek, J. C. and Hathaway, R. J., Dual object-relation clustering models, Int. J. General Systems, 16 (1990), 385-396.
- Bezdek, J. C. and Hathaway, R. J., Howard, R.E., Wilson, C. E. and Windham, M. P., Local convergence analysis of a grouped variable version of coordinate descent, J. Optimization Theory and Applications, 54 (3), (1986), 471-477.
- Bhargava, R., Tripathy, B.K., Tripathy, A., Dhull, R., Verma, E., and Swarnalatha, P., Rough intuitionistic fuzzy c-means algorithm and a comparative analysis, in: Proceedings of the 6th ACM India Computing Convention, (2013), 1-11.
- Chaira, T., A novel intuitionistic fuzzy C means clustering algorithm and its application to medical images, Applied Soft Computing, 11(2) (2011), 1711-1717
- Dunn, J. C., A fuzzy relative of the ISODATA process and its use in detecting compact, well-separated clusters, J. Cybernetics, 3 (1974) 32-57.
- Dunham, M.H., Data Mining: Introductory and Advanced Topics, Prentice Hall, NJ, (2003).
- G. Sasikumar and B.K.Tripathy: Classification and Analysis of EEG Brain Signals for Finding Epilepsy Risk Levels Using SVM, World Applied Sciences Journal, 33 (4), (2015), pp. 631-639.
- Guralnik, V. and Karypis, G., A scalable algorithm for clustering sequential data, In: Proceedings of the 1st IEEE International Conference on Data Mining- ICDM, (2001), 179- 186.
- Hathaway, R.J Davenport, J.W. and Bezdek, J.C., Relational duals of the c-means clustering algorithms, Pattern Recognition, 22, (1989), 205-212.
- Hathaway, R. J. and Bezdek, James C., Nerf c-means: Non-Euclidean relational fuzzy clustering, Pattern Recognition, 27, (1994), 429-437.
- Hofmann, T., Schölkopf, B., and Smola, A. J., ‘Kernel methods in machine learning’, Annals of Statistics 36 (3), (2008), 1171—1220.
- Hu, Z., Bodyanskiy, Y. V., Tyshchenko, O. K. and Samitova, V. O.: Fuzzy Clustering Data Given in the Ordinal Scale, IJISA, vol. 9, no. 1, (2017), pp. 67-74.
- Jayaram Reddy, A. and Tripathy, B.K.: Covering Rough Set Fuzzy C- Medoids (Crfm) Clustering Algorithm For Gene Expression Data, Journal of Advanced Research in Dynamical and Control Systems, vol.9, sp-14, (2017), pp.1702-1714.
- Hu, Z., Bodyanskiy, Y. V., Tyshchenko, O. K. and Tkachov, V. M.: Fuzzy Clustering Data Arrays with Omitted Observations, IJISA, vol. 9, no. 6, (2017), pp. 24-32.
- Kalaiselvi, T., Kalaichelvi, N. and Sriramakrishnan, P.: Automatic Brain Tissues Segmentation based on Self Initializing K-Means Clustering Technique, IJISA, vol. 9, no. 11, (2017), pp.52-61.
- Kaufman, L. and Rousseeuw, P.J., Clustering by means of Medoids, in Statistical Data Analysis Based on the L1–Norm and Related Methods, edited by Y. Dodge, North-Holland,(1987), 405–416.
- Kaufman, L. and Rousseeuw, P.J., Finding Groups in Data: An Introduction to Cluster Analysis, Wiley, New York, (1990).
- Kumar, P., Radha Krishna, P., Bapi, R. S., and De, S.K., Rough clustering of sequential data, Data Knowledge Engineering, 63, (2007), 183-199.
- Libert, G. and Roubens, M., Non-metric fuzzy clustering algorithms and their cluster validity, In Fuzzy Information and Decision processes, (Edited by M. Gupta and E. Sanchez), (1982), 417-425, New York.
- Lodhi, H., Saunders, C., Taylor, J. S. and Cristianini, N., Text Classification using String Kernels , Journal of Machine Learning Research 2 (2002), 419-444.
- Machler, M., P. Rousseeuw, A. Struyf, M. Hubert and K. Hornik: Cluster: Cluster Analysis Basics and Extensions, (2012), https://www.researchgate.net/publication/ 272176869_Cluster_Cluster_Analysis_Basics_and_Extensions.
- Maji, P., and Pal, S. K., RFCM: A hybrid clustering algorithm using rough and fuzzy sets, Fundamenta Informaticae, 80 (4), (2007), 475-496.
- Mitra, S., Banka, H., and Pedrycz, W., Rough and Fuzzy Collaborative Clustering, IEEE Transactions on Systems, Man and Cybernetics, Part B (Cybernetics) 36 (4), (2006), 795-805.
- P. Prabhavathy, B.K.Tripathy: Sequential clustering: A Study on Covering Based Rough Set Theory, Research Journal of Pharmaceutical, Biological and Chemical Sciences, Volume 7, Issue 2, 2016, pp. 1799-1807
- Prabhavathy, P. and Tripathy, B. K.: Covering rough clustering approach for unstructured activity analysis, International Journal of Intelligent Information Technologies, Volume 12, Issue 2, April-June 2016, pp. 1- 11.
- Roubens, M., Pattern classification problems with fuzzy sets, Fuzzy sets and systems, 1 (1978), 239-253
- Rousseeuw, P.J. Silhouettes: A graphical aid to the interpretation and validation of cluster analysis. J. Comp. Appl. Math., 20, (1987), 53–65.
- Rui, X. and Wunch, D., Clustering, Wiley, IEEE Press, (2009).
- Ruspini, E. H., A New Approach to Clustering, Information and Control, 15, (1969), 22-32
- Ruspini, E. H., Numerical Methods for fuzzy clustering, Information Sciences, 2, 319 – 350
- Ruspini, E. H., New experimental results in fuzzy clustering, Information Sciences, 6, (1973), 273 -284.
- Sandhu, S.S., Jadhav, A. R. and Tripathy, B.K.: Comparison of centroid-based clustering algorithms in the context of divide and conquer paradigm based FMST framework, IEEE proceedings of ICRCICN 2017, (2017), pp.219-224.
- Seetha, H., Tripathy, B.K. and Murthy, M. K.: Modern Technologies for Big Data Classification and Clustering, IGI Edited volume, ISBN-10: 1522528059, (2017).
- Swarnalatha, P. and Tripathy, B.K.: A Comparative analysis of Depth computation of Leukemia Images using a refined Bit Plane and Uncertainty based clustering Techniques, Cybernetics and Information Technologies, vol.15, no.1,(2015), pp.126- 146
- Tripathy, B.K. and Swarnalatha, P.: A Comparative Study of RIFCM with Other Related Algorithms from Their Suitability in Analysis of Satellite Images using Other Supporting Techniques, Kybernetes, vol.43, no.1,(2014), pp. 53-81
- Tripathy, B.K. and P. Prabhavathy: An Integrated Covering based Rough Fuzzy set Clustering Approach for Sequential data, International Journal of Reasoning based Intelligent Systems, vol.7, issues 3-4, (2015), pp.296-304.
- Tripathy, B.K., Goyal, A., Chowdhury, R. and Patra, A. S.: MMeMeR: An Algorithm for Clustering Heterogeneous Data using Rough Set Theory, I.J. Intelligent Systems and Applications, (2017), vol.9 (8), pp. 25-33
- Tripathy, B.K., and Sharmila Banu, K.: Soft Computing Techniques for Categorical Data Analysis on Bio-informatics, International journal of Pharma and Bio-informatics, vol.6, issue 4, (2015), pp.642-646.
- Yang, M. S. and Yu, K. F., On stochastic convergence theorems for the fuzzy c-means clustering procedure, Int. J. general Systems, 16 (1990), 397-411.
- Yang, M. S. and Yu, K. F., On existence and strong consistency of a class of fuzzy c-means clustering procedure, Cybernetics and Systems, 23 (1992), 583-602.
- Yang, M. S., On asymptotic normality of a class of fuzzy c-means clustering procedure
- Zadeh, L. A., Fuzzy Sets, Information and Control, 8, (1965), 338 – 353.
- Zimmermann, H. J., Fuzzy set theory and its applications, Boston, Kluwer Academic Publishers, (1991).
