Fuzzy Logic Based Power System Contingency Ranking

Author: A. Y. Abdelaziz, A. T. M. Taha, M. A. Mostafa, A. M. Hassan
Journal: International Journal of Intelligent Systems and Applications(IJISA) @ijisa
Article in issue: 3 vol.5, 2013.
Free access
Voltage stability is a major concern in planning and operations of power systems. It is well known that voltage instability and collapse have led to major system failures. Modern transmission networks are more heavily loaded than ever before to meet the growing demand. One of the major consequences resulted from such a stressed system is voltage collapse or instability. This paper presents maximum loadability identification of a load bus in a power transmission network. In this study, Fast Voltage Stability Index (FVSI) is utilized as the indicator of the maximum loadability termed as Qmax. In this technique, reactive power loading will be increased gradually at particular load bus until the FVSI reaches close to unity. Therefore, a critical value of FVSI was set as the maximum loadability point. This value ensures the system from entering voltage-collapse region. The main purpose in the maximum loadability assessment is to plan for the maximum allowable load value to avoid voltage collapse; which is important in power system planning risk assessment. The most important task in security analysis is the problem of identifying the critical contingencies from a large list of credible contingencies and ranks them according to their severity. The condition of voltage stability in a power system can be characterized by the use of voltage stability indices. This paper presents fuzzy approach for ranking the contingencies using composite-index based on parallel operated fuzzy inference engine. The Line Flow index (L.F) and bus Voltage Magnitude (VM) of the load buses are expressed in fuzzy set notation. Further, they are evaluated using Fuzzy rules to obtain overall Criticality Index. Contingencies are ranked based on decreasing order of Criticality Index and then provides the comparison of ranking obtained with FVSI method.
Contingency Ranking, Fuzzy Sets, Line Flow Index, FVSI, Criticality Index
Short address: https://sciup.org/15010379
IDR: 15010379
Text of the scientific article Fuzzy Logic Based Power System Contingency Ranking
Published Online February 2013 in MECS
Voltage stability has been identified as a crucial issue in power system study and one of the causes that lead to cascading power system blackout in many parts of the world. This phenomenon has made this subject a very relevant issue in power system planning and operation. There are many incidents of power system blackouts, due to voltage collapse, as reported in [1-3]. Thus, it is very important to know the maximum permissible loading of a system so that it can be operated with an adequate voltage stability margin to prevent voltage collapse. Due to the fact that many systems have not expanded their transmission and generation capacity in recent years, many utilities are operating closer to their maximum capacity. For a system with smaller margin, more contingencies are considered as severe contingencies, and the system is exposed to more frequent voltage collapses [4]. Many power systems are now experiencing voltage problems more frequently and voltage studies have gained increasing attention from operating and planning points of views. It is vital, then, for the electric utility planners and operators to know the impact of every contingency on the voltage profile. Ranking all possible contingencies based on their impact on the system voltage profile will help the operators in choosing the most suitable remedial actions before the system moves toward voltage collapse. To maintain the system reliability, it is desirable to study the impact of the contingency on the power system, and to categorize them based on their severities. The change in loading margin to voltage collapse when line outages occur is estimated, a nose curve is computed by continuation to obtain a nominal loading margin. Then linear and quadratic sensitivities of the loading margin to each contingency are computed and used to estimate the resulting change in the loading margin [5]. A Fuzzy Set theory based algorithm is used to identify the weak buses in a power system. Bus voltage and reactive power loss at that bus are represented by membership functions for voltage stability study [6]. Newton optimal power flow is used to identify the weakest bus / area, which is likely to cause voltage collapse. The complex power – voltage curve is examined through Newton optimal power flow. The indicator, which identifies the weakest bus, was obtained by integrating all the marginal costs via Kuhn-Tucker theorem [7]. A Fast Voltage Stability Index is used to estimate the maximum loadability for identification of weak bus. The indicator is derived from the voltage quadratic equation at the receiving bus in a two bus system. The load of a bus, which is to be ranked is increased till maximum value of FVSI is reached and this load value is used as an indicator for ranking the bus [8]. A weak bus-oriented criterion is used to determine the candidate buses for installing new VAR sources in VAR planning problem. Two indices are used to identify weak buses based on power flow Jacobian matrix calculated at the current operating point of the system [9]. A neural network method for the identification of voltage weak buses/areas uses singular value decomposition method. Kohonen neural network is trained to cluster/rank buses in terms of voltage stability [10].
In this paper, analysis of voltage behavior has been approached using static techniques, which have been widely used on voltage stability analysis. An accurate knowledge of how close the actual system’s operating point is from the voltage stability limit is crucial to operators. Therefore, to find a voltage stability index has become an important task for many voltage stability studies. These indices provide reliable information about proximity of voltage instability in a power system.
Vb^BllS 1
Usually, their values change between 0 (no load) and 1 (voltage collapse).
Firstly, FVSI was utilized as the measurement to indicate the voltage stability condition in the maximum loadability identification at several load buses, then Fuzzy logic based algorithm for contingencies ranking is presented. Hence the L.F index and FVSI are used as a static voltage collapse proximity indicators. In order to evaluate the fuzzy logic based algorithm, so results obtained will be compared with FVSI results. The results of contingency analysis and maximum loadability can be used as a guide for controlling and planning of power systems. The approach is tested on IEEE 14 and 30 bus test systems.
-
II. Static Voltage Stability Indicators2.1 Fast Voltage Stability Index (FVSI)
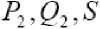
Voltage stability index proposed by I.Musirin et al. [11] can be conducted on a system by evaluating the voltage stability referred to a line. The voltage stability index referred to a line is formulated from the 2-bus representation of a system. The voltage stability index developed is derived by first obtaining the current equation through a line in a 2-bus system. Representation of the system illustrated in Fig. 1
V2<8 Bus 2
^1 : 51 : ^1
R+jX *
-
Fig . 1: 2- bus system model
FVSI ij
4 • Z 2 • Q j Vi 2 • X
each line of the system and they are based on the concept of maximum power transferred through a line as shown in Fig. 2.
Where,
Z: line impedance
X: line reactance
Q j : reactive power at the receiving end
Vi: sending end voltage
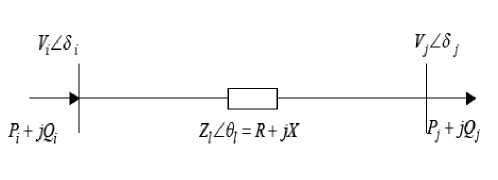
Fig. 2: A transmission line of a power system network
-
2.2 Line Flow Index (L.F)
The Line Flow (L.F) index proposed by
M.Moghavvemi et al. [12] investigates the stability of
P
-
L. Findex =------ p
R ( MAX )
Where the value of P R is obtained from conventional power flow calculations, and P R(max) is the maximum active that can be transferred through a line. The Line Flow index varies from 0 (no load condition) to 1 (voltage collapse).
р =
R ( MAX )
V
V T cos ф A 1 2 Z , JV1 + cos( S i - Ф).)
Where V i is the voltage magnitude of sending bus of branch i-j, Zl and θ l are the magnitude and angle of branch impedance respectively , Ф = arctan (Q j / P j )
-
III. Determination of Max. Laudability
-
3.1 IEEE-14 case study
Maximum loadability identification is important part of the power systems study. It is conducted in power transmission system in order to identify the maximum permissible load that can be sustained by a load bus. Two reliability test system IEEE 14-Bus and IEEE 30-Bus [13] were utilized for this test which involved experiment on several load buses in both test system.
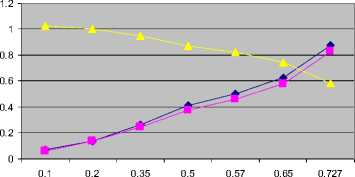
In the IEEE 14; three load buses were chosen namely buses 5, 12 and 14 for the tests. These buses were selected mainly due to the types of transmission lines that were connected to them. First, bus 5 was chosen because it represented the few buses connecting the main transmission lines (including the voltage-controlled buses and slack bus) in the system and buses 12 and 14 were chosen randomly among the load buses (distribution buses). Tests were conducted by gradually increasing the reactive power loading at selected bus and the FVSI values for line connected to this bus was calculated accordingly. The reactive power loading at the selected bus was increased in stages until it reaches its voltage stability limit indicated by FVSI value close to unity. The results for the FVSI values and voltage magnitude recorded.
From the table 1, it is observed that the FVSI values at the connecting lines increase accordingly as the reactive power loading at bus 5 was gradually increased. It can be seen that at the maximum reactive power loading of 2.6 p.u., the FVSI values for lines 2, 5, 7 and 10 reach their maximum values of 0.8836, 0.7815, 0.3345 and 0.1363 respectively. At this point, line 2 gives the highest FVSI value of 0.8836. This indicates that this line is close to its voltage stability limit. Further increase in reactive power loading at bus 5 would cause the FVSI value at line 2 to exceed unity. This implies that the line has reached its unstable condition, which may lead to voltage collapse to the entire system. The maximum value of reactive power loading is identified as the maximum loadability of this load bus. Bus 5 is expected to operate at the loading condition less than this point so that secure operation could be maintained. The increase in the reactive power loading at bus 5 has also reduced its voltage to 0.62791p.u. as indicated in the table. The trend of FVSI values at each line connected to bus 5 and the voltage magnitude when reactive power loading at this bus was increased is illustrated in Fig. 3. From the figure, it is observed that FVSI profiles increase accordingly with respect to the reactive power loading increment. On the other hand, voltage reduces with respect to the increment of loading condition. It is also observed that line 2 has the highest FVSI profile indicating the sensitive line
Table 1: Results for FVSI values at the lines connected to bus 5 and voltage magnitude with respect to the increase reactive in power loading
|
Line No. |
Q(p.u) |
Line |
FVSI |
Voltage (p.u) |
|
2 |
0.75 |
1-5 |
0.142 |
0.97588 |
|
10 |
0.75 |
6-5 |
0.0194 |
|
|
5 |
0.75 |
2-5 |
0.138 |
|
|
7 |
0.75 |
4-5 |
0.078 |
|
|
2 |
1.25 |
1-5 |
0.325 |
0.92015 |
|
10 |
1.25 |
6-5 |
0.0186 |
|
|
5 |
1.25 |
2-5 |
0.295 |
|
|
7 |
1.25 |
4-5 |
0.113 |
|
|
2 |
1.72 |
1-5 |
0.5 |
0.85764 |
|
10 |
1.72 |
6-5 |
0.0212 |
|
|
5 |
1.72 |
2-5 |
0.389 |
|
|
7 |
1.72 |
4-5 |
0.155 |
|
|
2 |
2 |
1-5 |
0.6089 |
0.81238 |
|
10 |
2 |
6-5 |
0.0267 |
|
|
5 |
2 |
2-5 |
0.4785 |
|
|
7 |
2 |
4-5 |
0.1883 |
|
|
2 |
2.3 |
1-5 |
0.7307 |
0.75047 |
|
10 |
2.3 |
6-5 |
0.0423 |
|
|
5 |
2.3 |
2-5 |
0.5921 |
|
|
7 |
2.3 |
4-5 |
0.2351 |
|
|
2 |
2.6 |
1-5 |
0.8836 |
0.62791 |
|
10 |
2.6 |
6-5 |
0.1363 |
|
|
5 |
2.6 |
2-5 |
0.7815 |
|
|
7 |
2.6 |
4-5 |
0.3345 |

FVSI (Line2)
FVSI (Line10)
FVSI (Line5)
FVSI (Line7)
V5
Reactive power (p.u)
Fig. 3: Effect of Q variation at bus 5 to voltage profile and FVSI evaluated on the lines connected to bus 5
Table 2: Results for FVSI values at the lines connected to bus 12 and voltage magnitude with respect to the increase reactive in power loading
|
Line No. |
Q(p.u) |
Line |
FVSI |
Voltage (p.u) |
|
12 |
0.2 |
6-12 |
0.1485 |
1.0154 |
|
19 |
0.2 |
13-12 |
0.1147 |
|
|
12 |
0.35 |
6-12 |
0.2626 |
0.95606 |
|
19 |
0.35 |
13-12 |
0.2421 |
|
|
12 |
0.45 |
6-12 |
0.3532 |
0.90617 |
|
19 |
0.45 |
13-12 |
0.3446 |
|
|
12 |
0.565 |
6-12 |
0.4876 |
0.8275 |
|
19 |
0.565 |
13-12 |
0.5 |
|
|
12 |
0.65 |
6-12 |
0.6278 |
0.74505 |
|
19 |
0.65 |
13-12 |
0.6721 |
|
|
12 |
0.715 |
6-12 |
0.8646 |
0.60021 |
|
19 |
0.715 |
13-12 |
0.9881 |
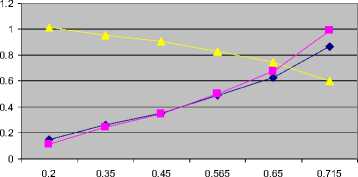
The trend of FVSI values at each line connected to bus 12 and the voltage magnitude when reactive power loading at this bus was increased is illustrated in Fig. 4
Reactive power (p.u)
Fig. 4: Effect of Q variation at bus 12 to voltage profile and FVSI evaluated on the lines connected to bus 12
Table 3: Results for FVSI values at the lines connected to bus 14 and voltage magnitude with respect to the increase reactive in power loading
|
Line No. |
Q(p.u) |
Line |
FVSI |
Voltage (p.u) |
|
17 |
0.1 |
9-14 |
0.072 |
1.025 |
|
20 |
0.1 |
13-14 |
0.062 |
|
|
17 |
0.2 |
9-14 |
0.138 |
1.0031 |
|
20 |
0.2 |
13-14 |
0.136 |
|
|
17 |
0.35 |
9-14 |
0.262 |
0.94834 |
|
20 |
0.35 |
13-14 |
0.242 |
|
|
17 |
0.5 |
9-14 |
0.4121 |
0.87134 |
|
20 |
0.5 |
13-14 |
0.3759 |
|
|
17 |
0.57 |
9-14 |
0.5 |
0.82192 |
|
20 |
0.57 |
13-14 |
0.457 |
|
|
17 |
0.65 |
9-14 |
0.6274 |
0.74853 |
|
20 |
0.65 |
13-14 |
0.5769 |
|
|
17 |
0.727 |
9-14 |
0.88034 |
0.58707 |
|
20 |
0.727 |
13-14 |
0.8288 |
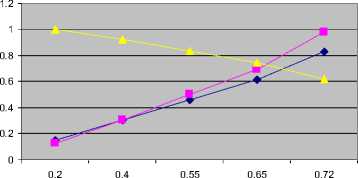
The trend of FVSI values at each line connected to bus 14 and the voltage magnitude when reactive power loading at this bus was increased is illustrated in Fig. 5
—♦- FVSI (Line 17)
■ FVSI (Line20)
V14
Reactive power (p.u)
Fig. 5: Effect of Q variation at bus 14 to voltage profile and FVSI evaluated on the lines connected to bus 14
-
3.2 IEEE-30 case study
In the IEEE 30; four load buses were chosen namely buses 4, 14, 24 and 30 for the tests. Tests were conducted by gradually increasing the reactive power loading at selected bus and the FVSI values for line connected to this bus was calculated accordingly. The reactive power loading at the selected bus was increased in stages until it reaches its voltage stability limit indicated by FVSI value close to unity. The results for the FVSI values and voltage magnitude recorded.
Table 4: Results for FVSI values at the lines connected to bus 4 and voltage magnitude with respect to the increase reactive in power loading
|
Line No. |
Q (p.u) |
Line |
FVSI |
Voltage (p.u) |
|
4 |
0.6 |
3-4 |
0.02 |
0.97675 |
|
3 |
0.6 |
2-4 |
0.1208 |
|
|
7 |
0.6 |
6-4 |
0.0676 |
|
|
15 |
0.6 |
12-4 |
0.0446 |
|
|
4 |
1 |
3-4 |
0.0542 |
0.93596 |
|
3 |
1 |
2-4 |
0.212 |
|
|
7 |
1 |
6-4 |
0.0912 |
|
|
15 |
1 |
12-4 |
0.0346 |
|
|
4 |
2 |
3-4 |
0.1883 |
0.79208 |
|
3 |
2 |
2-4 |
0.5 |
|
|
7 |
2 |
6-4 |
0.1764 |
|
|
15 |
2 |
12-4 |
0.0598 |
|
|
4 |
2.2 |
3-4 |
0.2351 |
0.74672 |
|
3 |
2.2 |
2-4 |
0.5889 |
|
|
7 |
2.2 |
6-4 |
0.2045 |
|
|
15 |
2.2 |
12-4 |
0.0814 |
|
|
4 |
2.43 |
3-4 |
0.3496 |
0.64364 |
|
3 |
2.43 |
2-4 |
0.7501 |
|
|
7 |
2.43 |
6-4 |
0.2651 |
|
|
15 |
2.43 |
12-4 |
0.1966 |
From the table 4, it is observed that the FVSI values at the connecting lines increase accordingly as the reactive power loading at bus 4 was gradually increased. It can be seen that at the maximum reactive power loading of 2.43 p.u., the FVSI values for lines 3, 4, 7 and 15 reach their maximum values of 0.7501, 0.3496, 0.2651 and 0.1966 respectively. At this point, line 3 gives the highest FVSI value of 0.7501 this indicates that this line is close to its voltage stability limit. Further increase in reactive power loading at bus 4 would cause the FVSI value at line 3 to exceed unity. This implies that the line has reached its unstable condition, which may lead to voltage collapse to the entire system. The maximum value of reactive power loading is identified as the maximum loadability of this load bus. Bus 4 is expected to operate at the loading condition less than this point so that secure operation could be maintained. The increase in the reactive power loading at bus 4 has also reduced its voltage to 0.64364 p.u. as indicated in the table. The trend of FVSI values at each line connected to bus 11and the voltage magnitude when reactive power loading at this bus was increased is illustrated in Fig. 6. From the figure, it is observed that FVSI profiles increase accordingly with respect to the reactive power loading increment. On the other hand, voltage reduces with respect to the increment of loading condition. It is also observed that line 3 has the highest FVSI profile indicating the sensitive line.
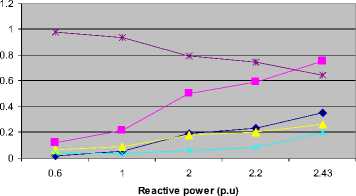
—♦- FVSI (Line4)
■ FVSI (Line3)
FVSI (Line7)
FVSI (Line15)
V4
Fig. 6: Effect of Q variation at bus 4 to voltage profile and FVSI evaluated on the lines connected to bus 4
Table 5: Results for FVSI values at the lines connected to bus 14 and voltage magnitude with respect to the increase reactive in power loading
|
Line No. |
Q (p.u) |
Line |
FVSI |
Voltage (p.u) |
|
17 |
0.2 |
12-14 |
0.148 |
1.003 |
|
20 |
0.2 |
15-14 |
0.1238 |
|
|
17 |
0.4 |
12-14 |
0.3023 |
0.92612 |
|
20 |
0.4 |
15-14 |
0.3067 |
|
|
17 |
0.55 |
12-14 |
0.4618 |
0.83414 |
|
20 |
0.55 |
15-14 |
0.5 |
|
|
17 |
0.65 |
12-14 |
0.6149 |
0.74576 |
|
20 |
0.65 |
15-14 |
0.694 |
|
|
17 |
0.72 |
12-14 |
0.8285 |
0.61831 |
|
20 |
0.72 |
15-14 |
0.9805 |
The trend of FVSI values at each line connected to bus 14 and the voltage magnitude when reactive power loading at this bus was increased is illustrated in Fig. 7.
-♦- FVSI (Line17)
■ FVSI (Line20)
V14
Reactive power (p.u)
Fig. 7: Effect of Q variation at bus 14 to voltage profile and FVSI evaluated on the lines connected to bus 14
Table 6: Results for FVSI values at the lines connected to bus 24 and voltage magnitude with respect to the increase reactive in power loading
|
Line No. |
Q (p.u) |
Line |
FVSI |
Voltage (p.u) |
|
31 |
0.4 |
22-24 |
0.2131 |
0.93672 |
|
32 |
0.4 |
23-24 |
0.1583 |
|
|
33 |
0.4 |
25-24 |
0.09 |
|
|
31 |
0.55 |
22-24 |
0.331 |
0.86083 |
|
32 |
0.55 |
23-24 |
0.2449 |
|
|
33 |
0.55 |
25-24 |
0.1839 |
|
|
31 |
0.695 |
22-24 |
0.5 |
0.75775 |
|
32 |
0.695 |
23-24 |
0.3719 |
|
|
33 |
0.695 |
25-24 |
0.3216 |
|
|
31 |
0.75 |
22-24 |
0.6 |
0.69597 |
|
32 |
0.75 |
23-24 |
0.4533 |
|
|
33 |
0.75 |
25-24 |
0.4099 |
|
|
31 |
0.79 |
22-24 |
0.7831 |
0.58687 |
|
32 |
0.79 |
23-24 |
0.6067 |
|
|
33 |
0.79 |
25-24 |
0.567 |
The trend of FVSI values at each line connected to bus 24 and the voltage magnitude when reactive power loading at this bus was increased is illustrated in Fig. 8.
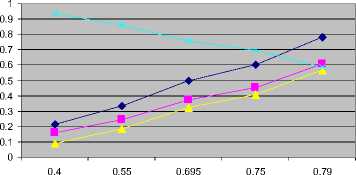
—♦-FVSI (Line31)
—■ FVSI (Line32)
FVSI (Line33)
V24
Reactive power (p.u)
Fig. 8: Effect of Q variation at bus 24 to voltage profile and FVSI evaluated on the lines connected to bus 24
Table 7: Results for FVSI values at the lines connected to bus 30 and voltage magnitude with respect to the increase reactive in power loading
|
Line No. |
Q (p.u) |
Line |
FVSI |
Voltage (p.u) |
|
38 |
0.05 |
27-30 |
0.0959 |
0.97 |
|
39 |
0.05 |
29-30 |
0.0431 |
|
|
38 |
0.15 |
27-30 |
0.3 |
0.88641 |
|
39 |
0.15 |
29-30 |
0.1597 |
|
|
38 |
0.235 |
27-30 |
0.5 |
0.79213 |
|
39 |
0.235 |
29-30 |
0.2968 |
|
|
38 |
0.3 |
27-30 |
0.7282 |
0.68139 |
|
39 |
0.3 |
29-30 |
0.4661 |
|
|
38 |
0.326 |
27-30 |
0.9408 |
0.54206 |
|
39 |
0.326 |
29-30 |
0.6808 |
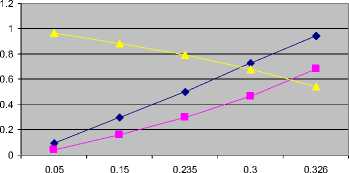
The trend of FVSI values at each line connected to bus 30 and the voltage magnitude when reactive power loading at this bus was increased is illustrated in Fig. 9.
—♦- FVSI (Line38)
■ FVSI (Line39) v30
Reactive power (p.u)
Fig. 9: Effect of Q variation at bus 30 to voltage profile and FVSI evaluated on the lines connected to bus 30
-
IV. Fuzzy Inference System
In this formulation, L.F index values, which are linearly normalized into a [0,1] range with the largest (L.F) having a value of 1 and the smallest having a value of 0, along with load bus Voltage magnitudes are the inputs to the fuzzy system that determines the severity indices of line flow and voltage profile by fuzzy inferencing. In fuzzy logic based approaches, the decisions are made by forming a series of rules that relate the input variables to the output variables using if-then statements. A set of multiple-antecedent fuzzy rules are established for determining the severity index of voltage profile (SI VP ) and severity index for line flow (SIL.F), the input to the rules (L.F) and (VM) and the output consequent is (SIL.F) and (SIVP) respectively. The rules are summarized in the fuzzy decision matrix in table 8. Having related the input variables to the output variable, the fuzzy results are defuzzified through what is called a defuzzification process, to achieve a crisp numerical value. The most commonly used centroid or centre of gravity defuzzification strategy [14, 15] is adopted. The fuzzy inference structure is tested in MATLAB R2008a fuzzy toolbox. The ranking obtained using fuzzy approach is verified with (FVSI).
-
4.1 Bus voltage profiles (selected Fuzzy input)
-
4.2 Line Flow Index (selected Fuzzy input)
The voltage profile at load buses is described using the linguistic variables as Low Voltage (LV), Normal Voltage (NV) and Over Voltage (OV) as shown in Fig. 10.
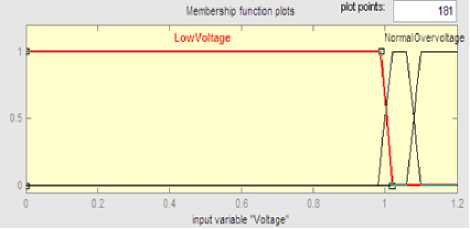
Fig. 10: Voltage profiles membership function
The Line Flow index is divided into five categories using Fuzzy Set notations: Very Small (VS), Small (S), Medium (M), High (H) and Very High (VH) as shown in Fig. 11.
Fig. 12 and Fig. 13 show membership function chosen for linguistic output variables.
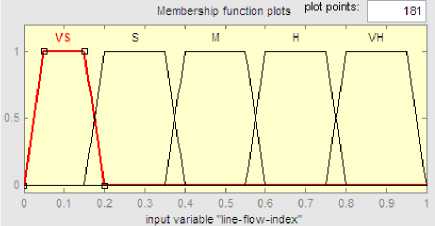
Fig. 11: Line flow index membership function
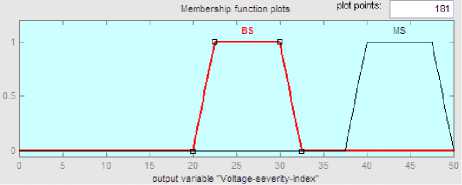
Fig. 12: Severity index for voltage profile
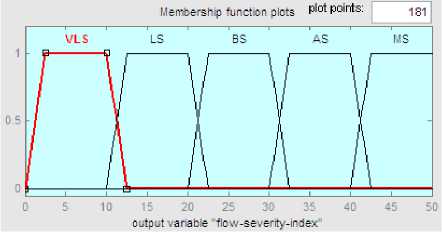
Fig. 13: Severity index for Line Flow
-
4.3 Fuzzy Rules
-
4.4 Fuzzy output (Composite Index)
The fuzzy rules, which are used for evaluation of severity indices of bus voltage profiles and line flow indices, are given in table 8.
Table 8: Fuzzy rules
|
Input Variable |
Output Variable |
|
Voltage |
SI VP |
|
LV NV OV |
MS BS MS |
|
L.F index |
SI L.F |
|
VS S M H VH |
VLS LS BS AS MS |
Where,
VLS: Very Low Severe, LS: Low Severe, BS: Below Severe, AS: Above Severe, MS: More Severe.
The overall severity index (Composite index) for a particular line outage is given by CI = ΣSI LF + ΣSI vp [16] as shown in Fig. 14; Where, ΣSI LF is the severity index of all Line flow index and ΣSI vp is severity index of all load bus voltage profiles for selected contingencies. Thus, the overall severity index indicates the actual severity of the system for a contingency.
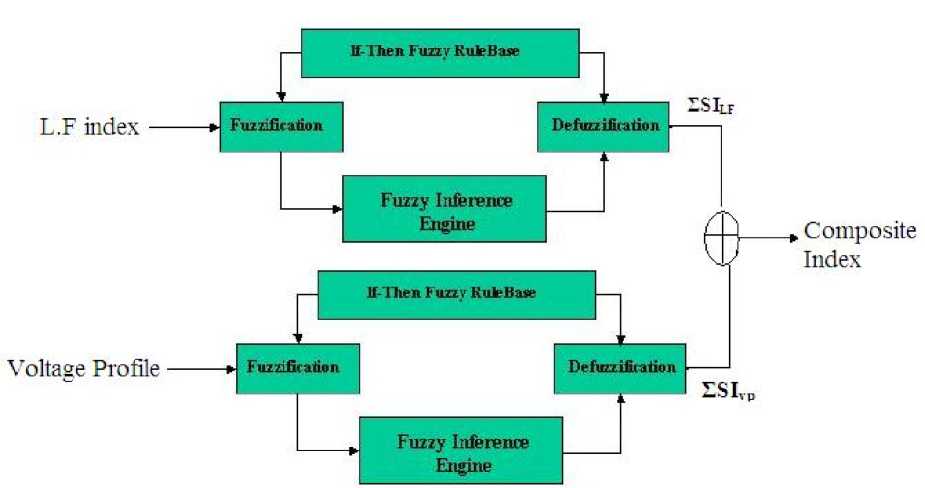
Fig. 14: Fuzzy output (Composite Index)
-
V. Simulation Results5.1 IEEE-14 bus system
The fuzzy logic approach is tested on IEEE-14 bus system. The line outages considered for ranking are listed in table 9 .
Table 9: List of selected Contingencies
|
Contingency No. |
Type of Contingency |
From |
to |
|
1 |
Line Outage |
10 |
11 |
|
2 |
Line Outage |
4 |
9 |
|
3 |
Line Outage |
5 |
6 |
|
4 |
Line Outage |
12 |
13 |
|
5 |
Double Line outage |
9 |
10 |
|
13 |
14 |
Contingency No.1 analysis:
Tables 10 and table 11 show severity index for voltage profiles and line flow index calculated using fuzzy rules
ΣSIvp = 241.7
Table 10: Severity indices for voltage profiles
|
Bus No. |
Voltage (p.u) |
SI vp |
|
Bus 4 |
1.0169 |
28.3 |
|
Bus 5 |
1.0193 |
27.6 |
|
Bus 7 |
1.0596 |
26.3 |
|
Bus 9 |
1.0524 |
26.3 |
|
Bus 10 |
1.0449 |
26.3 |
|
Bus 11 |
1.0635 |
28 |
|
Bus 12 |
1.055 |
26.3 |
|
Bus 13 |
1.0497 |
26.3 |
|
Bus 14 |
1.0332 |
26.3 |
Table 11: Severity Indices for L.F index
|
Line |
From |
to |
L.F index |
SI LF |
|
1 |
1 |
2 |
0.195553 |
15.3 |
|
2 |
1 |
5 |
0.358289 |
18 |
|
3 |
2 |
3 |
0.320033 |
16.3 |
|
4 |
2 |
4 |
0.235641 |
|
|
5 |
2 |
5 |
0.185067 |
13.2 |
|
6 |
4 |
3 |
0.097943 |
6.25 |
|
7 |
5 |
4 |
0.059059 |
6.25 |
|
8 |
4 |
7 |
0.083447 |
6.25 |
|
9 |
4 |
9 |
0.168847 |
10.1 |
|
10 |
5 |
6 |
0.246067 |
16.3 |
|
11 |
6 |
11 |
0.027215 |
6.25 |
|
12 |
6 |
12 |
0.068677 |
6.25 |
|
13 |
6 |
13 |
0.08762 |
6.25 |
|
15 |
7 |
9 |
0.072067 |
6.25 |
|
16 |
9 |
10 |
0.031477 |
6.25 |
|
17 |
9 |
14 |
0.08226 |
6.25 |
|
19 |
12 |
13 |
0.020885 |
6.25 |
|
20 |
13 |
14 |
0.081216 |
6.25 |
ΣSI LF = 174.25
CI = ΣSI LF + ΣSI vp = 415.95
Contingency No.2 analysis
Table 12 and table 13 shows severity index for voltage profiles and line flow index calculated using fuzzy rules shown in table 8.
ΣSIvp = 239.5
Table 12: Severity indices for voltage profiles
|
Bus No. |
Voltage (p.u) |
SI vp |
|
Bus 4 |
1.0171 |
28.2 |
|
Bus 5 |
1.0186 |
27.2 |
|
Bus 7 |
1.0599 |
26.3 |
|
Bus 9 |
1.0538 |
26.3 |
|
Bus 10 |
1.049 |
26.3 |
|
Bus 11 |
1.0557 |
26.3 |
|
Bus 12 |
1.0552 |
26.3 |
|
Bus 13 |
1.0499 |
26.3 |
|
Bus 14 |
1.034 |
26.3 |
Table 13: Severity Indices for L.F index
|
Line |
From |
to |
L.F index |
SI LF |
|
1 |
1 |
2 |
0.19507 |
15.2 |
|
2 |
1 |
5 |
0.36104 |
18.6 |
|
3 |
2 |
3 |
0.31879 |
16.3 |
|
4 |
2 |
4 |
0.23283 |
16.3 |
|
5 |
2 |
5 |
0.18877 |
13.9 |
|
6 |
4 |
3 |
0.0996 |
6.25 |
|
7 |
5 |
4 |
0.052 |
6.25 |
|
8 |
4 |
7 |
0.11649 |
6.25 |
|
10 |
5 |
6 |
0.27828 |
16.3 |
|
11 |
6 |
11 |
0.06843 |
6.25 |
|
12 |
6 |
12 |
0.0688 |
6.25 |
|
13 |
6 |
13 |
0.08833 |
6.25 |
|
15 |
7 |
9 |
0.08634 |
6.25 |
|
16 |
9 |
10 |
0.01814 |
6.25 |
|
17 |
9 |
14 |
0.08144 |
6.25 |
|
18 |
11 |
10 |
0.03931 |
6.25 |
|
19 |
12 |
13 |
0.02133 |
6.25 |
|
20 |
13 |
14 |
0.08371 |
6.25 |
ΣSI LF = 171.6
CI = ΣSI LF + ΣSI vp = 411.1
Contingency No.3 analysis
ΣSI vp =275.6
ΣSI LF = 183.98
CI = ΣSI LF + ΣSI vp = 459.58
Contingency No.4 analysis
ΣSI vp =239.3
ΣSI LF = 171.66
CI = ΣSI LF + ΣSI vp = 410.96
Contingency No.5 analysis
ΣSI vp =239.5
ΣSI LF = 164.36
CI = ΣSI LF + ΣSI vp = 403.86
-
5.2 IEEE-30 bus system
The fuzzy logic approach is tested on IEEE-30 bus system. The system consists of 6 generators, 2 shunt capacitors and 41 transmission lines. Contingency Screening is based on all the heavily loaded line, the line outages considered for ranking are listed in table 14
Table 14: List of selected Contingencies
|
Contingency No. |
Type of Contingency |
From |
to |
|
1 |
Line Outage |
2 |
5 |
|
2 |
Line Outage |
16 |
17 |
|
3 |
Line Outage |
5 |
7 |
|
4 |
Double Line outage |
8 |
28 |
|
6 |
28 |
||
|
5 |
Double Line outage |
14 |
15 |
|
18 |
19 |
Contingency No.1 analysis
Table 15 and table 16 shows severity index for voltage profiles and line flow index calculated using fuzzy rules
Table 15: Severity indices for voltage profiles
|
Bus No. |
Voltage (p.u) |
SI vp |
|
Bus3 |
0.99505 |
37.9 |
|
Bus4 |
0.98118 |
43.2 |
|
Bus6 |
0.97038 |
43.8 |
|
Bus7 |
0.92842 |
43.8 |
|
Bus9 |
1.0238 |
26.3 |
|
Bus10 |
1.0171 |
28.2 |
|
Bus12 |
1.0411 |
26.3 |
|
Bus14 |
1.0244 |
26.3 |
|
Bus15 |
1.0178 |
27.7 |
|
Bus16 |
1.0228 |
26.3 |
|
Bus17 |
1.0138 |
30.1 |
|
Bus18 |
1.0051 |
34.1 |
|
Bus19 |
1.0008 |
35.8 |
|
Bus20 |
1.004 |
34.5 |
|
Bus21 |
1.0043 |
34.4 |
|
Bus22 |
1.0049 |
34.2 |
|
Bus23 |
1.0034 |
34.8 |
|
Bus24 |
0.99286 |
38.7 |
|
Bus25 |
0.98311 |
42.3 |
|
Bus26 |
0.96479 |
43.8 |
|
Bus27 |
0.98594 |
41.1 |
|
Bus28 |
0.96758 |
43.8 |
|
Bus29 |
0.96527 |
43.8 |
|
Bus30 |
0.95331 |
43.8 |
ΣSI vp =865
Table 16: Severity Indices for LF index
|
From |
To |
L.F index |
SI LF |
|
1 |
2 |
0.212443 |
16.3 |
|
1 |
3 |
0.42102 |
26.3 |
|
2 |
4 |
0.338385 |
16.3 |
|
3 |
4 |
0.109873 |
6.25 |
|
2 |
6 |
0.433222 |
26.3 |
|
4 |
6 |
0.124829 |
6.25 |
|
7 |
5 |
0.323465 |
16.3 |
|
6 |
7 |
0.296271 |
16.3 |
|
6 |
8 |
0.027194 |
6.25 |
|
6 |
9 |
0.062973 |
6.25 |
|
6 |
10 |
0.137157 |
6.25 |
|
9 |
10 |
0.068137 |
6.25 |
|
4 |
12 |
0.269247 |
16.3 |
|
12 |
14 |
0.077079 |
6.25 |
|
12 |
15 |
0.100466 |
6.25 |
|
12 |
16 |
0.07644 |
6.25 |
|
14 |
15 |
0.026142 |
6.25 |
|
16 |
17 |
0.041595 |
6.25 |
|
15 |
18 |
0.059468 |
6.25 |
|
18 |
19 |
0.02022 |
6.25 |
|
20 |
19 |
0.01551 |
6.25 |
|
10 |
20 |
0.061961 |
6.25 |
|
10 |
17 |
0.01404 |
6.25 |
|
10 |
21 |
0.054117 |
6.25 |
|
10 |
22 |
0.051897 |
6.25 |
|
22 |
21 |
0.002316 |
6.25 |
|
15 |
23 |
0.060376 |
6.25 |
|
22 |
24 |
0.05018 |
6.25 |
|
23 |
24 |
0.044053 |
6.25 |
|
25 |
24 |
0.003431 |
6.25 |
|
25 |
26 |
0.076142 |
6.25 |
|
27 |
25 |
0.023568 |
6.25 |
|
28 |
27 |
0.169291 |
10.2 |
|
27 |
29 |
0.10137 |
6.25 |
|
27 |
30 |
0.161603 |
8.68 |
|
29 |
30 |
0.06504 |
6.25 |
|
28 |
8 |
0.004531 |
6.25 |
|
6 |
28 |
0.029831 |
6.25 |
ΣSI LF = 334.23
CI = ΣSI LF + ΣSI vp = 1199.23
Contingency No.2 analysis
Table 17 and table 18 shows severity index for voltage profiles and line flow index
Table 17: Severity indices for voltage profiles
|
Bus No. |
Voltage (p.u) |
SI vp |
|
Bus3 |
1.0209 |
26.3 |
|
Bus4 |
1.012 |
31 |
|
Bus6 |
1.0101 |
31.9 |
|
Bus7 |
1.0023 |
35.2 |
|
Bus9 |
1.0495 |
26.3 |
|
Bus10 |
1.0426 |
26.3 |
|
Bus12 |
1.0586 |
26.3 |
|
Bus14 |
1.0435 |
26.3 |
|
Bus15 |
1.0381 |
26.3 |
|
Bus16 |
1.0521 |
26.3 |
|
Bus17 |
1.035 |
26.3 |
|
Bus18 |
1.0275 |
26.3 |
|
Bus19 |
1.0244 |
26.3 |
|
Bus20 |
1.0281 |
26.3 |
|
Bus21 |
1.0304 |
26.3 |
|
Bus22 |
1.031 |
26.3 |
|
Bus23 |
1.0269 |
26.3 |
|
Bus24 |
1.0204 |
26.3 |
|
Bus25 |
1.0165 |
28.5 |
|
Bus26 |
0.99884 |
36.5 |
|
Bus27 |
1.0227 |
26.3 |
|
Bus28 |
1.0066 |
33.5 |
|
Bus29 |
1.0029 |
35 |
|
Bus30 |
0.99139 |
39.3 |
ΣSI vp =691.7
Contingency No.3 analysis
ΣSI vp =701.6
ΣSI LF = 310.55
CI = ΣSI LF + ΣSI vp = 1012.15
Contingency No.4 analysis
ΣSI vp =793
ΣSI LF = 314.15
CI = ΣSI LF + ΣSI vp = 1107.15
Contingency No.5 analysis
ΣSI vp =691.6
ΣSI LF = 299.75
CI = ΣSI LF + ΣSI vp = 991.35
Table 18: Severity Indices for LF index
|
From |
To |
L.F index |
SI LF |
|
1 |
2 |
0.210229 |
16.3 |
|
1 |
3 |
0.318498 |
16.3 |
|
2 |
4 |
0.202954 |
16.3 |
|
3 |
4 |
0.079472 |
6.25 |
|
2 |
5 |
0.345205 |
16.3 |
|
2 |
6 |
0.257821 |
16.3 |
|
4 |
6 |
0.066233 |
6.25 |
|
7 |
5 |
0.033011 |
6.25 |
|
6 |
7 |
0.079489 |
6.25 |
|
6 |
8 |
0.026472 |
6.25 |
|
6 |
9 |
0.085544 |
6.25 |
|
6 |
10 |
0.171276 |
10.5 |
|
9 |
10 |
0.07127 |
6.25 |
|
4 |
12 |
0.263275 |
16.3 |
|
12 |
14 |
0.070888 |
6.25 |
|
12 |
15 |
0.09048 |
6.25 |
|
12 |
16 |
0.027741 |
6.25 |
|
14 |
15 |
0.021505 |
6.25 |
|
15 |
18 |
0.052596 |
6.25 |
|
18 |
19 |
0.016665 |
6.25 |
|
20 |
19 |
0.016384 |
6.25 |
|
10 |
20 |
0.06362 |
6.25 |
|
10 |
17 |
0.032211 |
6.25 |
|
10 |
21 |
0.050409 |
6.25 |
|
10 |
22 |
0.047943 |
6.25 |
|
22 |
21 |
0.002559 |
6.25 |
|
15 |
23 |
0.048524 |
6.25 |
|
22 |
24 |
0.042711 |
6.25 |
|
23 |
24 |
0.029169 |
6.25 |
|
25 |
24 |
0.00975 |
6.25 |
|
25 |
26 |
0.071222 |
6.25 |
|
27 |
25 |
0.034026 |
6.25 |
|
28 |
27 |
0.175092 |
11.3 |
|
27 |
29 |
0.094104 |
6.25 |
|
27 |
30 |
0.150227 |
6.3 |
|
29 |
30 |
0.060236 |
6.25 |
|
8 |
28 |
0.004276 |
6.25 |
|
6 |
28 |
0.030325 |
6.25 |
ΣSI LF = 307.15
CI = ΣSI LF + ΣSI vp = 998.85
-
VI. Performance COMPARISON
In order to evaluate the fuzzy logic based algorithm, so results obtained will be compared with FVSI results by calculation of FVSI value for every line in the system using equation (1). Firstly the corresponding line which gives the highest FVSI must be identified. During these contingencies No. (1, 2, 3, 4, 5) at IEEE-14 bus case study, line connected between bus 7 to bus 8 demonstrates the highest FVSI with values 0.1084, 0.1074, 0.1298, 0.1022 and 0.0955 respectively.
At IEEE-30 bus case study, line connected between bus 9 to bus 11 demonstrates the highest FVSI with values 0.167, 0.1162, 0.1168, 0.1316 and 0.1139 respectively.
Table 19 and table 20 provide the comparison of ranking obtained from Fuzzy logic based algorithm and FVSI method. The rankings obtained from fuzzy logic method are matched to the results obtained using FVSI method.
Table 19: Comparison of Contingency Ranking Using Fuzzy logic and FVSI Method at IEEE-14 bus
|
Contingency No. |
CI = ΣSI LF + ΣSI vp |
Rank |
FVSI |
Rank |
|
1 |
415.95 |
2 |
0.1084 |
2 |
|
2 |
411.1 |
3 |
0.1074 |
3 |
|
3 |
459.58 |
1 |
0.1298 |
1 |
|
4 |
410.96 |
4 |
0.1022 |
4 |
|
5 |
403.86 |
5 |
0.0955 |
5 |
Table 20: Comparison of Contingency Ranking Using Fuzzy logic and FVSI Method at IEEE-30 bus
|
Contingency No. |
CI = ΣSI LF + ΣSI vp |
Rank |
FVSI |
Rank |
|
1 |
1199.23 |
1 |
0.167 |
1 |
|
2 |
998.85 |
4 |
0.1162 |
4 |
|
3 |
1012.15 |
3 |
0.1168 |
3 |
|
4 |
1107.15 |
2 |
0.1316 |
2 |
|
5 |
991.35 |
5 |
0.1139 |
5 |
The comparative study shows that there is a close agreement in the results between Fuzzy algorithm method and FVSI indicating that this technique is possible to be implemented practically.
-
VII. Conclusion
Simultaneous load increase at the selected load buses was conducted in order to identify the appropriate loading condition before a system started to lose its stability, then the contingencies ranked using composite index provides very useful information about the impact of the contingency on the system as a whole and helps in taking necessary control measures to reduce the severity of the contingency. The fuzzy logic based algorithm is efficient, simple and effectively ranks the contingencies. Based on composite index, suitable location for installing FACTS or any other corrective actions such as load shedding can be identified to avoid voltage collapse.
References Fuzzy Logic Based Power System Contingency Ranking
- Andersson, G.; Donalek "Causes of the 2003 major grid blackouts in North America and Europe, and recommended means to improve system dynamic performance", Power Systems, IEEE Transactions on Volume 20, Nov. 2005, pp. 1922 - 1928.
- Pimjaipong, W.; Junrussa "Blackout Prevention Plan – The Stability, Reliability and Security Enhancement in Thailand Power Grid", Transmission and Distribution Conference and Exhibition: Asia and Pacific, 2005 IEEE/PES 2005, pp. l - 6.
- IEEE Committee Report, "Voltage stability of power systems: Concepts, analytical tools and industrial experiences," IEEE Publication No. 90TH0358- 2-PWR, New York, 1990.
- Qiuxia Yu et al, “Adaptability evaluation of transmission network planning under deregulation,” Universities Power Engineering Conference, 2007. UPEC 2007. 42nd International pp. 53-56, 4-6 September 2007
- Scott Greene, Ian Dobson and Fernanado L. Alvarado, “Contingency Ranking for Voltage Collapse via Sensitivities from a Single Nose Curve”, IEEE Transactions on Power Systems, Vol.14, No.1, pp. 232-239, Feb 1999.
- R. A. Alammari, “Fuzzy System Applications for Identification of Weak Buses in Power Systems”, The Arabian Journal for Science and Engineering, Vol. 27, No. 2B, Oct. 2002.
- Y.Y. Hong and C.H. Gau, “Voltage Stability Indicator for Identification of the Weakest Bus Area in Power Systems”, IEE Proceedings Generation Transmission Distribution, Vol. 144, No. 4, July 1994.
- I. Musirin and T.K. Abdul Rahman, “Estimating maximum loadability of weak bus identification using FVSI”, IEEE Power Engineering Review, Nov. 2002.
- Y.L. Chen, “Weak Bus-Oriented Optimal Multi- objective VAR Planning”, IEEE Transactions on power system, Vol.11, No.4, Nov. 1996.
- Y.H. Song H.B. Wan, “Kohonen neural network based approach to voltage weak buses/area identification”, IEE Proceedings Generation Transmission Distribution, Vol. 144, No. 3, May, 1997.
- I. Musirin, “Novel Fast Voltage Stability Index (FVSI) for Voltage Stability Analysis in Power Transmission System”, Conference on Research and Development Proceedings, Shah Alam, Malasia, July 2002.
- M. Moghavvemi, O. Faruque “Real-Time Contingency Evaluation and Ranking Technique”, IEEE Proceeding on Generation, Transmission and Distribution, Vol. 145, N5, September 1998.
- Power System Test Case Archive. Available from: www.ee.washington.edu.
- L.Cox, The Fuzzy systems handbook, 2nd, academic press, new york, 1999.
- T. Terano, K. Asai, M. Sugeno, Fuzzy system theory and it’s application academic press, San Diego, 1991.
- Shobha Shankar, Fuzzy Approach to Contingency Ranking, International Journal of Recent Trends in Engineering, Vol. 1, No. 1, May 2009
