Fuzzy logic using tsukamoto model and sugeno model on prediction cost

Author: Adriyendi
Journal: International Journal of Intelligent Systems and Applications @ijisa
Article in issue: 6 vol.10, 2018.
Free access
This paper aims to implement Fuzzy Logic for cost prediction. Fuzzy Logic using Tsukamoto Model and Sugeno Model. Predicted costs consist of communication cost, transportation cost, and social cost as the external cost. The external cost is one component of living cost. High external cost becomes one of the causes of the high cost of living. The high cost of living is one of the factors causing high-cost economy. In this case, the cost prediction using Fuzzy Logic. Experimental results show that Fuzzy Logic using Tsukamoto Model with value is 1891. Fuzzy Logic using Sugeno Model with value 1621. Both models produce a feasible cost prediction. Feasible is meaning accurate and proper (value cost between low cost and high cost from all of cost). There are 46.56 % of the population of middle class in Indonesia. This means that 46.56% of the population of Indonesia has the potential to reduce the high cost economy. High cost economy (living cost) can be reduced, it can drive economic growth (social cost) and be able to improve social welfare (social cost).
Fuzzy logic, external cost, tsukamoto model, sugeno model
Short address: https://sciup.org/15016494
IDR: 15016494 | DOI: 10.5815/ijisa.2018.06.02
Text of the scientific article Fuzzy logic using tsukamoto model and sugeno model on prediction cost
Published Online June 2018 in MECS
The main component of external cost is communication cost, transportation cost, and social cost. Communication costs include internet access fees, access fees in social media communication, call charges by phone or mobile phone. Transportation costs include the cost of using private vehicles, tickets, and rental cars. Social costs include donations, gifts, booking fee meals with friends, drinks in cafes, and unexpected expenses in social interactions. Communication costs are linked to social costs, but current communication costs are above estimates due to the high costs of establishing connections, expanding networking, and finding new business opportunities. Social costs are costs in social activities. The social cost is the sum of all internal costs incurred by participants of relevant social activities [1].
Social costs contrast with personal costs. Social costs are not only related to activities that benefit social interaction, but the social effects of social activities are influenced by personal costs and other external costs. Focus personal costs on maximum profit. Communication costs, transportation costs, and social costs most significantly affect the cost of living. This means an external source of expenditure. High-cost transportation is one of a cause of goods and service become more expensive. Communication cost of the increase making social cost become highly. High social cost is one of high living cost. High living cost is one of factor of high-cost economy.
The high-cost economy also affects the global middleclass population. The global middle-class population exceeds 3 billion people (half of whom live in Asia). Most middle-class markets are from the G-7 group (including India and China). Indonesia will enter the top 10, shifting Italy, by 2020. For the first time, predictions by 2020, the middle class will be the majority of the global population. Developed and developing countries have a consumption rate of about $ 35 trillion or about $ 12,000 per head, equally in the middle class by 2015. The change in the distribution of middle-class spending will affect the market. New households entering the middle class will seek to purchase consumer goods, as well as communication services (communication cost), tourism (transportation cost), entertainment (social cost), health, and education [2]. The projected population of Indonesia 2020 is 271,066 million [3]. In Indonesia, the middle class is someone who belongs to a category with an income range of 2.6 million to 6 million rupiahs. The middle class is the socio-economic class between the workers and the upper classes, including professionals, skilled workers, and lower-level management.
The middle class consists mainly of professionals in services and industry and small entrepreneurs in the informal sector. The middle class population in Indonesia is about 128.51 million [4]. Growth in the middle class creates new customers, with high purchasing power, making life costs increasing. Living costs in the middle class are high enough to affect economic growth. In this paper, components of living costs are communication cost, transportation cost, and social cost. Therefore, communication cost, transportation cost, and social cost need to be calculated accurately and relevant. Accuracy is needed to predict reasonable and feasible costs. Relevant costs are needed to reduce the high-cost economy.
Prediction cost can be done by using Fuzzy Logic. Fuzzy Logic popular used to many application with advantages: fuzzy logic is easy to understand, fuzzy logic is flexible, fuzzy logic tolerant of imprecise data, fuzzy logic as model nonlinear of arbitrary complexity, fuzzy logic can be joined with conventional control technique, and fuzzy logic is based on natural language [5].
Fuzzy Logic is popular and used in many applications is Tsukamoto Model and Sugeno Model. Advantages of the Sugeno Model is computationally efficient, works well with linear techniques, works well optimization and adaptive techniques, guaranteed continuity of the output surface, and well suited to mathematical analysis. Advantages of Tsukamoto Model is especially in many uncertainty and vagueness situation, this method is very flexible and has tolerance to existing data [6].
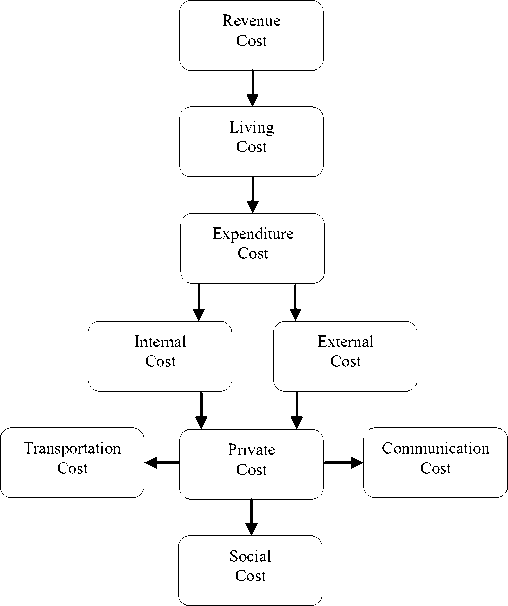
Fig.1. Cost Structure
Table 1. Component Cost
|
Component |
Accounting |
Prediction Cost |
|
Revenue Cost |
An amount that is expensed immediately thereby being matched with revenues of the current accounting period. |
|
|
Living Cost |
The amount of money needed to sustain a certain level of living including basic expenses such as housing, food, taxes, and healthcare. |
|
|
Expenditure Cost |
An amount may be for the purchase of an asset, a reduction, of a liability, a distribution to the owners, or it could be an expense. |
|
|
Internal Cost |
Costs that a business bases its price on include costs like materials, energy, labor, plant, equipment, and overheads. |
|
|
External Cost |
Costs that are not included in what the business bases its price on. |
|
|
Private Cost |
A producer’s or supplier’s cost of providing goods or services include internal cost incurred for input, labor, rent, and depreciation but exclude external cost incurred as environmental damage. |
|
|
Transportation Cost |
The costs that would be incurred to transport an asset form its current location to its principal (or more advantageous) market. |
Cost of private vehicle, ticketing, and rental car |
|
Communication Cost |
A certain monetary amount to the cost of a phone call or access to the internet. |
Access to the internet, online in social media communication, calling by phone or mobile phone. |
|
Social Cost |
Sum of all internal cost incurred by the relevant participant in the payment chain. The social cost is also considered to be the private cost plus external cost. Rational choice theory often assumes that individuals consider only the cost they themselves bear when making decisions. |
Gift, societal cost, eating with friends, drinking at the café, and unexpectedly cost |
Fig. 1 shown cost structure. In this paper, the cost structure is used as a model for cost prediction.
Fig. 2 shown personal cost. In this paper, personal costs as a model for the prediction of social costs.
Table 1 shown component cost (cost components). In this paper, the cost components are related to the individual's living costs and personal costs.
error rate and computation speed 0.00726598 seconds, while Tsukamoto 36.70% and 0.007607748 seconds. On employee model selection Sugeno has 3.00% average error rate and computation speed 0.0019221 seconds, while Tsukamoto 38.38% and 0.0020729 seconds.
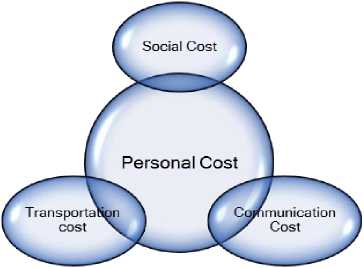
Fig.2. Personal Cost
-
III. The Proposed Method
The proposed method consists of Framework, Fuzzy Logic, Tsukamoto Model, and Sugeno Model.
-
A. Framework
Framework display in Fig. 3.
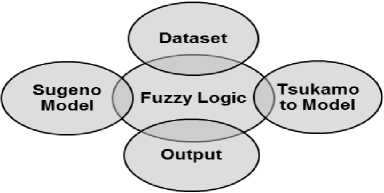
Fig.3. Framework Model
-
II. Related Work
Fuzzy Logic has been proposed by many researchers. Based on paper [7], Fuzzy Inference Systems (FIS) with defuzzyfication and the weighted average for air conditioning system. Mamdani FIS and Sugeno FIS used to this system. Mamdani FIS lacks the adaptive nature of other algorithms. Sugeno FIS can be used with other algorithms but requires intuitiveness.
Based on paper [8], analysis and comparison between Mamdani, Sugeno, and Tsukamoto method on fuzzy inference systems to find the best method in terms of reduction in electrical energy consumption of air conditioner. The results of experiments showed that the best method in terms of reduction in electrical energy consumption of air conditioning system is a method of Tsukamoto where the average electrical energy efficiency achieved by 74,2775%.
Based on paper [9], presents the basic difference between the Mamdani Model and Sugeno Model. Results have shown that for air conditioning system Mamdani Model and Sugeno Model performs similarly but by using Sugeno Model it allows the air conditioning system to work at its full capacity.
Based on paper [10], Mamdani, Tsukamoto and Sugeno-types FIS are applied to assist the tuberculosis diagnosis. The system is measured based on the level of accuracy, precision, and sensitivity of the system. The results have shown that, of the three types of Fuzzy Inference System, the best model is Sugeno model. Sugeno-type FIS has a better accuracy compared to Mamdani and Tsukamoto by value 93%.
Based on paper [11], built an application to analyze the comparison of Sugeno and Tsukamoto fuzzy method in the case of determination bonus by one point and who has the highest value average in sales. The results showed that the calculation of Sugeno bonus has 3.51% average
Fig. 3 shown that framework model of Fuzzy Logic as Fuzzy Inference System (FIS) consist of Dataset, Tsukamoto Model, Sugeno Model, and Output. Dataset based on the data source (Data Training and Data Testing). Tsukamoto Model based on FIS. Sugeno model based on FIS. The output is a prediction of social costs.
-
B. Fuzzy Logic
Fuzzy Logic is a crisp set whose set does not use {0, 1} but [0, 1], if the set member is represented by a real number between 0 and 1. The crisp set is membership function for an item in the crisp set rule is either 0 (for not being the member) or 1 (for being a member). Fuzzy Logic is an appropriate way to map an input space into a space of output. Fuzzy Logic is an idea have member functions that could represent the values of a term represented linguistically by using fuzzy set theory [12]. Steps of Fuzzy Logic shown in Fig. 4.
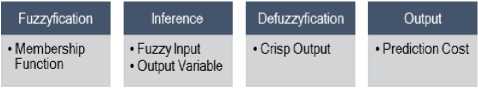
Fig.4. Fuzzy Logic Model
Fig. 4 shown that Fuzzy Logic having 4 steps. Step 1: Fuzzyfication is process mapping the input into fuzzy input by using membership function [13]. Step 2: Inference by fuzzy rules as fuzzy input and output variables. Step 3: Defuzzyfication is processed converting into the crisp output. Step 4: Output is the result of cost prediction.
-
C. Tsukamoto Model
Steps of Tsukamoto Model can be seen in Fig. 5.
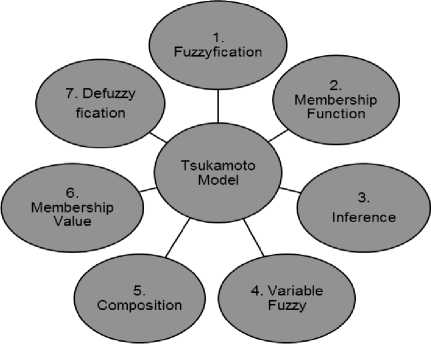
Fig.5. Tsukamoto Model
Fig. 5 shown Tsukamoto Model step by step in this application. There are 6 steps. Tsukamoto Model using the formula:
-
• Fuzzy Rule
Tsukamoto Model by fuzzy rule formed as [14]:
Where x is input variable, y is input variable, A is consequent variable, B is consequent variable, z is output variable, and C is variable’s value.
-
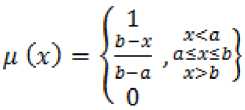
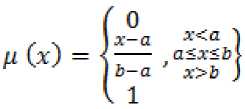
• Linear Increase Representation
This representation describes as a line that declines from maximum value of 1 until reach 0 on the axis that represents membership value and can be written as [14]:
-
• Linear Decrease Representation
This representation describes as a line which escalates from value of 0 until maximum reach 1 on the axis that represents membership value, and can be written as [14]:
-
• Defuzzyfication
Defuzzyfication (using weighted average) can be written as [14]:
X fLiM toizj
Determine the crisp output value by using
Defuzzyfication.
D. Sugeno Model
Steps of Sugeno Model can be seen in Fig. 6.
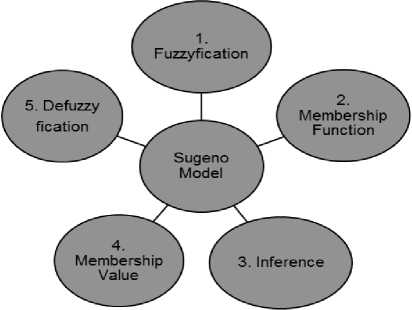
Fig.6. Sugeno Model
Fig. 6 shown Sugeno Model step by step in this application. Sugeno Model using the formula:
-
• Fuzzy Rule
Sugeno Model has two orde: orde-0 and orde-1 [15].
Orde 0 using rule formed as:
if ( x is A ) and ( y is B ) then z = k (5)
Orde 1 using rule formed as:
if ( x is A ) and ( y is B ) then z = f ( x, y ) (6)
Where x is input variable, y is input variable, A is consequent variable, B is consequent variable, k is constant as the consequent, z is output variable, z = f(x, y) is a crisp function in the consequent. Usually, f(x, y) is a polynomial in the input variables x and y .
-
• Linear Increase Representation
The method that is used in Tsukamoto Model [14] also used to Sugeno Model.
-
• Linear Decrease Representation
The method that is used in Tsukamoto Model [14] also used to Sugeno Model.
-
• Defuzzyfication
Defuzzyfication that is used in Tsukamoto Model [14] also used to Sugeno Model.
-
IV. Result and Discussion
-
A. Dataset
Dataset consists of Data Training and Data Testing.
Data Training showed in Table 2.
Table 2 shown Data Training as Data Model on living cost (US$/person /year). Information of current population of Indonesia about 260 million, 60 million is middle-class population. It is 60/260*100% = 62% middle class population in Indonesia. Table 2 shown Data Training consists of ID (1, 2, 3, 4), Communication Cost (CC with 4 data point), Transportation Cost (TC with 4 data point), Social Cost (SC with 4 data point), Low (lowest data point), and High (highest data point). Data Testing can be seen in Table 3.
Table 2. Data Training
|
ID |
CC |
TC |
SC |
|
1 |
1575 |
1658 |
1590 |
|
2 |
1494 |
1502 |
1450 |
|
3 |
1836 |
1924 |
1900 |
|
4 |
1703 |
1,675 |
1830 |
|
Low |
1494 |
1502 |
1450 |
|
High |
1836 |
1924 |
1900 |
Table 3. Data Testing
|
ID |
CC |
TC |
SC |
|
5 |
1638 |
1769 |
? |
Table 3 shown Data Training consists of an ID (x), Communication (CC with 1 data point), and Transportation Cost (TC with 1 data point), and Social Cost (SC = …?).
-
B. Tsukamoto Model
Step 1: Fuzzyfication
Fuzzyfication using Dataset based on linear representation (increase and decrease).
р,х <1494
, . 1836 - х и CCLaw^ = < ------- . 1494 < х < 1836
^' 1494
кО,х > 1836
/0,х <1494
1 х _ 1494
и СС^аЪ (г) = < -------- , 1494 < х < 1836
яуй 1836
к 1, х > 1836
/1, у < 1502
, . 1924 - у и ТС ,mv(y) = < -------- , 1502 < у < 1924
Lm’ ? 1502
11,у > 1924
/0, у < 1502
Я ТСHigh (у) = < У ~ 1502 ,1502 < у < 1924
5 1924
Х1,у > 1924
(l,z <1450
, . 1900 -z и SC (zj = А -------- , 1450 < z < 1900
М1П 1450
k0,z > 1900
Я 5С мах^ =
0,z < 1450
г - 1450 _
-------- , 1450 < z < 1900
l,z > 1900
Step 2: Membership Function
Membership function based on fuzzyfication (using linear increase and linear decrease).
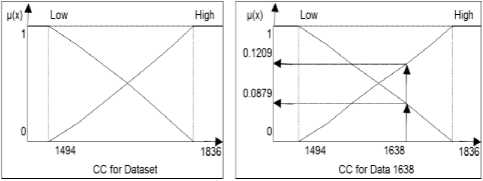
Fig.7. Representation Input Fuzzy for CC
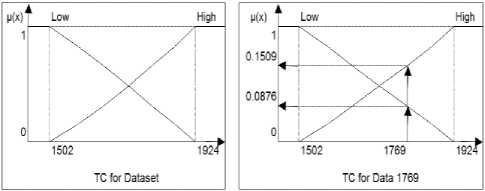
Fig.8. Representation Input Fuzzy for TC
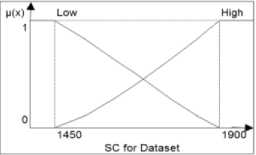
Fig.9. Representation Output Fuzzy for SC
Step 3: Inference
The inference is a process of combining many rules based on Dataset. Rule Base display in Table 4.
Table 4. Rule Base 1
|
R |
CC |
TC |
SC |
|
R1 |
Low |
High |
Minimum |
|
R2 |
Low |
Low |
Minimum |
|
R3 |
High |
High |
Maximum |
|
R4 |
High |
Low |
Maximum |
Table 5. Variable Fuzzy
|
Input |
СС = 11494:18361 = [1ли-:Я1дл] |
|
ТС = 11502:19241 = tLow.Highl |
|
|
Output |
SC =[1450:19001 = £Miremum:Marimum) |
|
Variable |
{СС, ТС, SC} |
|
Category |
СС : 1494:1836,1 = 1638 |
|
Rule |
All of rule can be used |
|
SC:1450: |
z = …? |
Table 6. Composition
|
C 1 |
C 2 |
|
сс № = д сс Lm,.([cc м]) 1638 ^дСС1т,.([1638]) сс tHigti) ~ СС to ссм- to . . 1836- 163Е СС — ” 1638 _ 198 С£?М ~ 163Е СС ю = 0.1209 -* fl СС (1т.ч |
ССм = д сс^([сс №]) 1638-»д CCH^k([1638]) Ю "" СС,- , to . . 1638- 1494 СС — w 1638 сс = 144 W 163В СС м = 0.0879 -» д СС (High) |
|
C3 |
C4 |
|
ТС Су) = ^ ТС 1тг([ГС О-з]) 1769 ^flTCLmv ([1769]) ^^Qmi) ~тс№ тс№- ТС г л 1924- 1769 ТС№~ 1769 155 ТС№-1769 ГС^у) = 0.0876-» дТС^ |
TC№=fi TCh^jQTC^)]} 1769-»д ТСД(дк([1769]) тс w^-IC ТС^- тс^ 1769- 1502 гс(у)- 1769 267 ГС№ - 1769 ГС (у) = 0.1509 -> ц ТС (н1д1() |
Table 7. Membership Value 1
|
z 1 |
z 2 |
|
R1 = fi(apl) R1 = ^ CCLow П д TCHvg-r Rt = тт([д CC^J П [^ rCHi£?J) R1 = mtn (0.1209: 0.1509) ~ Я1 = 0.1209 -» Z^ |
Я2 = д (ap2) Я 2 = ^ ^Law П Д TCLavv Я2 = min([д CCLD1V] Л [Д TCLmJ) Я2 = min (0.1209 : 0.0876) Я2= 0.1209-»22 |
|
Rt -* if CC IS Low and TC is High then SC is Minimum . 1900 -z . A1"^ 1900-1450 ~ 0,1205 Чг« 0120^ 1900-2 = 0.1209*450 1900-2= 54.4050 2 = 1900- 54.4050 2 = 1845.595C -s 1845 -s 2t |
Я2 -* if CCis Low and TCts Law then SC is Minimum 1900-2 R, -^----------- = 0.0876 2 1900- 1450 1900-2 = 0.0876 450 1900-2= 0.0876*450 1900-2= 39.4200 2= 1900- 39.4200 2= 1860.580C * 1860 ^ 2^2 |
|
z3 |
z4 |
|
Я3 = д (ap3) Д3 = д ССД1дк n д ТС^д), Rz = ™™(1д ССЯуй] n [^ 7C«CgJ) R3 = min (0.0879 : 0.1509) R^= 0.0879 -»23 |
^4 = ^ (“P4) Яд = Д CCjftgh П д TCLmt R4 = min([д ССН[дк] n [д rCLmv]) Яд = min (0.0879 : 0.0879) Яд = 0.0876 -» 24 |
|
Я3 -* if CCis High and TC is High then SC is Maximum 2-1900 R» -^----------- = 0.0875 3 1900- 1450 = 0.0875 45D 2-1900= 0.0879*450 2-1900= 39.5550 2= 1900+ 39.5550 2= 1939.555C -s 1939 -» 2g |
Я4 -* if CCis High and TC is Low then SC is Maximum 2-1900 R^ 1900- 1450= 0,0876 2-1900 = 0.0876 450 2-1900 = 0.0876 * 450 2-1900= 39.4200 2= 1900+ 39.4200 2= 1939.420C -s 1939 -» 2Д |
Table 4 shown Inference by using Rule Base (R1, R2, R3, and R4). Rule Base using IF-THEN rule with fuzzy intersection using operator AND:
-
• R1: IF CC is Low AND TC is High THEN SC is
Minimum
-
• R2: IF CC is Low AND TC is Low THEN SC is
Minimum
-
• R3: IF CC is High AND TC is High THEN SC is
Maximum
-
• R4: IF CC is High AND TC is Low THEN SC is
Maximum
Step 4: Variable Fuzzy
Variable Fuzzy can be seen in Table 5.
Step 5: Composition
The composition is shown in Table 6.
Table 6 shown Composition (C1, C2, C3, and C4) for all of the rule base (R1, R2, R3, R4).
Step 6: Membership Value
By using α = alpha predicate (the minimum value of membership degree), Z i = crisp values of membership degree, and Z = defuzzification (get a value of weighted average). Membership value display in Table 7.
Step 7: Defuzzy-fication
Defuzzy-fication to getting the weighted average display in Table 8.
Table 8. Defuzzyfication 1
Пмё^Л^ХГ-ИДй^^^ г_ (д (“рз) 8 z3) + (д (“p4) * ^4) _________ Д (“pi) + Д (“ра) + Д (“Рз) + Д (“р4) (0.1209*1845)+ (0.0876* 1860) + „ (0.0879*1939)+(0.0876* 1939)
" ~ (0.1209)+ (0.0876)+ (0.0879)+ (0.0876) (223.0605)+ (162.9360) + „ (170.4381)+ (169.8564)
" ~ (0.1209)+ (0.0876)+ (0.0879)+ (0.0876)
increase representation and linear decrease representation). Membership function that is Tsukamoto Model also used to Sugeno Model (except Representation Output Fuzzy for SC).
Step 3: Inference
The inference is the process of combining many rules based on Dataset. Rule Base modified display in Table 9.
Table 9. Rule Base 2
|
R |
CC |
TC |
SC |
|
R1 |
Low |
High |
SC = cc |
|
R2 |
Low |
Low |
SC=tA% *TC-CC |
|
R3 |
High |
High |
SC-TC |
|
R4 |
High |
Low |
SC =1910 |
Variable SC with rule modified based on expert input.
R1: SC = CC, it is meaning that value input CC can be used to output SC.
R2: 0.25*TC-CC, it is meaning that output SC gets from value 0.25 multiply TC minus CC (25% from utilization Transportation Cost and Communication Cost).
R3: SC = TC, it is meaning that value input CC can be used to output SC. R4: SC = 1910, that utilization SC limited by value 1910.
Step 4: Membership Value
Membership Value display in Table 10.
Step 5: Defuzzy-fication
Defuzzy-fication to getting the weighted average from the formula display in Table 11.
-
C. Output
The output from both model shown in Table 12.
Tsukamoto Model: SC is = 1891 (included in SC ^ Low: 1450 AND High: 1900) ^ feasible. Sugeno Model: SC is =1629 (included in SC ^ Low: 1450 AND High: 1900) ^ feasible.
Fig. 10 shown Dataset based on Table 2. Data Training consists of ID (1, 2, 3, 4), Communication Cost (CC with 4 data point), Transportation Cost (TC with 4 data point), Social Cost (SC with 4 data point), Low (lowest data point), and High (highest data point).
Fig. 11 shown Tsukamoto Model with data value on prediction cost. Prediction cost to input CC = 1638, input TC = 1769, output SC = 1891.
Fig. 12 shown Sugeno Model with data value on prediction cost. Prediction cost to input CC = 1638, input TC = 1769, output SC = 1629.
Fig. 13 shown comparison with data value on prediction cost. Prediction cost to Tsukamoto Model: CC = 1638, input TC = 1769, output SC = 1891. Prediction cost to Sugeno Model: CC = 1638, input TC = 1769, output SC = 1629.
Table 10. Membership Value 2
|
z 1 |
z 2 |
|
Я1=д(“ра Д1 = Д CCLaw n Д TCgigh Яг = гшп([д CC^,.] n [д rc«ifld) Rt = min (0.1209 : 0.1509) ~ R^ = 0.1209 |
я: = U ta^ R2 = Ц CCzmv А д TCLmv Я2 = пип([д CCLmv] nlgTC^]) Я2 = min (0.1209 : 0.08 76) ~ Я2= 0.0876 Я2 -» 0.25 * ТС - CC R2 = 0.25 * 1769- 1638 Я,= 1.195,75-» 1.195 |
|
Rt^Zt=SC CC = 1638 |
Д3 -» z2 = 0.25* ТС- CC = 1.195 |
|
z3 |
z4 |
|
Я3 = д (ap3) Я3 = Д CCyigh n Д TCHigh Я3 = ШШ([д CCeisft] n [д гсн1дк]) Я3 = min (0.0879 : 0.1509) Яя = 0.0879 |
д4 = Д (“р4) Я4 = д ССддк А д TCLmt R4 = min ([д ССЯф] ^[ДТС^]) Я4 = min (0.0879 : 0.0876) Я2 = 0.0876 |
|
fl3-»z3 = TC= 1769 |
Я4 -» z4 =SC = 1910 |
Table 11. Defuzzyfication 2
(д(“Р1) * ZJ + (^ («рг) * 2г)
z _ + (д (“pa) * ?з) + (Д (ap4) * z4)
Д (“pt) + Д (“pz) + Д (“pa) + Д (“рд) (0.1209 * 1638)+ (0.0876*1195) + (0.0879* 1769)+ (0.0876* 1910) ~ 0.1209+ 0.0876+ 0.0879 + 0.876
_ 198.0342+ 104.682+ 155.4951+ 167.316 " ~ 0.1209+ 0.0876+ 0.0879 + 0.876
~ 625.5273
Z =------ Z = 1628.9773
_______________ 0.3840 _________________________
Z = 1629 (round number)
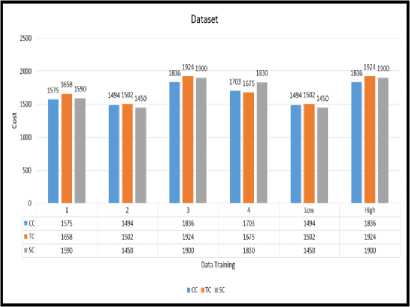
Fig.10. Dataset
Table 12. Output
|
ID |
CC |
TC |
SC |
|
5 |
1638 |
1769 |
Feasible |
|
Tsukamoto Model |
1891 |
||
|
Sugeno Model |
1629 |
||
Table 13. Comparison of Model
|
Tsukamoto Model |
Output |
|||
|
R |
CC |
TC |
SC |
Crisp Output Weighted Average |
|
R1 |
Low |
High |
Minimum |
|
|
R2 |
Low |
Low |
Minimum |
|
|
R3 |
High |
High |
Maximum |
|
|
R4 |
High |
Low |
Maximum |
|
|
Sugeno Model |
Output |
|||
|
R |
CC |
TC |
SC |
Constant (orde 0) Linier (orde 1) |
|
R1 |
Low |
High |
SC = CC |
|
|
R2 |
Low |
Low |
SC=0.25*TC-CC |
|
|
R3 |
High |
High |
SC = TC |
|
|
R4 |
High |
Low |
SC = 1910 |
|
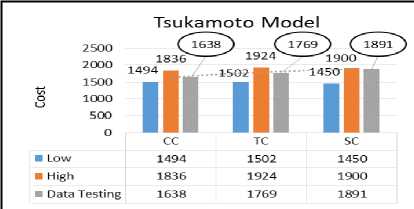
Fig.11. Output Tsukamoto Model
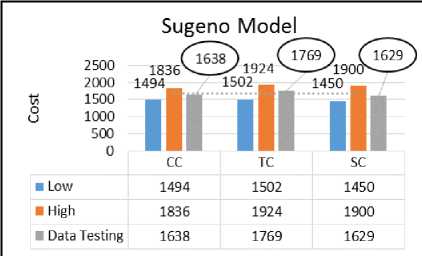
Fig.12. Output Sugeno Model
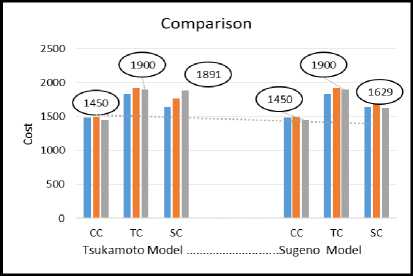
Fig.13. Comparison of Cost
-
V. Conclusion
Fuzzy Logic using Tsukamoto Model and Sugeno Model on prediction cost shown that external cost in Tsukamoto Model is 1891 and external cost in Sugeno Model is 1629. Both of model showed that result of prediction cost is accurate and proper. Accurate is the value of social cost can be decreasing high living cost. Proper is the feasible cost on all component in living cost. Prediction cost is reasonable cost can be decreasing high-cost economy. There are 46.56 % the number of the middle class of the population Indonesia. It means 46.56 percent of the population the middle class in Indonesia have the potential to reduce high-cost economies (living cost), able to drive of economic growth (social cost) and improve social welfare (social cost). Future work, Fuzzy Logic using Mamdani Model and fuzzy database modified Tahani Model on External Cost.
References Fuzzy logic using tsukamoto model and sugeno model on prediction cost
- H. Schmiedel, G. Kostova, and W. Ruttenberg, “The social and private costs of retail payment instruments: a European perspective”, Occasional Paper Series, no. 137, pp. 1-49, 2012.
- H. Kharas, “The unprecedented expansion of the global middle class: an update”, Global Economy & Development, Working Paper 100, pp. 1-32, 2017.
- BPS Statistic Indonesia, “Indonesia population projection 2010-2035”, Sub-directorate of Statistical Demographic, Jakarta, pp. 1-470, 2013.
- M.A. Nizar, “Middle class and its implications to economy of Indonesia”, Chapter 8, Nagakusuma Media Kreatif Publisher, Jakarta, pp. 171-192, 2015.
- Wasiur Rhmann, Vipin Saxena,"Fuzzy Expert System Based Test Cases Prioritization from UML State Machine Diagram using Risk Information", International Journal of Mathematical Sciences and Computing(IJMSC), Vol.3, No.1, pp.17-27, 2017.DOI: 10.5815/ijmsc.2017.01.02
- G. Singh, P. Kunai, and D. Goyal, “A review fuzzy logic and its application”, International Journal of Engineering and Technical Research, pp. 61-66, 2014.
- S. R. Chaudhari and M. E. Patil, “Comparative analysis of fuzzy inference systems for air conditioner”, International Journal of Advanced Computer Research, vol. 4, no. 4, iss. 17, pp. 922-927, 2014.
- A. Saepullah, and R. S. Wahono, “Comparative analysis of mamdani, sugeno and tsukamoto method of fuzzy inference system for air conditioner energy saving”, Journal of Intelligent Systems, vol. 1, no. 2, pp. 143-147, 2015.
- M. R. Mohanraj, M. Balamurugan, V.P. Suresh, and R. Gobu, “Design of air-conditioning controller by using mamdani and sugeno fuzzy inference systems”, South Asian Journal of Engineering and Technology, vol.2, no.16, pp. 7-16, 2016.
- W. E. Sari, O. Wahyunggoro, and S. Fauziati, “A comparative study on fuzzy mamdani-sugeno-tsukamoto for the childhood tuberculosis diagnosis”, Advances of Science and Technology for Society, AIP Conference Proceedings 1755, 070003, pp. 1-6, 2016.
- A T. Cahyono, S. Salu, and N. Nikentari, “Comparison analysis decision support system using fuzzy sugeno and fuzzy tsukamoto”, Repository of Final Project, Informatics Dept., Faculty of Engineering, Univ. Maritim Raja Ali Haji, Riau, pp. 1-9, 2013.
- M. Sampor, S. Kamali, L. Mortazavifar, and A. Khoramian, “Study on fuzzy systems and concepts: review papers”, Journal of Current Research in Science, vol. 4, no. 1, pp. 175-183, 2016.
- Adriyendi, "Fuzzy Logic using Tahani Model on Food Commodity", International Journal of Intelligent Systems and Applications(IJISA), Vol.9, No.7, pp.1-11, 2017. DOI: 10.5815/ijisa.2017.07.01
- R. A. Priyono and K. Surendro, “Nutritional needs recommendation based on fuzzy logic”, Procedia Technology, vol. 11, pp. 1244-1251, 2013.
- F. Cavallaro, “A takagi-sugeno fuzzy inference system for developing a sustainability index of biomass”, Sustainability, vol. 7, pp. 12359-12371, 2015.
