GA Based Optimal Placement of DGs for Loss Reduction and Reliability Improvement in Distribution Networks with Time Varying Loads

Author: Zahra Boor, Seyyed Mehdi Hosseini
Journal: International Journal of Intelligent Systems and Applications(IJISA) @ijisa
Article in issue: 4 vol.5, 2013.
Free access
The distributed generation (DG) locations have significant impacts on network reliability and loss. This paper presents a method for optimal DG allocation and sizing in distribution systems in order to reduce network loss and improve system reliability at the lowest cost. For this purpose, a multi-objective cost function considering active power loss, reliability index and DG cost is used to find the optimal size and location of DG units. Also, a load duration curve including four load levels with different weighting factor is considered. Moreover, the optimization technique that is based on Genetic Algorithm (GA) is implemented. In this paper, ECOST index is considered for reliability evaluation in the cost function and also, the effects system reconfiguration, is also considered for reliability assessment. To evaluate the proposed algorithm, the IEEE 33-bus and 69-bus test systems are employed and the results obtained reveal the effectiveness of proposed method.
Distributed Generation, Genetic Algorithm, Reliability, Loss Reduction, Multilevel Loads
Short address: https://sciup.org/15010408
IDR: 15010408
Text of the scientific article GA Based Optimal Placement of DGs for Loss Reduction and Reliability Improvement in Distribution Networks with Time Varying Loads
Nowadays, the implementation of distributed generation (DG) has been increased in distribution systems. DGs are small generating units that are usually embedded in the electric power system near the load centers. Many studies have been done to evaluate the impact of DGs on the operation of distribution networks.
Installing DG can be much beneficial for the consumers and utilities in distribution systems, especially when the central generation is not applicable or when there are shortages in the transmission system. So installing DG may have significant influence on power flow, loss and reliability indices in distribution systems, which could be positive or negative. It would be positive if they are properly coordinated with the rest of the network. Moreover, DG units can increase short circuit current, cause instability of frequency and voltage and decrease sensitivity to faults.
The power demand growth is a critical concern for the power utilities as they must always supply the customers with the least interruptions and cost. Integration of DG units to distribution networks can be a better solution that defers investments of upgrading existent power systems. If the system topology is assumed to be constant during the planning period, the appearance of new loads or the peak load demand growth to the network could show us the lack of a more upgraded network. In this case, DG can be a valuable choice for the planning engineers to reduce investments for upgrading the distribution system because it is located near the load and doesn’t need as much transmission and distribution infrastructures to served loads. In addition to this advantage, the main advantages of DG can be expressed as follows: improving the system reliability, improving voltage profile, power loss reduction, less polluting emissions (in comparison to traditional machines) [1], feasibility to use CHP (Combine Heat and Power) generation.
In power systems, loss and reliability are two significant points among several factors that can be considered, especially in distribution systems. Actually two of the most important DG profits are loss reduction and reliability improvement [2]. Although, using DGs can lower the loss and higher the reliability etc, in distribution network, it can apply a high capital cost to the system, too. It is obvious that the size of DGs has a significant role in both reliability improvement and loss reduction. Thus, the size of DGs should be optimized when they are allocated in the system. The planner’s main aim is finding the best solution that allows minimizing the overall cost within the technical constraints, because cost is an important factor in power planning. In some cases DG can significantly reduce cost (and improve reliability) more than the main network for customers when they be placed in the right position of the distribution system.
The problem of DG sizing and allocation has great importance. The installation of DGs at the places that is non-optimal, can cause an increase in system losses, resulting an increase in costs and, therefore, having a negative impact. Although, minimizing the power loss and improving the reliability at the same time will have very better results than optimizing one by one, only a few papers have considered the combination of these elements [3-6]. Loss minimization is studied in almost all papers studying DGs [7-11] and some papers have studied the reliability improvement of DGs [12]. Also there are many studies focusing on the optimal size and location of DGs in distribution systems. In [6], the authors considered the reliability of the system and line loss as a constraint in the DG planning problem for reducing line loss and improving reliability of the system and voltage profile by using genetic algorithm (GA) as an optimization technique. In [4] GA is used to find the optimal location, type, and size of DGs in distribution systems in order to maximize the reliability. In [13] combination of genetic algorithm (GA) and tabu search is employed to minimize the system losses.
Considering the classification of nodes in the reliability index, multilevel load duration curve in the power loss and reliability calculation and distribution system reconfiguration and load shedding that is implemented for reliability improvement, lead us to a more actual condition than previous works. In this paper a new algorithm based on GA and Optimal Power Flow (OPF) calculations, is proposed. Using this algorithm can help us find the optimal DG allocation and minimize the objective function which includes the costs of DG investment, reliability and power losses.
-
II. Load Modeling
The input data and it’s correct analysis specify the accuracy of optimization of objective function. One important data is definition of load modeling. Although, this issue may have influence on the accuracy of the results, just a few papers have included multi-levels of loading [14]. In this study, four load levels (light, medium, heavy and peak load) are considered for annual load duration curve for determination of size and location of DG which presented in Table 1.
Table 1: Four load levels considered for annual load duration curve
|
Load level number |
Network load level |
Load level interval timing (h/year) |
|
1 |
Light load |
T 1 |
|
2 |
Medium load |
T 2 |
|
3 |
Heavy load |
T 3 |
|
4 |
Peak load |
T 4 |
-
III. Problem Definition3.1 Distribution System Reliability Analysis
The overall algorithm for the reliability assessment is the determination of three areas of the system consisting of safe, interrupted and isolated. For the next step, ECOST (expected interruption cost) for all load points in these areas is calculated that is a part of the objective function.
By evaluating ECOST the system planners can to determine the satisfactory level of reliability for the system and customers. ECOST for ith bus can calculated as follows equation [15]:
ECOST i = L a(i) C i λ i
where λ i is the average failure rate, L a ( i ) is the average load connected to load point i (in kw) and C i is the cost of interruption (in $/kw) for the ith bus which is evaluated using composite customer damage function (CCDF) [15]. In order to submit the importance of a system outage, energy not supplied index (ENS) is evaluated. This index reflects total energy not supplied by the system due to faults during study period which can be calculated for each load bus i using the following equation:
ENSi = La(i) Ui where U is the annual outage time which is defined as below:
r is outage time.
In this method, at first, during system failure, the distribution system is divided into different classes by protective devices which are described in section 3.1.1. Then, the interrupted area is identified and load points that are fed with the main source or distributed generator(s), are recognized after reconfiguration.
-
3.1.1 Classification of Nodes
The distribution systems are divided into different sections by the protection and isolation devices (such as circuit breakers, fuses, disconnect/sectionalizing switches, tie switches, etc). In distribution systems, a section is defined as a group of components whose entry component is a switch or a protection device. As a result, there is only one switch or protection device in each section. When a failure occurs in the system, it must firstly be isolated by the nearest upstream breaker or fuse. Then, the sections that are affected by this failure must be isolated from the system by opening proper downstream and upstream switches. Based on the location of sectionalizers, normally open switch and DG location(s), load points in each node of distribution system are divided into different classes as follows:
Class A: Healthy load points not affected by a fault with zero duration timing for out of service;
Class B: The load points with duration timing out of service equal to the time of isolating the fault plus the reclosing time of the breaker;
Class C: The load points with duration timing out of service equal to the time of isolating the fault plus the reconnection time of the breaker plus the switching time of a tie switch or normally open switch;
Class D: The load points with duration timing out of service equal to the time of isolating the fault plus the starting time of DG.
Class E: Nodes with duration of service loss equal to the repair time of the failed component [16].
It should be noted when a section is connected to a DG, it is necessary to check if DG can supply the total loads of this section. If total load connected to the DG is greater than the maximum capacity of DG, some of load points must be shed. As mentioned above, a section is defined as a group of loads which is connected to a protection device. Therefore, in a distribution system with X sections, X is the number of protection devices in the local area for load shedding action and the total number of sections sets is 2X-1. To select the best section for shedding, a Priority Weighting Factor (PWF) has been used based on the Sector Customer Damage Functions (SCDF) and feeder load [17] and is used in this paper. SCDF provides the customer interruption cost models for different customers consisting of large user, industrial, commercial, agriculture, residential, government and institutions and office and buildings categories. PWF for section j in the distribution system for the outage of component i with failure duration r i , is determined using the following equation [17]:
N
Р^ = ^кск(4)
к=1 (4)
where, k represents load point k, N is the number of loads connected to section j , L k is the load connected to load point k, and C k (r i ) is the per unit customer cost for duration r i .
The load shedding procedure for determining which section or sections of load points should not be restored consists of the following steps:
-
1) The Priority Weighting Factor (PWF) for each section is calculated and then the sections are sorted in ascending manner.
-
2) The first section from the sorted list is selected and the total load to be cut for this section is determined.
-
3) The selected section is shed from the determined area.
-
3.1.2 Calculation of ECOSTSYS
Flowchart for identifying classes of nodes is presented in Fig. 1.
In order to determination of ECOST SYS , at first, this index is calculated for each load level using (1), then ECOST of the system is determined using the following equation:
ECOSTsys=£wlECOSTl
L (5)
where WL is weight factor of each load level (in this paper, it is considered based on the duration of each load level in load duration curve) and L is number of load levels.
Fig. 1: Flowchart for identifying classes of nodes
3.2 Power losses
P_Loss SYS is the total active power loss before DG installation in the distribution system.
In the power loss analysis, the amount of load consumed by each customer varies during a day. Thus, the system losses vary as a function of load. A complete search on the system is used to evaluate power loss reductions achievable by adding DGs.
Losses are an important consideration in designing and planning of distribution systems and calculated by load flow. The load flow is computed by forward/backward method in radial distribution networks. For a given time point, the power loss for line section can be obtained by:
4.2 Reliability Index (RI)
Distribution networks as the final stage of power delivery to customer have an important role in reliability improvement. Reliability index used in this study is expressed as following:
ECOSTSYS,DG ECOSTSYS
where ECOST SYS and ECOST SYS,DG is expected interruption cost of system before and after DG installation, respectively.
where I i is the magnitude of the current, R i is resistance of the line section bus i. The total power loss of the feeder is determined by adding up the losses of all line sections of the feeder as follows equation:
But, in order to determine P_Loss SYS , load levels must be considered. Then, P_Loss SYS is achieved using the following equation:
4.3 DG's Investment Cost Index (DICI)
DG is suitable solution for minimizing both the system energy loss and improving the network reliability. However, the investment cost of DGs is a significant problem that prevents engineers using them widely. This index is computed with the following equation:
DICI COSTDG
COST MCD
Р_Loss^yy — 2Z^l Pt,Loss l
where COST DG is cost of DG and COST MCD is cost of DG in its maximum capacity.
-
IV. Problem Formulation
-
4.1 Active Power Loss Index (PLI)
-
4.3.1 DG Cost Evaluation
-
4.4 The Multi-objective Cost Function
The first step in an optimization process is defining of the objective function. The main objective of this work is to find the optimal DG location and size in distribution systems in order that improve the reliability and reduce the costs of energy losses along with the operation and maintenance costs for installation of DGs. In order to obtain more accurate solution, load duration curve is used. Network loss, line loading and voltage of nodes are determined by load flow analysis at each load level, and also reliability assessment is used to calculate the network reliability indices. To solve this problem a multi-objective function is presented on the basis of active power loss index, reliability index, and DG's investment cost index which can be expressed as following:
In this paper, active power loss index is stated as following:
P_LossSYS,DGP_LossSYS
The multi-objective function that is used to find the optimal size and location of DG units is a sum of above indices. The multi-objective function of this problem can be described as following:
OF PLI + RI + DICI
this function is minimized subject to operational constraints. In this work, limits on the feeder current, bus voltage and the reactive power flowing back to the source side are set as operational constraints so that they maintained in a standard range.
where P_Loss SYS,DG is the total active power loss of the distribution system after DG installation and
-
V. Methodology
-
5.1 GA Optimization
Great attention should be given to the DG placement and sizing problem. The installations of DG units at non-optimal places have a negative effect on the desired goal. So, the development of an optimization method that can determine the optimal DG units allocation and sizing improving the system operation characteristics seems necessary for the system planning engineer dealing with the increase of DG penetration that is happening nowadays. This improvement is resulted from the deterministic duration change of the load points.
A Genetic Algorithm (GA) is a programming technique that mimics biological evolution as a problem solving strategy based on Darwinian’s principle of evolution and survival of fittest to optimize a population of candidate solutions towards fitness. GA uses an evolution and natural selection that uses a data structure like chromosomes and evolve the chromosomes, using selection, crossover, and mutation operators.
The process starts with a random population of chromosomes, which represent all possible solution of a problem that are considered candidate solutions. The size of the population depends on the size and the nature of the problem. The positions of each chromosome are encoded as characters or numbers and could be referred to as genes. Then according to the desired solution an evaluation function is used to calculate the goodness of each chromosome known as “Fitness Function”. Two basic operators, crossover and mutation, are used to simulate the natural reproduction and mutation of species during evaluation. The main aim of crossover is to search the parameter space and it is the most important operator in GA. The crossover operator takes two strings from the old population and exchanges the next segment of their structures to form the offspring. The function of mutation is used to prevent the loss of the information. Mutation can keep the population more diverse so that it alters a string locally to create a better string. Once the new proportion is completed, the program will continue to generate new population. The iteration can be stopped while no further significant change of the solution occurs or when the specified number of iteration is reached [18].
The selection of chromosomes for survival and combination is biased towards the fittest chromosomes. A GA generally has four components. A population of individuals represents a possible solution. A fitness function which is an evaluation function by which we can tell if an individual is a good solution or not. A selection function decides how to pick good individuals from the current population for creating the next generation. Genetic operators such as crossover and mutation which explore new regions of search space while keeping some of the current information at the same time. In this paper, mutation probability and crossover probability set as 0.2 and 0.8, respectively. The number of the initial population and the maximum number of iterations are selected 20 and 400, respectively. The flowchart of GA is presented in Fig. 2.
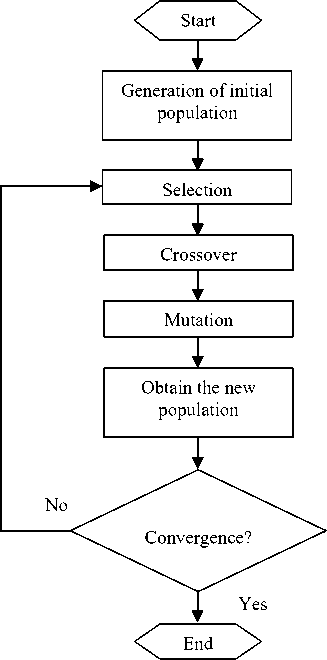
Fig. 2: Simple GA flowchart
-
VI. Application Study and Numerical Results
The suggested method for finding optimal size and location of DG has been implemented in the MATLAB and tested for various power systems. The test results for two different distribution systems are presented and discussed. Also an annual load duration curve with four load levels (light, medium, heavy and peak load) are considered for determination of size and location of DGs and presented in Fig. 3. Weighting factors used in the objective functions is selected proportion of duration of each load level in load duration curve and represented in Table 2.
Table 2: Weight factors for different load levels
|
W 1 |
W 2 |
W 3 |
W 4 |
|
0.1 |
0.2 |
0.6 |
0.1 |
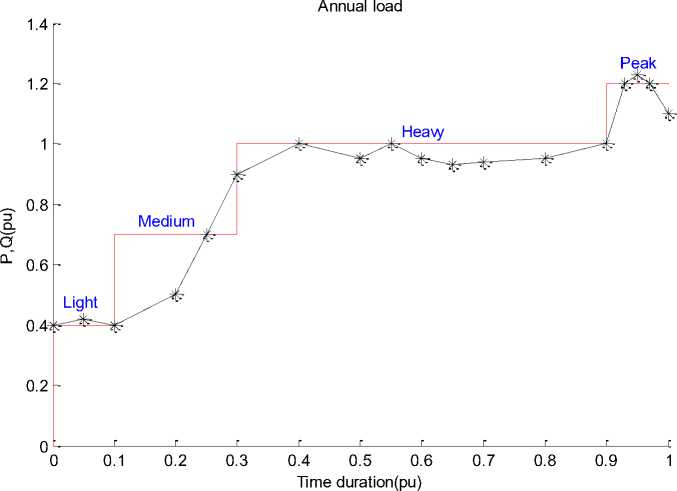
Fig. 3: Annual load duration curve
For example, because of having more duration for heavy load level, the importance of this load level is more than other levels and for evaluating reliability indices, different cases are considered as follows:
Case ‘1’: test system in the base case without DGs and tie switches;
Case ‘2’: test system without DGs considering tie switches;
Case ‘3’: test system without tie switches considering DGs;
Case ‘4’: test system considering both of DGs and tie switches.
Reliability parameters are taken from the RBTS-BUS2 [19] (length of all feeders is considered to be 0.75 km). Also, normally open switches data is taken from [20]. Restoration time (hour) of classes B, C, D, E in the test systems is considered as below [21], [22], [23]:
r B = 1, r C = 1.2, r D = 1.6 and r E = 5.
-
6.1 33 Bus Radial Distribution System
The first test system for case study is 33 bus radial distribution system. Single line diagram of the 12.66 kV, 33-bus, 4-lateral radial distribution system is shown in Fig. 4. Total load of the system in the heavy load level is (3715+ j 2300) kVA [20].
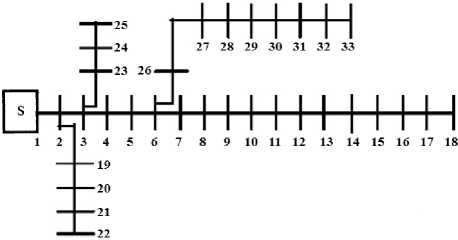
Fig. 4: Single line diagram of a 33-bus radial distribution system
It should be noted that for optimization problem two DGs are considered and maximum active and reactive power generation of each DG are considered 900 kW and 500 kVar, respectively. Table 3 shows the results of determination of optimum size and location of two DGs using genetic algorithm.
Table 3: Optimum size and location of DGs in 33 bus system
|
Number of DGs |
Location |
Size |
|
|
Node |
P(kW) |
Q(kVar) |
|
|
1 |
17 |
294.8200 |
334.0431 |
|
2 |
29 |
143.0351 |
164.6854 |
In order to indicate and compare the effects of DG placement in the test system, the results are compared to the case which there is no DG in the system and the results are presented in Table 4. It is observed from Table 4 that determination of optimum size and location of DG has a considerable effect on reliability improvement and loss reduction in the test system. It can be seen from this table that network reconfiguration (case 2) and each of DGs installation (case 3) methods can improve reliability indices, separately. For example, it can be seen from Table 4 that using DGs installation with optimum size and location (case 3), ECOST and ENS are improved from 118780 $ and 22793 kWh/yr (case 1) to 95212 $ and 18495 kWh/yr, respectively. Also, it is observed that these indices are improved to 105740 $ and 20839 kWh/yr (case 2). Moreover, the results obtained shows that using both of DGs installation and network reconfiguration methods causes to more reliability improvement in the test system. For example, Table 4 shows that ECOST and ENS are improved to 78772 $ and 15540 kWh/yr, respectively. On the other hand, the DG reduce power losses significantly so that the active power losses is reduced from 173.6975 kW to 107.0658 kW and reactive power losses is reduced from 115.8504 kVar to 70.8044 kVar.
Table 4: Comparison of results before and after DG installation in 33 bus system
|
Different cases |
ECOST SYS ($) |
ENS SYS (kWh/yr) |
P_Loss SYS (kW) |
Q_Loss SYS (kVar) |
|
|
Before DGs installation |
Case 1 |
118780 |
22793 |
173.6975 |
115.8504 |
|
Case 2 |
105740 |
20839 |
|||
|
After DGs installation |
Case 3 |
95212 |
18495 |
107.0658 |
70.8044 |
|
Case 4 |
78772 |
15540 |
|||
|
Improvement (%) |
Case 2 |
10.98 |
8.57 |
38.36 |
38.88 |
|
Case 3 |
19.84 |
18.86 |
|||
|
Case 4 |
33.68 |
31.82 |
-
6.2 69 Bus radial distribution system
The second test system for case study is a radial system with 69 bus and 68 branches. Single line diagram of the 12.66 kV, 69-bus, 8-lateral radial distribution system is shown in Fig. 5. Total load of the system in the heavy load level is (4181.7+ j 2923.1) kVA [24].
Here, for optimization problem two DGs are considered, too. Maximum active and reactive power generation of each DG are considered 1000 kW and 700
kVar, respectively. Table 5 shows optimum size and location of two DGs using genetic algorithm in 69-bus distribution system.
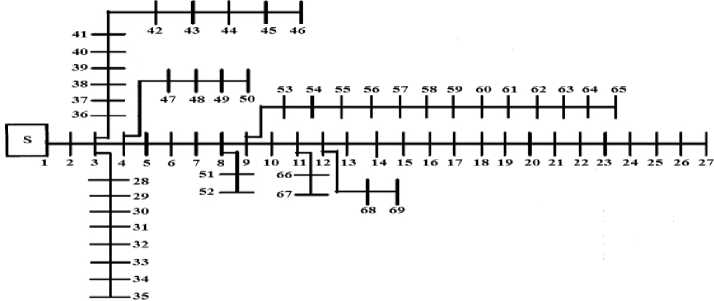
Fig. 5: Single line diagram of a 69-bus radial distribution system
Table 6: Comparison of results before and after DG installation in 69 bus system
|
Different cases |
ECOST SYS ($) |
ENS SYS (kWh/yr) |
P_Loss SYS (kW) |
Q_Loss SYS (kVar) |
|
|
Before DGs installation |
Case 1 |
253750 |
39489 |
226.7110 |
102.7429 |
|
Case 2 |
250640 |
39091 |
|||
|
After DGs installation |
Case 3 |
236790 |
36830 |
167.5320 |
77.2265 |
|
Case 4 |
233430 |
36390 |
|||
|
Improvement (%) |
Case 2 |
1.23 |
1.01 |
26.10 |
24.83 |
|
Case 3 |
6.7 |
6.73 |
|||
|
Case 4 |
8.01 |
7.85 |
Table 5: Optimum size and location of DGs in 69 bus system
|
Number of DGs |
Location |
Size |
|
|
Node |
P(kW) |
Q(kVar) |
|
|
1 |
34 |
200.2732 |
342.5753 |
|
2 |
53 |
238.6622 |
302.8494 |
Also, Table 6 shows the results and effect of allocation of DGs on reliability indices and system losses and as before case study, it can be seen that determination of optimum size and location of DG has a considerable effects on reliability improvement and loss reduction in the test system. As it is observed in this table, network reconfiguration (case 2) and each of DGs installation (case 3) methods can improve reliability indices, separately. Results of this table shows that using DGs with optimum size and location (case 3), ECOST and ENS are reduced from 253750 $ and 39489 kWh/yr (case 1) to 236790 $ and 36830 kWh/yr, respectively. In addition, for case 2 these indices are improved to 250640 $ and 39091 kWh/yr. Furthermore, in case 4 when both DGs and network reconfiguration methods are used, it will cause more reliability improvement in the test system. Table 6 shows that ECOST and ENS are improved to 233430 $ and 36390 kWh/yr, respectively. From the loss point of view, the DG reduce active and reactive power losses from 226.7110 kW and 102.7429 kVar to 167.5320 kW and 77.2265 kVar, respectively.
-
VII. Conclusion
In this paper optimum size and location of DGs for reliability improvement and network loss reduction at the lowest cost, considering time varying loads, are determined by an multi-objective function using genetic algorithm. For this purpose an annual load duration curve including four load levels with different weighting factor is considered. In this objective function, reliability improvement and loss reduction of electricity networks are considered as objective function components. Also, the effects of system reconfiguration and load shedding are considered for reliability assessment. For simulation purpose, 33 and 69 nodes distribution systems are applied and different cases are considered. The results obtained show that DGs installation in the distribution systems causes to power losses reduction and using both of DGs installation and network reconfiguration methods, simultaneously, causes to reliability indices improvement, significantly.
References GA Based Optimal Placement of DGs for Loss Reduction and Reliability Improvement in Distribution Networks with Time Varying Loads
- P. D. C. Wijayatunga, W. J. L. S. Fernando and R. M. Shrestha. Impact of distributed and independent power generation on greenhouse gas emissions: Sri Lanka. Energy Conversion and Management, v45, n20, Mar, 2004., pp. 3193-3206.
- P. A. Daly and J. Morrison. Understanding the Potential Benefits of Distributed Generation on Power Delivery Systems. in Proc. IEEE Rural Electric Power Conference, 29 April -1 May, 2001, pp. A2/1 A213.
- P. P. Barker, R. W. de Mello. Determining the Impact of Distributed Generation on Power Systems: Part1 - Radial Distribution Systems. in Proc. IEEE Power Engineering Society Summer Meeting v3, 2000, pp. 1645 – 1656.
- J. H. Teng, Y. H. Liu, C. Y. Chen. Value-Based Distributed Generator Placements for Service Quality Improvements. International Journal of Electrical Power and Energy Systems, v29, n3, Mar, 2007, pp. 268-274.
- D. H. Popovic, J. A. Greatbanks, M. Begovic, A. Pregelj. Placement of Distributed Generators and Reclosers for Distribution Network Security and Reliability. International Journal of Electrical Power and Energy Systems, v27, n5-6, Jun-Jul, 2005, pp. 398-408.
- C. L. T. Borges, D. M. Falcao. Optimal Distributed Generation Allocation for Reliability, Losses and Voltage Improvement. International Journal of Electrical Power and Energy Systems, v28, n6, Jul, 2006, pp. 413-420.
- D. Singh, D. Singh, K. S. Verma. Multiobjective Optimization for DG Planning with Load models. IEEE Transactions on Power Systems, v24, n1, Feb, 2009, pp. 427-436.
- S. H. Lee, J. W. Park. Selection of Optimal Location and Size of Multiple Distributed Generators by Using Kalman Filter Algorithm. IEEE Transactions on Power Systems, v24, n3, Aug, 2009, pp. 1393-1400.
- R. A. Jabr, B. C. Pal. Ordinal Optimization Approach for Locating and Sizing of Distributed Generation. IET Generation, Transmission and Distribution, v3, n8, Aug, 2009, pp. 713-723.
- G. Celli, E. Ghiani, S. Mocci, F. Pilo. A Multiobjective Evolutionary Algorithm for the Sizing and Siting of the Distributed Generation. IEEE Transactions on Power Systems, v20, n2, May, 2005, pp. 750-757.
- M. R. Haghifam, H. Falaghi, O. P. Malik. Risk-Based Distributed Generation Placement. IET Generation, Transmission and Distribution, v2, n2, Mar, 2008, pp. 252-260.
- L. Wang, C. Singh. Reliability-Constrained Optimum Placement of Reclosers and Distributed Generators in Distribution Networks Using an Ant Colony System Algorithm. IEEE Transactions on Systems, Man, And Cybernetics-Part C: Applications and Reviews, v38, n6, Nov, 2008, pp. 757-764.
- M. Gandomkar, M. Vakilian, M. Ehsan. A Genetic-Based Tabu Search Algorithm for Optimal DG Allocation in Distributed Networks. IEEE Trans. Electric Power Components & Systems, v33, n12, Dec, 2005, pp. 1351-1362.
- I. Ziari, G. Ledwich, A. Ghosh, D. Cornforth and M. Wishart. Optimal Allocation and Sizing of DGs in Distribution Networks. Power Systems&energy society, general meeting. IEEE Conference, 25-29 July 2010.
- L. Goel, R. Billinton. Evaluation of interrupted energy assessment rates in distribution systems", IEEE Trans. Power Deliv.,v6, n4, Oct, 1991, pp. 1876–1882.
- K. Xie, J. Zhou and R. Billinton. Reliability evaluation algorithm for complex medium voltage electrical distribution networks based on the shortest path. IEE Proc.-Gener Transm. Distrib. v150, n 6, Nov, 2003, pp. 686-690.
- P. Wang, R. Billinton. Optimum load shedding technique to reduce the total customer interruption cost in a distribution system. IEE Proc. Gener. Distrib., v147, n1, Jan, 2000, pp. 51-56.
- T. S. Chung, H. C. Leung. A genetic algorithm approach in optimal capacitor selection with harmonic distortion considerations. Electrical Power and Energy Systems, v21, n8, Nov, 1999, pp. 561–569.
- R. Billinton, S. Jonnavithula. A test System For Teaching Overall Power System reliability Assessment. IEEE Trans. Power Syst., v11, n4, Nov, 1996, pp. 1670-1676.
- M. E. Baran, F. F. Wu. Network reconfiguration in distribution systems for loss reduction and load balancing. IEEE Transactions on Power Delivery, v4, n2, Apr, 1989, pp. 1401-1407.
- R. Billinton, R. N. Allan. Probabilistic Assessment of Power Systems. IEEE Proc., v88, n2, Feb, 2000, pp. 140-162.
- R. Billinton, R. N. Allan. Reliability evaluation of power system. Plenum Press New York, Second Edition, 1996.
- H. Zareipour, K. Bhattacharya, and C. A. Canizares. Distributed Generation: Current Status and Challenges. Annual North American Power Symposium (NAPS), pp. 1-8, August 2004.
- M. E. Baran, F. F. Wu. Optimal capacitor placement on radial distribution systems. IEEE Transactions on Power Delivery, v4, n1, Jan, 1989, pp. 725-732.
