General problems of metrology and indirect measuring in cardiology: error estimation criteria for indirect measurements of heart cycle phase durations

Author: Mamberger Konstantine
Journal: Cardiometry @cardiometry
Section: R&D engineering in cardiometry
Article in issue: 1, 2012.
Free access
Aims This paper treats general problems of metrology and indirect measurement methods in cardiology. It is aimed at an identification of error estimation criteria for indirect measurements of heart cycle phase durations. Materials and A comparative analysis of an ECG of the ascending aorta recorded with the methods use of the Hemodynamic Analyzer Cardiocode (HDA lead) versus conventional V3, V4, V5, V6 lead system ECGs is presented herein. Criteria for heart cycle phase boundaries are identified with graphic mathematical differentiation. Stroke volumes of blood SV calculated on the basis of the HDA phase duration measurements vs. echocardiography data are compared herein. Results The comparative data obtained in the study show an averaged difference at the level of 1%. An innovative noninvasive measuring technology originally developed by a Russian R & D team offers measuring stroke volume of blood SV with a high accuracy. Conclusion In practice, it is necessary to take into account some possible errors in measurements caused by hardware. Special attention should be paid to systematic errors.
Cardiometry, cardiology, metrology, ecg, heart cycle phase analysis, measurement errors
Short address: https://sciup.org/148308721
IDR: 148308721
Text of the scientific article General problems of metrology and indirect measuring in cardiology: error estimation criteria for indirect measurements of heart cycle phase durations
Aims This paper treats general problems of metrology and indirect measurement methods in cardiology. It is aimed at an identification of error estimation criteria for indirect measurements of heart cycle phase durations. Materials and methods A comparative analysis of an ECG of the ascending aorta recorded with the use of the Hemodynamic Analyzer Cardiocode (HDA lead) versus conventional V3, V4, V5, V6 lead system ECGs is presented herein. Criteria for heart cycle phase boundaries are identified with graphic mathematical differentiation. Stroke volumes of blood SV calculated on the basis of the HDA phase duration measurements vs. echocardiography data are compared herein. Results The comparative data obtained in the study show an averaged difference at the level of 1%. An innovative noninvasive measuring technology originally developed by a Russian R & D team offers measuring stroke volume of blood SV with a high accuracy. Conclusion In practice, it is necessary to take into account some possible errors in measurements caused by hardware. Special attention should be paid to systematic errors. Keywords Cardiometry ≈ Cardiology ≈ Metrology ≈ ECG ≈ Heart cycle phase analysis ≈ Measurement errors Imprint Konstantine K. Mamberger. General problems of metrology and indirect measuring in cardiology: error estimation criteria for indirect measurements of heart cycle phase durations; Cardiometry; No.1; November 2012; p.151-163; doi:10.12710/cardiometry.2012.1.152165 Available from:
The responsibility of every metrological service is to provide the proper realization of internationally accepted units of measures by scientific method. If we consider current application of metrology as the science of measurement in medicine, it should be stated that often we have to deal with most problematic cases there. There are some basic aspects which should be taken into account to assure obtaining the proper measurements. Each of these aspects should be thoroughly realized as follows:
-
• all required reference standards and measuring instruments should be available;
-
• the proper repeatability of the measuring instruments and the results of measurements should be provided;
-
• all required methods for estimation of systematic, dynamic and static errors should be available;
-
• all required measures should be taken in order to provide the reliability of the measuring instruments in measuring for obtaining such a component of measurement error that in replicate measurements remains constant or varies in a predictable manner.
There are also other factors available which influence both measuring and its results, but in general they should be treated as those derived from the above mentioned aspects.
In order to discuss the problems of metrology in medical science in a correct manner, it should be noted that the relevant diagnostic parameters for humans are divided into two classes as follows: in vitro measured parameters and in vivo ones . It is a generally accepted classification where the in vitro parameter class includes such characteristics as body height, weight, mass etc. which can be measured with standard instrumentation widely used in practice. The other class covers the so called invasive parameters. It is rather difficult to treat the measurements of these parameters. Nowadays, modern techniques are capable of their recording, but an assessment or treatment of them should be performed by qualified experts only. At present, there are no reference standard instruments available that are capable of an adequately reflecting the inherent features of the human organs for diagnostics purposes and generating the relevant biological signals in the in vivo mode.
The ways how to solve the problem in in vivo measuring can be found by changing from the invasive measuring techniques to noninvasive indirect methods of measurements. This approach requires the development of theoretical models to be applied both to the organ under consideration and the performance of the latter. With both theoretical models missing, it is impossible to judge plausible estimates of physiological parameters measured.
There is another aspect of this issue to be treated, too. A more complicated challenge is to identify main features of the performance of any organ to be simulated because we deal with a great number of various interrelations and interconnections between all parts and segments within the human organism complex. In this case, if we abstract such a process, we will face the problem of the apriori recognition of the entire complex of all associated interrelated processes, since the human organism functions being interrelated are of the interdependent nature, taking into account the fact that every organ, among his other functions, shows its own self-regulation function. It is evident that the human body is designed as a non-redundant optimized system, but this fact cannot be used for solving the metrological problem in the medical science.
-
1. The necessity of developing of the proper theoretical model for indirect measurement methods stems from the current situation in the field of metrology applied to medical instrument production. It should be noted that there are various approaches taken to the simulation of the biophysical processes of biological organisms. In general, these approaches can be defined as follows (the definitions given below are developed by A. Prokopov [2]):
-
2. identification of object features that are essential and significant for process responsible for production of an information signal;
-
3. identification of physical processes that cause changes in the information signal;
-
4. formulation of equations with initial and boundary conditions;
-
5. quantitative analysis of the basic equations;
-
6. estimation of systematic error when applying the respective equations for measuring purposes.
In this case, it is required to treat separately the problem of the metrological calibration of an instrument and the problem of estimation of the instrument influence on distortions of the measured value.
An instrument can be calibrated using test signals generated by a built-in test signal generator. It is acceptable for performing of the calibration procedure for an instrument. But the systematic error should be estimated individually. Finally, the systematic error can be estimated using statistical method only [3].
It should be added that this process can be considered as satisfactory if the comprehensive checking of this process in practice shows only minor deviations of the recorded values from the theoretical estimated values. These deviations are considered as the systematic error.
It is not reasonable to discuss issues of an absolute accuracy of these deviations. The discussion should rather address another issue pertaining to the reliability of measurements.
The process specified above will lead to the development of a new paradigm in the field of the medical science.
Therefore, the special attention should be given to the issue of reliability and integrity of the recorded data. When designing medical devices, this issue should be studied within possible widest range covering all conditions of the human organism.
Materials and methods
Considering sources of errors that distort the integrity of data containing in an ECG record, it is feasible to carry out the study taking into account two cases as given below.
The first case covers an evaluation of compliance of the phase characteristics on an ECG recorded by the existing standard lead technology and with those recorded with an original HDA lead. This evaluation is to be performed using a common theoretical model for the calculation of the phase durations and the respective hemodynamic parameters.
The second case is aimed at an evaluation of the influence of pass bands of electronic filters on signals for ECG recording.
One of the objectives of this experiment is to determine the sources of the recorded data distortion. This allows realizing the true causes of the crisis of phase analysis method development that was a barrier for a long time to finding the proper solutions of measuring technologies in cardiology.
Further, the durations of the heart cycle phases were calculated, and on the basis of the calculations the relevant hemodynamic characteristics were estimated. All data were compared to determine the static error of the deviations.
The most important objective was to determine the degree of the integration and the differentiation of the recorded ECG signals depending on the characteristics of the electronic filters.
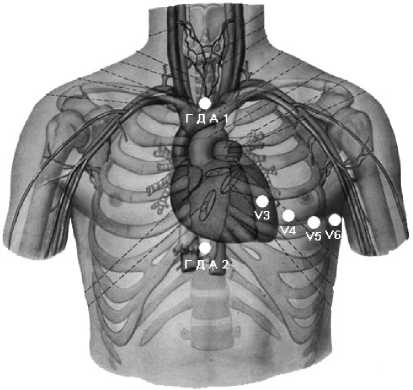
Figure 1. Arrangement of ECG electrodes in standard V3, V4, V5, V6 lead ECG recording versus originally developed HDA lead recoding.
Results
The data obtained in the above experiment are given in Table 1 below. The ECG curves recorded with use of different lead systems are provided in Figures 2 to 5 in this paper.
Tables 1. Comparative data on the measured values obtained in the analysis of the ECG curves recorded with use of different lead systems: original HDA lead system versus standard V3, V4, V5, V6 lead system:
-
А) at the same filter pass bands of the standard lead ECG and HDA lead ECG.
QRS
RS
QT
PQ
TT
SV (ml)
MV (l)
PV1 (ml)
PV2 (ml)
PV3 (ml)
PV4 (ml)
PV5 (ml)
HDA
0,093
0,047
0,363
0,084
1,013
72,4
4,3
50,7
21,7
42,9
29,4
10,7
V3
0,089
0,052
0,361
0,078
0,982
86,6
5,3
61,9
24,7
51,4
35,2
12,2
V4
0,088
0,043
0,355
0,088
0,984
62,9
3,8
43,4
19,6
37,3
25,6
9,6
V5
0,087
0,043
0,352
0,086
0,958
62,7
3,9
43,0
19,8
37,2
25,5
9,5
V6
0,090
0,046
0,341
0,096
0,961
69,3
4,3
46,6
22,6
41,1
28,2
9,9
-
B) with a low cutoff frequency equal to F lower = 0.7 Hz.
QRS
RS
QT
PQ
TT
SV (ml)
MV (l)
PV1 (ml)
PV2 (ml)
PV3 (ml)
PV4 (ml)
PV5 (ml)
HDA
0,100
0,048
0,367
0,081
0,920
74,6
4,9
49,2
25,4
44,3
30,3
10,8
V3
0,114
0,053
0,383
0,061
0,814
87,8
6,5
54,2
33,6
52,1
35,7
12,2
V4
0,100
0,044
0,365
0,078
0,963
65,8
4,1
44,9
20,9
39,1
26,8
9,9
V5
0,089
0,046
0,343
0,093
0,888
68,0
4,6
43,9
24,1
40,3
27,7
9,9
V6
0,090
0,047
0,336
0,094
0,811
70,8
5,2
42,6
28,1
42,0
28,8
10,0
C) with a top cutoff frequency equal to F upper = 11 Hz.
|
QRS |
RS |
QT |
PQ |
TT |
SV (ml) |
MV (l) |
PV1 (ml) |
PV2 (ml) |
PV3 (ml) |
PV4 (ml) |
PV5 (ml) |
|
|
HDA |
0,123 |
0,070 |
0,378 |
0,070 |
0,970 |
133,9 |
8,3 |
93,2 |
40,7 |
79,5 |
54,4 |
15,8 |
|
V3 |
0,118 |
0,072 |
0,382 |
0,059 |
0,979 |
143,2 |
8,8 |
104,5 |
38,6 |
85,0 |
58,1 |
16,9 |
|
V4 |
0,128 |
0,072 |
0,379 |
0,063 |
0,998 |
141,0 |
8,5 |
100,8 |
40,2 |
83,8 |
57,2 |
16,2 |
|
V5 |
0,128 |
0,072 |
0,379 |
0,063 |
0,998 |
141,0 |
8,5 |
100,8 |
40,2 |
83,8 |
57,2 |
16,2 |
|
V6 |
0,127 |
0,072 |
0,358 |
0,075 |
0,863 |
136,3 |
9,5 |
88,0 |
48,4 |
81,0 |
55,3 |
14,9 |
D) with the pass band equal to F lower = 0.7 Hz, F upper = 11 Hz.
|
QRS |
RS |
QT |
PQ |
TT |
SV (ml) |
MV (l) |
PV1 (ml) |
PV2 (ml) |
PV3 (ml) |
PV4 (ml) |
PV5 (ml) |
|
|
HDA |
0,138 |
0,069 |
0,401 |
0,059 |
0,964 |
134,7 |
8,4 |
92,3 |
42,4 |
80,0 |
54,7 |
16,2 |
|
V3 |
0,130 |
0,072 |
0,394 |
0,093 |
0,912 |
142,2 |
9,4 |
86,9 |
55,3 |
84,5 |
57,7 |
16,8 |
|
V4 |
0,130 |
0,072 |
0,373 |
0,068 |
0,843 |
140,2 |
10,0 |
88,9 |
51,2 |
83,3 |
56,9 |
15,8 |
|
V5 |
0,127 |
0,072 |
0,364 |
0,073 |
0,884 |
138,1 |
9,4 |
90,6 |
47,5 |
82,0 |
56,0 |
15,3 |
|
V6 |
0,130 |
0,074 |
0,357 |
0,080 |
0,833 |
140,1 |
10,1 |
86,1 |
54,0 |
83,3 |
56,8 |
15,0 |
Discussions and conclusions
The comparative analysis of the ECG curves reveals the following basic features. The HDA lead ECG curve is recorded when the electrodes are arranged on the aorta part surface at acupuncture points V14 and V22 to capture the signals from the aorta and the myocardium areas. In doing so, the processes of the cells depolarization over the entire area under study are recorded. Initially, V3, V4, V5, V6 were chosen to investigate the respective local areas. When comparing the HDA and V3 curves as shown in Fig. 2, it can be clearly seen that the V3 lead does not trace the fluctuations of the potential which is responsible for the operation of the aortic valve (contrary to the HDA curve as shown in Fig. 6 herein). Moreover, the segment of this standard lead system ECG curve, that contains the relevant information within this phase, is smoothed, so that all information is compressed, integrated and cannot be treated as valuable data. As it is seen from the V3 lead on the curve in the RS phase indicated in Fig. 6 herein, the above mentioned effect leads to an increase in the duration of the phase. This increase in the duration of the said phase can be traced as follows: for the standard ECG it corresponds to three squares on the chart paper versus two squares for the HDA curve. It would seem to be insignificant, but it is just these multitudinous ECG leads that are responsible for supply with incomplete, distorted and confused sets of data on the phase transitions and boundaries, as it was described for the specific case above. As a result, we have to deal with the crisis of the concept of the cardiac phase analysis diagnostics based on the classic ECG theory. The tendency to use as many leads as possible (to perform the phase analysis) cannot allow recording the durations of the same phase in various leads synchronously in a proper way. This concept does nothing but produces an additional number of error sources. Figures 2 to 5 provide various versions of curves, on the basis of which the data in Table 1 were calculated. It is evident that we have to solve the problem of the integration of the data on the phase transitions and boundaries considering different versions of the electrode location schemas.
The above statement and conclusion is applicable to the analysis of every heart cycle phase performed on the basis of high-resolution electrocardiography curves [4].
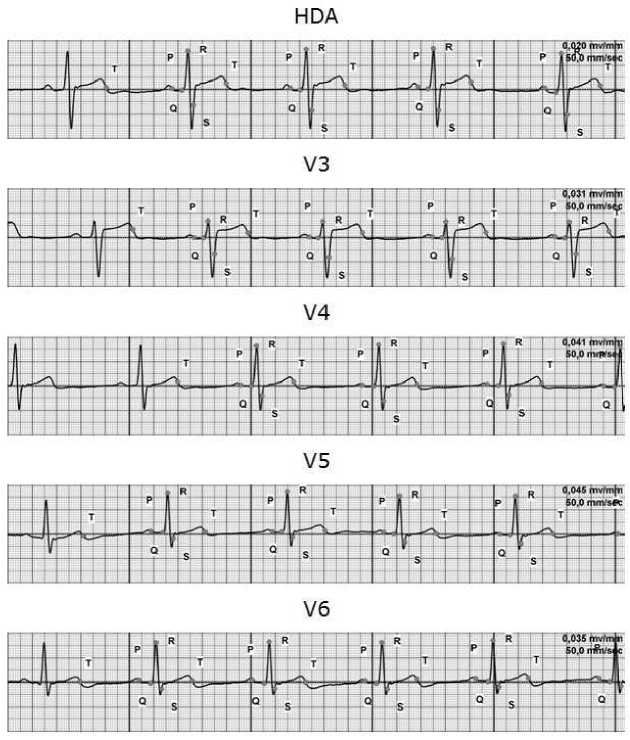
Figure 2. HDA lead ECG versus V3, V4, V5, V6 lead ECG curves recorded with the same filter pass band
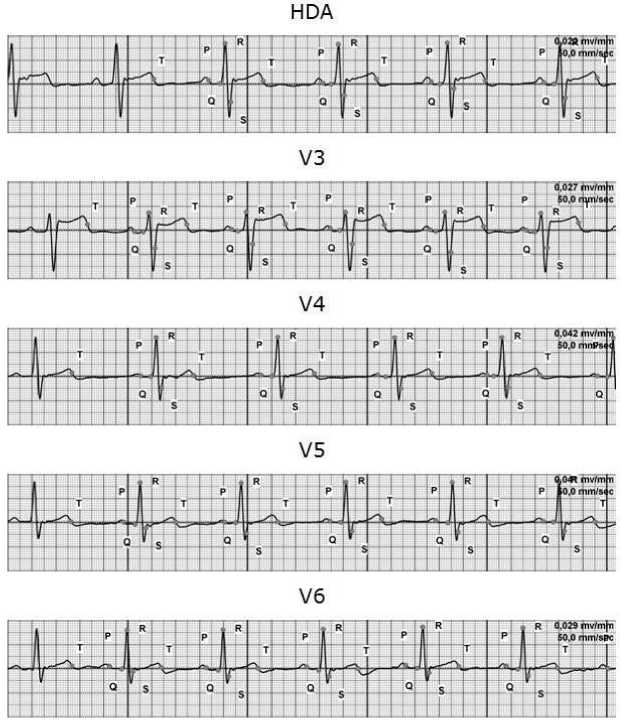
Figure 3. HDA lead ECG versus V3, V4, V5, V6 lead ECG curves (with low cutoff frequency equal to F lower = 0.7 Hz).
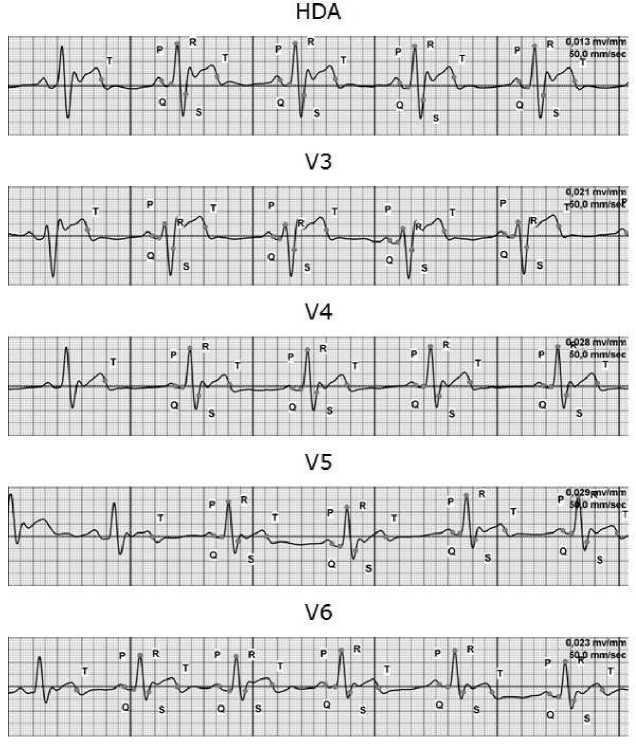
Figure 4. HDA lead ECG versus V3, V4, V5, V6 lead ECG curves (with the top cutoff frequency equal to F upper = 11Hz).
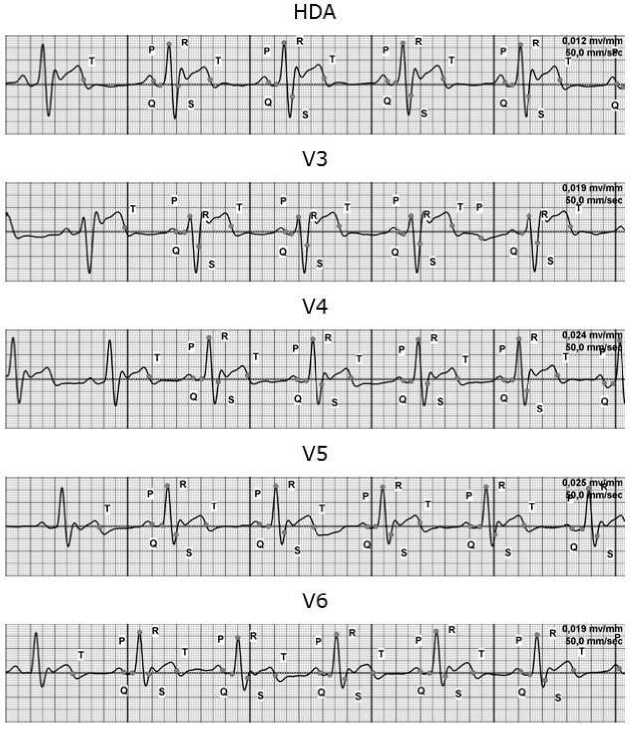
Figure 5. HDA lead ECG versus V3, V4, V5, V6 lead ECG curves (with pass band equal to F lower = 0.7 Hz, F = 11Hz).
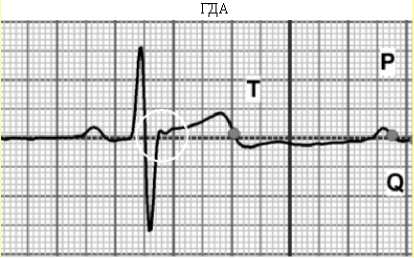
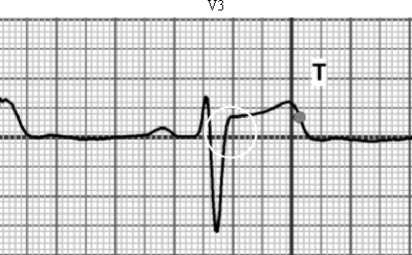
Figure 6. Absence of the data on operation of the aortic valve on the V3 lead ECG curve versus availability of this relevant data on the HDA lead ECG; an extension of the RS phase on the V3 lead ECG due to the signal integration effect (smoothing effect)
Using the proposed methodology, when performing spectral analysis and further integration of the most informative harmonics, we succeeded in an identification of the so called late ventricular potentials. According to the HDA method, these late ventricular potentials reflect the operation of the aortic valve as illustrated in Fig. 6 herein. This feature is applied in our method to qualitative evaluations of these potentials only, because our intention is not to take any measurements of potentials, but to utilize a unified theory of the phase analysis (to describe the phase processes only) avoiding generalized considerations of the phenomena like late ventricular potentials.
When speaking about the reliability of the values measured using the original HDA method, it should be stated that the conceptual model of the elevated fluidity conditions developed by G. Poedintsev and O. Voronova [5] fits very well the data obtained by us. We pioneered also in collecting this evidence in a number of the clinical trials of the HDA method application that was evaluated in comparison with the reference Teicholz method (equation 1) (s. Table 2 below). The difference between two methods is less than 1%. Moreover, the HDA method allows obtaining values with an accuracy up to 0.001. It is much better than it is required in practice for the reliable diagnostics.
Table 2. Data on quantitative measurements of stroke volumes: HDA method versus Teicholz method.
|
No. |
Name of patient |
Teichholz method (ml) |
HDA (ml) |
Difference (ml) |
Mean value of difference (ml) |
|
1 |
S.V.I. |
171.3 |
173.5 |
2.2 |
0.85% (under 1% of) |
|
2 |
A.V.S. |
59.4 |
58.5 |
-0.9 |
|
|
3 |
Zh.F.S. |
58.6 |
66.7 |
8.1 |
|
|
4 |
B.P.F. |
124.3 |
127.3 |
3.0 |
|
|
5 |
D.L.V. |
198.6 |
200.9 |
2.3 |
|
|
6 |
M.S.S. |
101.8 |
99.7 |
-2.1 |
|
|
7 |
O.B.A. |
79.3 |
78.0 |
-1.3 |
|
|
8 |
Sh.V.T. |
52.0 |
48.7 |
-3.3 |
|
|
9 |
R.D.R. |
95.2 |
94.9 |
-0.3 |
On the basis of the data presented above, we come to the conclusion that the results obtained using the HDA method are true values which can be used for the further estimation of the errors.
Statement on ethical issues
Research involving people and/or animals is in full compliance with current national and international ethical standards.
Conflict of interest
None declared.
References General problems of metrology and indirect measuring in cardiology: error estimation criteria for indirect measurements of heart cycle phase durations
- Prishepa M.I. Peculiarities of national support in uniformity of measurements in Medical Lab Diagnostics [electronic document]: Laboratory medicine No.6, 2003. Website: http://www.ramld.ru/articles/article.php?id=37.
- Prokopov А.V. Algorithm of justification of an equation of measurement and its systematic error (ambiguity) result in indirect measurements. [electronic document]: Web document: http://mscsmq.vniim.ru/files/2004/rus/prokopov-ru.pdf
- Rudenko М.Yu. Development of interference method of measuring arterial pressure and technical device based thereon. Author's abstract, PhD Thesis 05.11.17; in: M.Yu. Rudenko; MNIIIMT Moscow 1989: 20.
- Ivanov G.G. High resolution electrocardiography. Edited by Ivanov G.G., Grachev S.V., Syrkin A.L. Moscow., Publishing House Triada-Х 2003:304.
- Voronova О.К. Cardiovascular system transportation function automated evaluation models and algorithms development: Author's abstract, PhD Thesis, in: VorSTU Voronezh 1995: 155.
