Glaucoma diagnosis based on colour and spatial features using Kernel SVM

Author: Rebinth A., Kumar S.M.
Journal: Cardiometry @cardiometry
Section: Original research
Article in issue: 22, 2022.
Free access
The main aim of the paper is to develop an early detection system for glaucoma classification using the fundus images. By reviewing the various glaucoma image classification schemes, suitable features and supervised approaches are identified. An automated Computer Aided Diagnosis (CAD) system is developed for glaucoma based on soft computing techniques. It consists of three stages. The Region Of Interest (ROI) is selected in the first stage that comprises of Optic Disc (OD) region only. It is selected automatically based on the on the green channel’s highest intensity. In the second stage, features such as colour and Local Binary patterns (LBP) are extracted. In the final stage, classification of fundus image is achieved by employing supervised learning of Support Vector Machine (SVM) classifier for classifying the fundus images into either normal or glaucomatous. The evaluation of the CAD system on four public databases; ORIGA, RIM-ONE, DRISHTI-GS, and HRF show that LBP gives promising results than the conventional colour features.
Glaucoma, fundus image classification, support vector machine, radial basis function kernel, local binary pattern, colour features
Short address: https://sciup.org/148324637
IDR: 148324637 | DOI: 10.18137/cardiometry.2022.22.508515
Text of the scientific article Glaucoma diagnosis based on colour and spatial features using Kernel SVM
Anisha Rebinth, S. Mohan Kumar. Glaucoma diagnosis based on colour and spatial features using kernel SVM. Car-diometry; Issue 22; May 2022; p. 508-515; DOI: 10.18137/ cardiometry.2022.22.508515; Available from: http://www.
The damage to the optic nerve due to intraocular pressure leads to glaucoma and it is the second leading cause of vision loss globally. As glaucoma is irreversible, a computerized analysis system is needed to detect glaucoma at the earliest. A CAD system for glaucoma diagnosis is discussed in [1] based on clustering techniques. In pre-processing anisotropic diffusion filter is utilized for contrast enhancement and then the ROI is extracted. The Cup-to-Disc Ratio (CDR) is computed from the segmented region of OD and Optic Cup (OC). OD and OC are segmented by two clustering approaches; K- Means Clustering (KMC) and fuzzy C-means with hill climbing algorithm.
Convolutional Neural Networks (CNN) with Transfer Learning (TL) is described in [2] for automatic glaucoma classification. In the preprocessing stage, the fundus images with different format and sizes are processed into a same size and same standard format. Six different CNN architectures such as VGG19, ResNet50, GoogleNet etc., are used. All models are trained using Stochastic Gradient Descent (SGD) algorithm and uses binary cross entropy loss function. The data augmentation technique is used to overcome the overfitting problem.
Automatic glaucoma fundus image assessment using CNN network model with extensive validation is presented in [3]. The images used for training the networks are obtained by cropping the image around the OD region automatically. Five CNNs are employed for the classification including VGG16 and VGG19. In order to optimize the network model for glaucoma diagnosis, the SGD optimizer is used. Finally k-fold cross-validation technique is used to evaluate models. CAD based neural network using micro-statistical descriptors is discussed in [4] for glaucoma diagnosis. The first module selects the ROI around the OD region (cupping region) from the glaucoma fundus images. The second module extracts the micro-statistical estimators such as level, edge, ripple etc., using the laws kernels. Finally, the linear vector quantizer-artificial neural network classifier module is used to classify the fundus images.
Discrete Orthogonal Stockwell Transform (DOST) is discussed in [5] for automatic glaucoma classification. In preprocessing, ROI is extracted based on the maximum gray value in the green channel. Then the features are extracted from the ROI using DOST. The classification of the system employs the Machine Learning (ML) approach with the tree structured random forest classifier. ML based glaucoma diagnosis using color fundus images are described in [6]. ROI is selected manually and the green channel is utilized for the classification after normalization. VGG19 architecture with TL is employed for the classification that uses SGD optimization, dropout and data augmentation. Along with fundus image, the RNFL thickness and deviation maps, macular GCC thickness and deviation maps are also utilized independently for the classification. Final classification is obtained by a RF classifier.
Local Binary Patterns (LBP) based glaucoma detection is described in [7] using red free fundus images. The red free fundus image is obtained from the mean of green and blue channel images. Along with the classical LBP, features from the completed modelling of LBP are also utilized for the classification using K-Nearest Neighbor (KNN) [19]. The complex texture features are discussed in [8] for fundus image classification. At First, the ROI is extracted from the green channel. Features such as Gray Level Co-occurrence Matrix (GLCM) and LBP are extracted directly from the ROI and also from the optical density image of ROI. Finally, SVM with Radial Basis Function (RBF) kernel is used for the classification of glaucoma fundus images using the hybrid features.
GLCM and Markov Random Field (MRF) based glaucoma diagnosis is explained in [9]. In the preprocessing stage, the red channel is separated from the RGB fundus images and contrast enhancement is achieved by adaptive histogram equalization. OD is segmented by using k-means clustering, morphological and Hough transformation. Then, the textural features based on MRF and GLCM are extracted. Finally, SVM classifier is used Different computer vision techniques; matched filters, texture analysis, multiscale approaches, machine learning techniques and morphological methodologies are comprehensively reviewed in [10] for the identification and classification of glaucoma. Many supervised and unsupervised techniques for the localization of OD and OC are discussed along with model based, edge based and threshold based approaches.
Bit-Plane Slicing (BPS) and LBP techniques based automated glaucoma diagnosis is discussed in [11]. At first, the input RGB fundus images are separated into
Red, Blue and Green color images individually. Second, these individual channels are split into bit planes and LBP based statistical features are extracted. Third, the features obtained from three channels are given as inputs to three different SVM classifiers. Finally the decision level fusion is employed for the classification.
The automated digital image processing techniques for glaucoma diagnosis are reviewed in [12]. Different approaches to localize OD and OC region, blood vessel extraction along with different feature extraction techniques from the whole image are reviewed. Retinal image processing and SVM classification based glaucoma detection is discussed in [13]. After ROI extraction, histogram equalization and adaptive median filters are employed to enhance the contrast and eliminate noise. To extract the OD and OC region, colour component analysis and morphological operations are used. The quantitative features such as CDR and rim-to-disc ratio are computed and fed to SVM for classification.
2 Methods and Materials
An efficient CAD classification system aided with three stages; preprocessing, features extraction, and kernel-based classification is proposed. In preprocessing, ROI is selected automatically based on the intensity of the green channel. Followed by feature extraction using LBP and conventional colour based features from the ROI. Finally, classification step is done for the detection of the normal or glaucomatous images. Figure 1 shows the model for glaucomatous image classification.
2.1 Pre-Processing
It is well known that the OD region in the fundus images is the brightest region and thus this property is utilized for initial segmentation. Initially, the colour components of input fundus image such as Red, Green and Blue (RGB) are separated. Then, only the green channel is utilized to locate the OD region [1]. Based on the green channel’s highest intensity, ROI is extracted from the colour fundus image. Figure 2 shows the selected ROI from the input fundus images.
2.2 Features used
In the feature extraction stage, LBP [14] and the conventional colour based features are extracted from the ROI shown in Figure 2 (b). The computation of LBP is as follows:
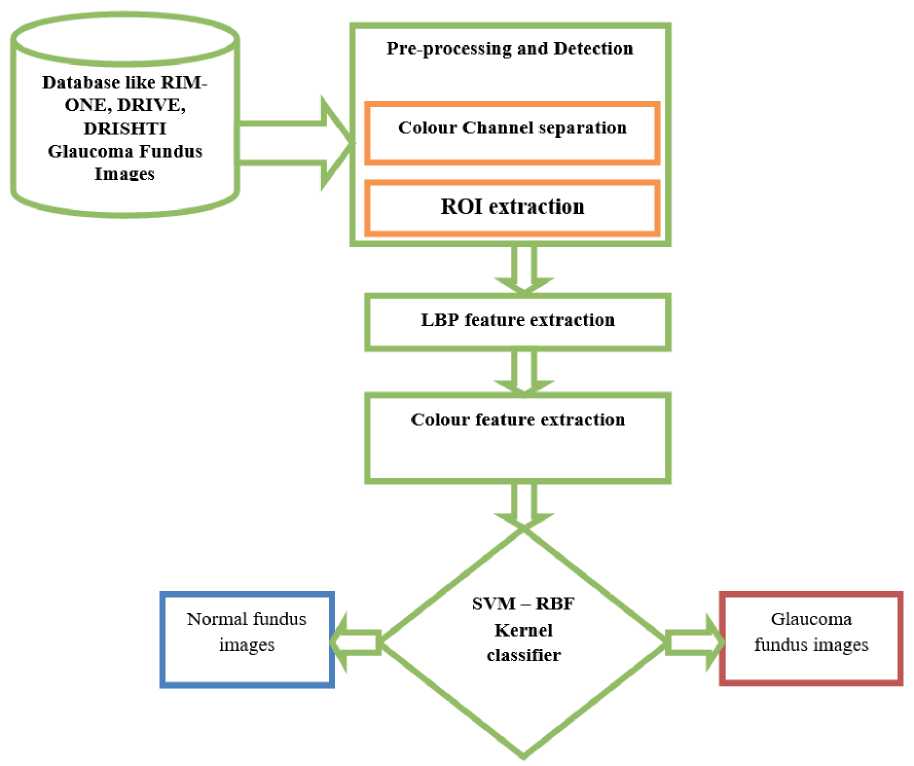
Figure 1 Model for Glaucoma Diagnosis
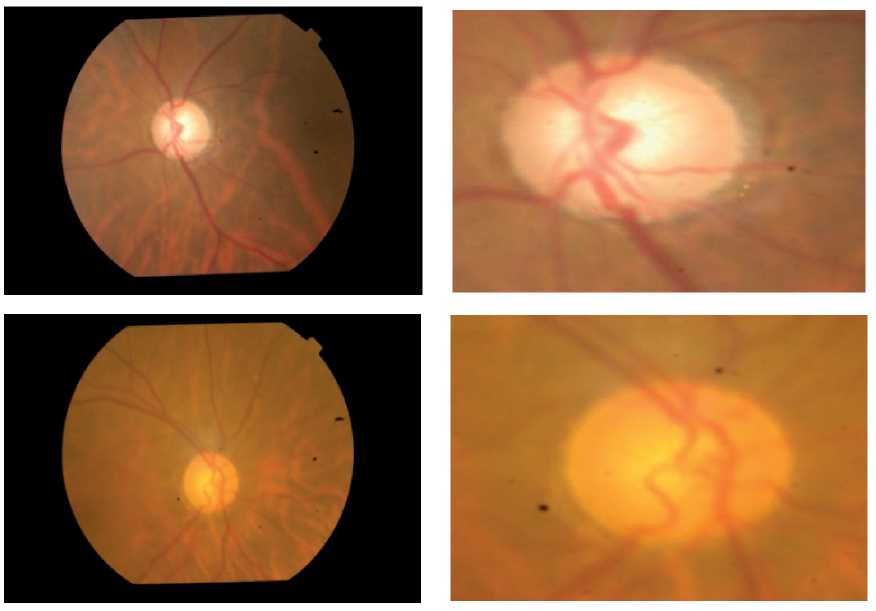
(a)
(b)
Figure 2. (a) Fundus image (b) ROI image
LBP = E 7=0 2nT(imgn - imgc), where c in the sub-script denoted the center pixel and n represents the neighbourhood pixels. The definition for T (threshold function) is defined by
'1 if i n — i c > 0
0 if i n - i c < 0
For each colour component in the ROI, Eqns. (1) and (2) are applied to extract the LBP for glaucoma diagnosis. Figure 3 shows how the LBP is computed for a 3x3 input.
The conventional colour features such as mean, standard deviation, skewness and kurtosis are also extracted from each colour component. Table 1 shows the extracted colour features from each colour components.
The extracted colour based features and LBP features are analyzed independently for glaucoma diagnosis using SVM classifier [20]. The SVM classifier with RBF kernel is discussed in the next section.
ear problems can be solved by applying the kernel trick which makes the non-linearity into linearity in higher dimensional feature space. Figure 4 shows the hyperplane for a two class-problem where normal healthy eye fundus images will belong to one class (say positive class, red colored dots) and glaucoma affected eye fundus images will belong to another class (say negative class, blue colored dots).
RBF kernel is used in this study to learn mappings in supervised manner to move from data space to a high dimensional feature space. To perform a nonlinear mapping of the dataset into some high dimensional feature space in which linear operations are performed. Since the original mapping is nonlinear, any linear operation in this feature space corresponds to a nonlinear operation in data space. In machine learning, RBF kernel is commonly used in SVM classification. The RBF kernel definition is given as,
K ( x , y ) = exp
II x - y||2
2 о 2
where is the standard deviation.
2.3 Kernel-based SVM classifier
SVM classifier calculates a hyperplane that separates the feature space with maximum margin [15]. Though the basic SVM is a binary linear classifier, it can be used for multiclass problems. Also, the non-lin-
3 . Results and Discussions
The performance of colour and spatial features based glaucomatous image classification system is evaluated using ORIGA [16], RIM-ONE[17], DRISH-
|
654 |
111 |
1x20 1x21 1x22 |
|
|
512 |
11 |
1x27 1x23 |
223 |
|
303 |
101 |
1x26 0x25 1x24 |
|
|
(a) Input |
(b) After thersholding ( T ) by |
(c) Application of Eqn. (1) |
(d) Computed LBP |
|
Eqn. (2) |
Figure 3 LBP computation
Table 1
Colour based Features
|
Mean |
Standard deviation |
|
|
nn h = - EE ROI ( i , j ) n i = 1 j = 1 |
о = 1 |
nn - EE ( ROI ( i , j ) -h )2 n , = 1 j = 1 |
|
Skewness |
Kurtosis |
|
|
nn
3/ n_n_ /2 1 EE ( pi . -h )2 < n i = i j = 1 ; |
s =- V |
nn 1 EE ( pi . -h )4 n . = 1 j = 1 3 X 2 3 nn 1 EE ( pi . -h )2 n . = 1 j = 1 J |
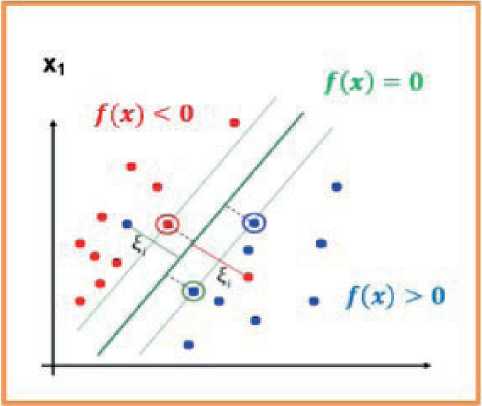
Figure 4 SVM -hyperplane
TI-GS1 [18] and HRF [21] database images. Also, k-fold cross validation with k =10 is used to validate the model. Figure 5 shows the samples images in the databases. Figure 6 shows the k -fold approach.
To evaluate the performance metrics such as accuracy, specificity and sensitivity, update TP and FN if glaucoma image is correctly classified and incorrectly classified respectively while testing each fold. Similarly, update TN and FP if normal image is correctly classified and incorrectly classified. Finally, the performance of the system for glaucoma diagnosis is evaluated based on these parameters. Table 2 shows the performance metrics used.
(a) (b)
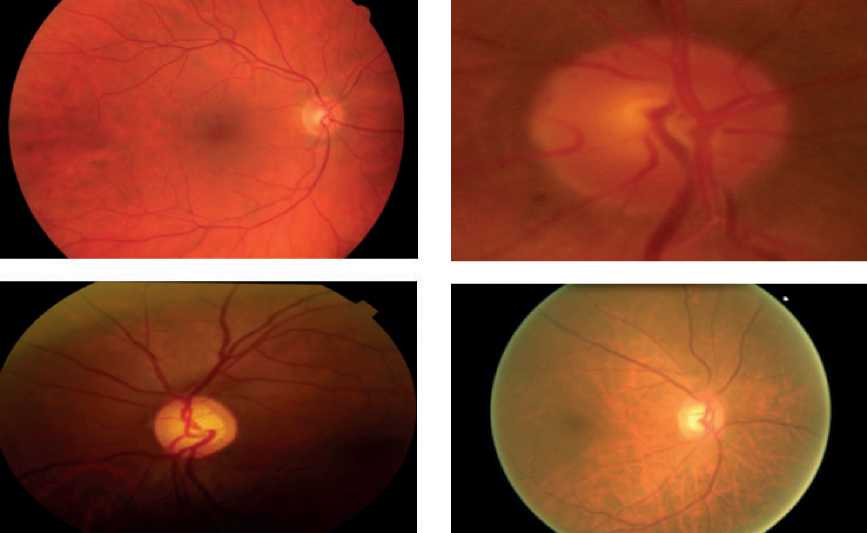
(c) (d)
Figure 5 Sample images in the database (a) HRF (b) RIM-ONE (c) (b) DRISHTI-GS1 (d) ORIGA
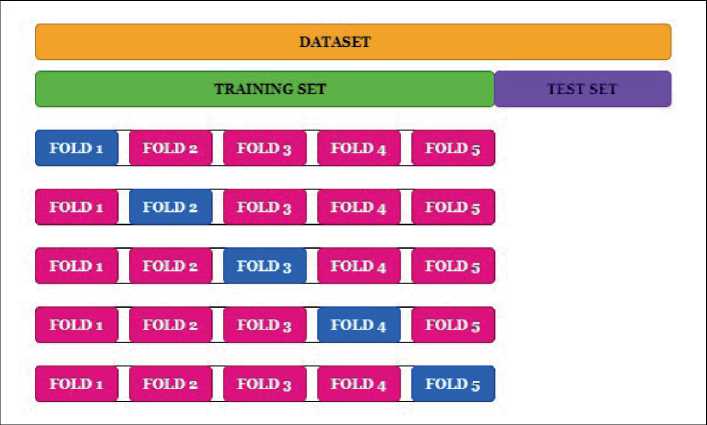
Figure 6 k-fold technique in CV
Table 2
Performance metrics
|
Sensitivity |
Specificity |
Accuracy |
|
T P |
T N |
T P + T N |
|
T P + F N |
T N + F P |
T P + F P + T N + F N |
Table 3 shows the performances of the glaucomatous image classification system using SVM-RBF classifier by colour and LBP features.
It can be seen from Table 3 that the LBP features outperforms the colour features to classify the abnormal fundus images form glaucoma diagnosis. For HRF database images, LBP based system provides 70% accuracy whereas colour features based system gives only 56.67%. Similarly, approximately 9% improvement can be seen for DRISHTI-GS1 database images by LBP (79.21%) over the colour features (70.30%). Also, it is observed that the performance of the colour based system for RIM-ONE and ORIGA database im- ages are 67.18% and 77.85% whereas it is 75.57% and 80.77% for LBP based system. Figure 6 plots the performance of the fundus image classification for glaucoma diagnosis using colour and LBP features. It can be seen from Figure 7 that the overall accuracy and sensitivity of the LBP based system is higher than the colour features based system.
However, the colour based system gives highest specificity than LBP which means that more normal images are correctly classified by the colour features than LBP based system.
4 . Conclusions
In this paper, a CAD system is developed for glaucoma diagnosis using colour and LBP based features. The performances of the colour based and LBP based systems are validated using 10-fold cross-validation with three important performance metrics; accuracy, specificity and sensitivity. Initially, the color components such as Red, Green, and Blue are separated and
Table 3
Performances of the glaucoma image classification system
|
Performance metrics |
Features |
Database |
|||
|
HRF |
DRISHTI-GS1 |
RIM-ONE |
ORIGA |
||
|
Accuracy |
Colour |
56.67 |
70.30 |
67.18 |
77.85 |
|
LBP |
70.00 |
79.21 |
75.57 |
80.77 |
|
|
Sensitivity |
Colour |
53.33 |
74.29 |
58.97 |
70.24 |
|
LBP |
66.67 |
82.86 |
71.79 |
77.38 |
|
|
Specificity |
Colour |
73.33 |
70.97 |
77.17 |
81.95 |
|
LBP |
60.00 |
61.29 |
70.65 |
80.50 |
|
-
■ Accuracy-Colour
-
■ Sensitivity-LBP
-
■ Accuracy-LBP
-
■ Specificity-Colour
-
■ Sensitivity-Colour
-
■ Specificity-LBP
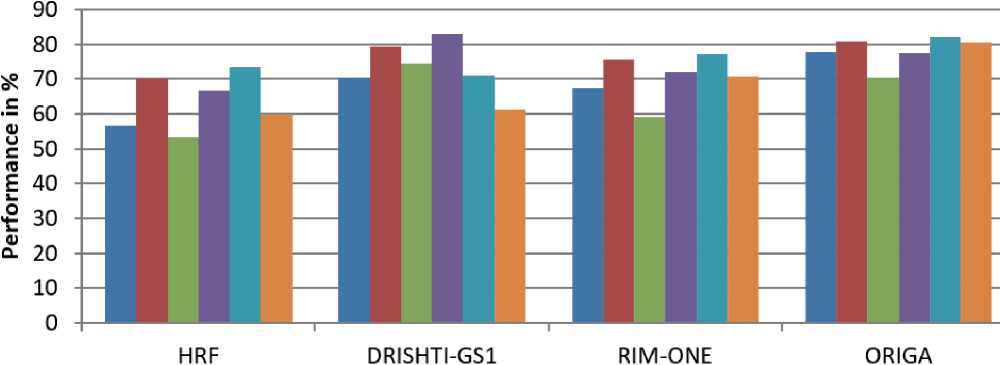
Figure 7 Performance of the system for glaucoma diagnosis using colour and LBP features
then the ROI is obtained. Features are extracted from only the ROI area from each component. Finally, the glaucoma classification is done by using the RBF kernel based SVM classification system. Results show that the efficacy of LBP based system is better than colour based features for all four databases; ORIGA, RIM-ONE, DRISHTI-GS, and HRF used in this study.
Statement on ethical issues
Research involving people and/or animals is in full compliance with current national and international ethical standards.
Conflict of interest
None declared.
Author contributions
The authors read the ICMJE criteria for authorship and approved the final manuscript.
References Glaucoma diagnosis based on colour and spatial features using Kernel SVM
- Ganeshbabu, T. R. (2015). Computer aided diagnosis of glaucoma detection using digital fundus image. International journal of advances in signal and image sciences, 1(1), 1-11.
- Gómez-Valverde, J. J., Antón, A., Fatti, G., Liefers, B., Herranz, A., Santos, A., ... & Ledesma-Carbayo, M. J. (2019). Automatic glaucoma classification using color fundus images based on convolutional neural networks and transfer learning. Biomedical optics express, 10(2), 892-913.
- Diaz-Pinto, A., Morales, S., Naranjo, V., Köhler, T., Mossi, J. M., & Navea, A. (2019). CNNs for automatic glaucoma assessment using fundus images: an extensive validation. Biomedical engineering online, 18(1), 1-19.
- Alagirisamy, M. (2021). Micro Statistical Descriptors For Glaucoma Diagnosis Using Neural Networks.International Journal of Advances In Signal And Image Sciences, 7(1), 1-10.
- Ganeshbabu, T. R. (2017). Glaucoma image classification using discrete orthogonal stockwell transform. International journal of advances in signal and image sciences, 3(1), 1-6.
- An, G., Omodaka, K., Hashimoto, K., Tsuda, S., Shiga, Y., Takada, N., ... & Nakazawa, T. (2019). Glaucoma diagnosis with machine learning based on optical coherence tomography and color fundus images. Journal of healthcare engineering, 2019.
- Ali, M. A., Hurtut, T., Faucon, T., & Cheriet, F. (2014, March). Glaucoma detection based on local binary patterns in fundus photographs. In Medical Imaging 2014: Computer-Aided Diagnosis (Vol. 9035, p. 903531). International Society for Optics and Photonics.
- Srinivasan, C., Dubey, S., & Ganeshbabu, T. R. (2016). Complex Texture Features for Glaucomatous Image classification System using Fundus Images. International Journal of Engineering Research & Science, 2(12), 106-113.
- Kavya, N., & Padmaja, K. V. (2017, October). Glaucoma detection using texture features extraction. In 2017 51st Asilomar Conference on Signals, Systems, and Computers (pp. 1471-1475). IEEE
- Shabbir, A., Rasheed, A., Shehraz, H., Saleem, A., Zafar, B., Sajid, M., ... & Shehryar, T. (2021). Detection of glaucoma using retinal fundus images: A comprehensive review. Mathematical Biosciences and Engineering, 18(3), 2033-2076.
- Maheshwari, S., Kanhangad, V., Pachori, R. B., Bhandary, S. V., & Acharya, U. R. (2019). Automated glaucoma diagnosis using bit-plane slicing and local binary pattern techniques. Computers in biology and medicine, 105, 72-80.
- Sarhan, A., Rokne, J., & Alhajj, R. (2019). Glaucoma detection using image processing techniques: A literature review. Computerized Medical Imaging and Graphics, 78, 101657.
- Patil, A., Roopashree, N., Gudaje, S., & Kavya, G. B. (2020, July). Detection of Glaucoma in Retinal Image using Image Processing and SVM. In 2020 11th International Conference on Computing, Communication and Networking Technologies (ICCCNT) (pp. 1-6). IEEE.
- Ojala, T., Pietikäinen, M. and Mäenpää, T. (2002), Multiresolution Gray-scale and Rotation Invariant Texture Classification with Local Binary Patterns. IEEE Trans. Pattern Analysis and Machine Intelligence 24(7): 971-987.
- Wang, J., Chen, Q., & Chen, Y. (2004, August). RBF kernel based support vector machine with universal approximation and its application. In International symposium on neural networks (pp. 512-517). Springer, Berlin, Heidelberg.
- Zhang, Z.; Yin, F.S.; Liu, J.; Wong, W.K.; Tan, N.M.; Lee, B.H.; Cheng, J.; Wong, T.Y. Origa-light: An online retinal fundus image database for glaucoma analysis and research. In Proceedings of the 2010 Annual International Conference of the IEEE Engineering in Medicine and Biology, Buenos Aires, Argentina, 31 August–4 September 2010; pp. 3065–3068.
- Fumero, F.; Alayón, S.; Sanchez, J.L.; Sigut, J.; Gonzalez- Hernandez, M. RIM-ONE: An open retinal image database for optic nerve evaluation. Proceedings of the 2011 24th International Symposium on Computer- Based Medical Systems (CBMS), Bristol, UK, 27–30 June 2011; pp. 1–6.
- Sivaswamy, J.; Krishnadas, S.R.; Joshi, G.D.; Jain, M.; Tabish, AUS. Drishti-gs: Retinal image dataset for optic nerve head (onh) segmentation. In Proceedings of the 2014 IEEE 11th International Symposium on Biomedical Imaging (ISBI), Beijing, China, 29 April–2 May 2014; pp. 53–56.
- Murugan, S., Ganesh Babu TR, and C. Srinivasan. “Underwater Object Recognition Using KNN Classifier.” International Journal of MC Square Scientific Research 9, no. 3 (2017): 48-52.
- Srinivasan, C., Dubey, S., & Ganeshbabu, T. R. (2015). Complex texture features for glaucoma diagnosis using support vector machine. International Journal of MC Square Scientific Research, 7(1), 81-92.
- Budai, A.; Bock, R.; Maier, A.; Hornegger, J.; Michelson, G. Robust vessel segmentation in fundus images. Int. J. Biomed. Imaging 2013, 2013, 154860.
