Глобальная возмущенность магнитосферы Земли и ее связь с космической погодой

Автор: Куражковская Н.А.
Журнал: Солнечно-земная физика @solnechno-zemnaya-fizika
Статья в выпуске: 1 т.6, 2020 года.
Бесплатный доступ
Исследованы экстремальные состояния глобальной возмущенности магнитосферы: очень спокойное и сильно возмущенное - и их связь с параметрами межпланетной среды. Оценка степени глобальной возмущенности магнитосферы проводилась по месячному и годовому количеству магнитно-спокойных и магнитно-возмущенных дней. Выполнено сравнение циклических и сезонных распределений количества магнитно-спокойных и магнитно-возмущенных дней и проанализирована их связь с параметрами межпланетной среды с 20-го по 24-й циклы солнечной активности. Показано, что максимальное число магнитно-спокойных дней наблюдается на фазе подъема солнечной активности и в сезон зимнего солнцестояния, а максимальное число магнитно-возмущенных дней - на фазе спада солнечного цикла и в сезон равноденствий. Обнаружено аномальное возрастание числа спокойных дней в 24-м цикле солнечной активности по сравнению с предыдущими циклами. Установлено, что циклическая вариация годового числа спокойных и возмущенных дней определяется поведением и величиной скорости, температуры, динамического давления плазмы солнечного ветра и модулем напряженности межпланетного магнитного поля...
Магнитосфера, геомагнитная активность, космическая погода, циклы солнечной активности, магнитно-спокойные и магнитно-возмущенные дни, параметры солнечного ветра
Короткий адрес: https://sciup.org/142224289
IDR: 142224289 | УДК: 550.385 | DOI: 10.12737/szf-61202005
Global disturbance of Earth's magnetosphere and its connection with space weather
This paper deals with extreme conditions of the global magnetosphere disturbance: very quiet and greatly disturbed, and their relationship with interplanetary medium parameters. The degree of global magnetosphere disturbance was estimated from the monthly and annual number of magnetically quiet and magnetically disturbed days. The cyclic and seasonal distributions of magnetically quiet and disturbed days were compared, and their relationship with interplanetary medium parameters in solar cycles 20-24 was analyzed. Magnetically quiet days are shown to be mainly observed at the ascending phase of solar activity and during the winter solstice season. Magnetically disturbed days dominate at the descending phase of the solar cycle and during the equinox season. An anomalously large increase in the number of quiet days was found in solar cycle 24 as compared to previous cycles. It has been established that the cyclic variation in the annual number of quiet and disturbed days is determined by the behavior and magnitude of the speed, temperature, dynamic pressure of solar wind plasma and the interplanetary magnetic field modulus...
Текст научной статьи Глобальная возмущенность магнитосферы Земли и ее связь с космической погодой
Since the mid-1990s, many researchers have begun to actively use the term “space weather”, whose history of origin is described in detail in [Kane, 2006] . This term involves a complex set of conditions in geospace, which are associated with processes occurring on the Sun, in the solar wind (SW), Earth’s magnetosphere and ionosphere [Yermolaev, Yermolaev, 2009] . The solar wind propagating from the solar surface interacts with Earth’s magnetosphere, thereby generating magnetospheric disturbances such as substorms and magnetic storms, classified as geomagnetic effects of space weather. Sporadically occurring solar events — flares, coronal mass ejections (CME) — are considered as the main agents responsible for the development of geomagnetic storms and affecting space weather. Furthermore, geospace conditions may be changed by recurrent high-speed streams (HSS) from coronal holes on the Sun and corotating interaction regions (CIR) of fast and slow SW streams [Borovsky, Denton, 2006; Yermolaev, Yermolaev, 2009] . Space weather is characterized by the alternation of quiet and disturbed periods associated with the manifestation of solar and geomagnetic activity. Note that due to the nonstationarity of the interplanetary magnetic field and SW streams, the magnetosphere is relatively rare in a quiescent state.
The disturbed state of the magnetosphere associated with the development of geomagnetic storms is most actively studied. Experimental studies of magnetic storms have been discussed in numerous papers such as [Loewe, Prolss, 1997; Zhang et al., 2006; Obridko et al.,
2013; Yermolaev et al., 2013; Katus et al., 2015] . Less attention is paid to the quiet magnetosphere: works dedicated to its analysis, e.g. [Shevnin, 2003; Ouattara et al., 2009] , are not as numerous as those studying its disturbed conditions.
The traditional indicators of the degree of the magnetosphere disturbance are geomagnetic activity indices, which distinguish its quiet or disturbed state and are used for qualitative and quantitative estimate of geomagnetic disturbances both at different latitudes of Earth ( Dst , AL , AE , PC ) and on the global scale ( K p , A p , aa , etc.) [Ahluwalia, 2000; Ouattara et al., 2009; Ho-lappa et al., 2014; Tanskanen et al., 2017] .
In addition, the degree of the magnetosphere disturbance is assessed using such a characteristic as the number of magnetically quiet or magnetically disturbed days [Ouattara et al., 2009; Makarov, 2018]. The number of magnetically quiet and magnetically disturbed days is an integral characteristic of the global state of the magnetosphere disturbance, which takes into account disturbances of all types and adequately reflects two extreme states of the magnetosphere: very quiet and strongly disturbed. The quiet or disturbed magnetosphere was analyzed both at short time intervals from several hours to several days and at time intervals comparable to the duration of one solar cycle or exceeding it. From my point of view, the number of magnetically quiet and magnetically disturbed days is a convenient characteristic of the quiet or disturbed magnetosphere in long time intervals. The study of laws of distribution of the number of magnetically quiet and magnetically dis-
This is an open access article under the CC BY-NC-ND license
turbed days in the solar cycle is also of interest from the view point of the state of space weather on the time scales comparable to the solar cycle length or exceeding it. Moreover, such statistics may reflect a change in conditions on the Sun and in SW.
Thus, Ouattara et al. [2009] have examined the dynamics of the number of quiet days over more than 100 years. The primary conclusion that follows from this work is that since the beginning of geomagnetic observations (1868) there is a tendency for the number of quiet days to decrease and, accordingly, for the number of disturbed days to increase by the end of the twentieth century. The dynamics of quiet and disturbed days has not been studied from the maximum of solar cycle 23 to the present day despite the fact that the deep minimum of solar activity in 2008–2009 [Tsurutani et al., 2011] could not but affect the dynamics of the number of quiet days in the first decades of the XXI century. This makes it relevant to study the laws of distribution of the number of magnetically quiet and magnetically disturbed days for the last two decades. Moreover, interplanetary medium parameters responsible for the dynamics of the number of magnetically quiet and magnetically disturbed days in the solar cycle were not analyzed.
Equinoctial maxima of geomagnetic activity have been known from the beginning of the last century [Cor-tie, 1912], and various hypotheses have been put forward for their interpretation. In publications, three hypotheses are most often mentioned: the so-called axial hypothesis [Cortie, 1912] according to which the maximum latitude of helioprojection of Earth during its annual rotation corresponds to the equinox season; the “equinoctial” hypothesis [McIntosh, 1959] relating geomagnetic activity maxima during the equinox to the tilt angle between Earth’s magnetic dipole and the Sun–Earth line; the hypothesis according to which the semiannual variation of geomagnetic activity is controlled by the IMF southward B z component [Russell, McPherron, 1973] .
While the seasonal variation of geomagnetic activity has long been known, laws of the seasonal distribution of the number of magnetically quiet and magnetically disturbed days are almost not discussed in the geophysical literature. An exception is the work [Makarov, 2018] that studies the seasonal distribution of the number of magnetically disturbed days with the daily average geomagnetic index Dst <–100 nT. According to [Makarov, 2018] , the seasonal distribution of the number of strongly disturbed days has two maxima and coincides with the seasonal variation of severe geomagnetic storms. In other words, the seasonal dynamics of the number of magnetically disturbed days is similar to the semiannual variation of geomagnetic activity. The laws of the seasonal variation in the number of magnetically quiet days as a global characteristic of the quiet magnetosphere are not, however, discussed in the literature.
The purpose of this paper is to study cyclic and seasonal variations in the global disturbance of Earth’s magnetosphere from solar cycle 20 to 24 by analyzing the laws of distribution of the number of magnetically quiet and magnetically disturbed days and their relationship with SW and IMF parameters.
EXPERIMENTAL DATA
We have analyzed the period from 1964 to 2018 covering solar cycles 20–24. We have studied two extreme states of the magnetosphere: very quiet and strongly disturbed. The degree of the global magnetosphere disturbance has been assessed from monthly and annual number of magnetically quiet and magnetically disturbed days. To identify the magnetically quiet and magnetically disturbed days, I have used three-hour values of the planetary Kp index from the World Data Center in Kyoto []. The Kp index is known to characterize the global geomagnetic disturbance and reflects the contribution of disturbances of all types. Note that data on the Kp index along with values in three-hour time intervals includes the sum of the Kp index (ΣKp) per day. The Kp sum varies in a wide range (from 0 to 60 or more). We believe that it is the sum of Kp per day that is convenient to use for calculating the number of magnetically quiet and magnetically disturbed days. When forming the list of magnetically quiet and magnetically disturbed days, the following criterion has been used: days were classified as very quiet if ΣKp per day was ∼0–5, and as strongly disturbed if ΣKp per day was >25. I have estimated the number of very quiet and strongly disturbed days for each month and then for the year. Thus, for the analyzed period (55 years), I have collected a sample of 1752 magnetically quiet and 4005 magnetically disturbed days. I ignored moderately disturbed days.
The annual mean Wolf numbers (reflecting the number of sunspots and groups of sunspots), main SW and IMF parameters have been obtained from their 27-day average values presented in the OMNI database [] for the same period. The annual number of storms with sudden and gradual commencements was estimated from geomagnetic storm catalogs taken from the World Data Center on Solar-Terrestrial Physics (Russia) [ storms]
and from the Kakioka Magnetic Observatory (Japan) [].
RESULTS
Dynamics of the number of magnetically quiet and magnetically disturbed days in the solar cycle
Figure 1 depicts the variation in annual mean Wolf numbers ( W ) and the distribution of the annual number of magnetically quiet ( N q ) and magnetically disturbed ( N d ) days for the last five solar cycles (20–24). In addition, Table 1 lists annual mean estimates of the number of magnetically quiet and magnetically disturbed days, and the maximum number of these days for each solar cycle. Figure 1 shows that the variation of the number of both quiet (Figure 1, a ) and disturbed (Figure 1, b ) days is cyclic. The dynamics of the number of quiet and disturbed days does not coincide with the dynamics of the sunspot number. Both magnetically quiet and magnetically disturbed days are, however, observed during certain phases of solar cycles. This peculiarity suggests the cyclic nature of N q and N d . Thus, N q in each solar cycle is maximum
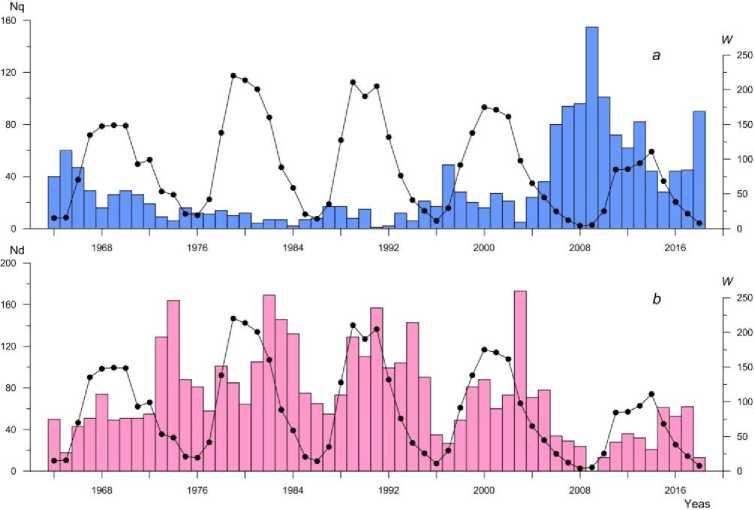
Figure 1. Distribution of the annual number of magnetically quiet ( N q, a ) and magnetically disturbed ( N d, b ) days, and variation in annual mean Wolf numbers ( W , dark circles) in solar cycles 20–24
during the ascending phase of solar activity and it is significantly greater than the annual mean number of quiet days (Table 1). Noteworthy is an anomalously large increase in the number of magnetically quiet days in solar cycle 24 as compared to other cycles. For example, the number of very quiet days in solar cycle 24 has increased more than three times compared to that in cycle 23 and approximately by an order of magnitude compared to cycles 21 and 22. I think that such a jump in the number of very quiet days in solar cycle 24 is unusual because there is no such tendency in solar activity characterized by Wolf numbers. The maximum of Wolf numbers in the period analyzed varies from cycle to cycle, not more than 1.5–2 times.
The variations in the number of quiet days in the solar cycle differ from those in the number of disturbed days. Figure 1, b shows that the distribution of the number of disturbed days in each cycle has two maxima: the first, usually smaller in magnitude, occurs during the ascending phase of solar activity; the second, much larger, during the descending phase of solar activity. This maximum is significantly higher than the annual mean number of magnetically disturbed days in each cycle (Table 1). Thus, the number of disturbed days is significantly larger during the descending phase of solar activity than during the ascending phase, and this tendency is typical for each solar cycle.
Table 1
Annual mean and maximum number of magnetically quiet and magnetically disturbed days in solar cycles 20–24
|
Cycle number |
Annual mean N q per cycle |
Maximum N q per cycle |
Annual mean N d per cycle |
Maximum N d per cycle |
|
20 |
25.8 ± 4.3 |
60 |
69.5 ± 10.8 |
164 |
|
21 |
8.2 ± 1.2 |
14 |
100 ± 12.0 |
169 |
|
22 |
11.6 ± 2.2 |
17 |
99.5 ± 12.1 |
157 |
|
23 |
41.3 ± 9.1 |
49 |
65.6 ± 11.8 |
173 |
|
24 |
72.3 ± 11.8 |
155 |
31.9 ± 6.7 |
62 |
Table 1 shows that the maximum N d , observed during the descending phase of solar activity, is significantly greater than the annual mean number of magnetically disturbed days in each cycle, ~1.6–2.6 times. The latter indicates that the maximum number of magnetically disturbed days during the descending phase of solar activity is no accident. Furthermore, there is a clear tendency for the number of disturbed days in solar cycle 24 to reduce as compared to the previous cycles, ~2–2.5 times.
Seasonal variation in the number of magnetically quiet and magnetically disturbed days
Figure 2 illustrates the seasonal distribution of the number of magnetically quiet ( a ) and magnetically disturbed ( b ) days for 1964–2018. It depicts seasonal variations in the mean number of quiet ( N qmean ) and disturbed ( N qmean ) days for each month and shows standard errors in the mean values. Figure 2, a indicates that the seasonal variation of N q is maximum in winter (December) and minimum in the summer solstice (June). A similar seasonal dynamics is also typical for N qmean . The mean number of magnetically quiet days in December is more than two times larger than that in June; and, as can be seen from Figure 2, a , this difference is statistically significant. Note that the seasonal distribution of the number of quiet days is fundamentally different from the similar distribution of the number of disturbed days, which has two equinoctial maxima (Figure 2, b ). The seasonal variation of N dmean also has spring (March) and autumn (September) maxima. The minimum number of magnetically disturbed days is observed in summer (June). The difference between the equinoctial maxima and the summer minimum in the seasonal variation of N dmean is statistically significant (Figure 2, b ). The obtained seasonal dependence of the number of disturbed days coincides with the similar dependence presented in [Makarov, 2018].
Correlation of the number of magnetically quiet and magnetically disturbed days with the long-term variation of SW and IMF parameters
Disturbed magnetospheric conditions are usually associated with extreme conditions in SW. It is interesting to find a correlation between SW and IMF parameters and the number of quiet (disturbed) days for long periods. To do this, I have compared the annual mean SW and IMF parameters with the annual number of qui-et/disturbed days. I analyzed all main parameters of the interplanetary medium and combinations of the parameters (in the solar-ecliptic coordinate system): SW velocity V ; proton density N and temperature T ; SW dynamic pressure P dyn= p V ( p is the plasma density); IMF B x , B y , B z components; IMF strength modulus B ; IMF latitude 9 (the angle between the vector B and its projection on the plane of the ecliptic); IMF longitude ф (the angle between the B vector projection on the plane of the ecliptic and the IMF B x component); E y component of the SW electric field ( E y = - VB z ); parameter 0 characterizing the ratio of the thermal pressure to the magnetic one ( 0 = NkT/(B /S n ), where k is the Boltzman constant); Alfvén Mach number ( M a = VN 1/2/20 B ). Between the obtained series of annual mean interplanetary medium parameters and the annual number of quiet and disturbed days, I calculated correlation coefficients r , listed in Table 2. In addition, I estimated the correlation coefficient between Wolf numbers W and the number of quiet (disturbed) days (Table 2).
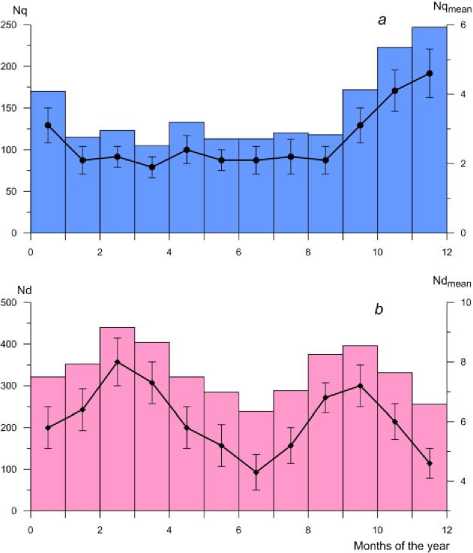
Figure 2. Seasonal dependence of the number of magnetically quiet ( N q, a ) and magnetically disturbed ( N d, b ) days in 1964–2018. Seasonal variations in the mean number of quiet ( N qmean) and disturbed ( N dmean) days for each month are marked with circles and diamonds respectively. Vertical lines indicate standard errors in the mean values
Table 2
Correlation coefficients between the number of magnetically quiet and magnetically disturbed days and SW and IMF plasma parameters
|
Parameters |
N q |
N d |
|
W |
–0.44 |
0.37 |
|
V , km/s |
–0.51 |
0.78 |
|
N , cm–3 |
–0.48 |
0.30 |
|
T , K |
–0.64 |
0.89 |
|
P dyn , nPa |
–0.76 |
0.80 |
|
B , nT x , |
0.09 |
–0.02 |
|
B y , nT |
–0.17 |
0.08 |
|
Bz , nT |
–0.23 |
0.25 |
|
B, nT |
–0.75 |
0.76 |
|
9 , degree |
–0.15 |
0.09 |
|
ф , degree |
0.15 |
–0.11 |
|
E y , mV/m |
0.07 |
–0.12 |
|
P |
0.47 |
–0.46 |
|
M a |
0.46 |
–0.41 |
Note here that the correlation coefficients between N q and W ( r =–0.44), as well as between N d and W ( r =0.37) proved to be relatively low, indicating no significant relationship between the number of magnetically quiet (magnetically disturbed) days and Wolf numbers. From the analysis of Table 2 it follows that the highest correlation coefficients are observed between the number of quiet (disturbed) days and SW plasma parameters such as velocity, temperature, and dynamic pressure. Judging by the correlation coefficients between N q and V ( r =–0.51), N q and T ( r =–0.64), as well as between N d and V ( r =0.78), N d and T ( r =0.89) (Table 2), the correlation between the data series is statistically significant. The correlation coefficients between the number of quiet (disturbed) days and SW dynamic pressure are also high ( r = –0.76 and r = –0.80 respectively). Quite a high correlation is between the number of quiet (disturbed) days and the IMF strength modulus ( r = –0.75 and r = 0.76). Hence, the correlation of N d and N q with P dyn and B is statistically significant (Table 2). Note that the correlation coefficients of the above parameters with the number of disturbed days are slightly higher than with the number of quiet days.
The low correlation coefficients ( r ~0) of the number of quiet (disturbed) days with the IMF B x , B y , B z components and the angles 9 and ф determining the IMF vector orientation clearly indicate the absence of correlation. The low correlation is also observed between the number of quiet (disturbed) days and the SW proton density N . The correlation coefficients between some combinations of the parameters ( E y , 0 , M a ), derived from the main SW parameters, and the number of quiet (disturbed) days are also low and statistically insignificant. Accordingly, the parameters N , E y , 0 , and M a have no effect on the number of quiet and disturbed days. It is characteristic that the number of quiet (disturbed) days correlates better with the main SW and IMF parameters ( V , T , B ) than with their derived parameters ( E y , 0 , M a ).
I will not discuss the dynamics of all the SW parameters used for the correlation analysis of the number of quiet (disturbed) days. For illustrative purposes, I compare the variation of N q and N d with the behavior of V ,
T, Pdyn, and B during the last five solar cycles. Figure 3 depicts variations in the annual number of quiet (a) and disturbed (b) days, and annual mean variations in V (c), T (d), Pdyn (e), and B (f). It clearly shows the antiphase behavior of the annual number of quiet days and V, T, Pdyn, and B parameters. The annual number of disturbed days changes, however, in phase with these parameters. As mentioned above, there are fairly high correlation coefficients between the number of quiet (disturbed) days and these parameters, which indicate that the correlation of Nq and Nd with these parameters is no accident. The effect of these parameters on the variation of the number of quiet (disturbed) days is most pronounced in the transition from cycle 23 to cycle 24. For example, a decrease in Pdyn from 2003 to 2009 by 54 % and a decrease in B for the same period by only 21 % lead to an increase in the number of quiet days more than 30 times. Thus, a decrease in velocity, temperature, dynamic pressure of SW plasma and IMF strength modulus ensures the quietest conditions in the magnetosphere. Conversely, an increase in V, T, Pdyn, and B disturbs the magnetosphere and, accordingly, leads to an increase in the number of magnetically disturbed days. This is also confirmed by the relatively high correlation coefficients between the number of disturbed days and V, T, Pdyn, and B (Table 2).
Thus, according to the correlation coefficients, the cyclic variation in the annual number of quiet and disturbed days is determined by the long-term dynamics and parameters ( V , T , P dyn ) of SW plasma and by the B strength modulus. The IMF vector orientation characterized by angles θ and ϕ , B x , B y , B z components, proton density N , and combination of SW and IMF parameters ( E y , β , M a ) have no effect or little effect on the longterm variation in the number of quiet and disturbed days.
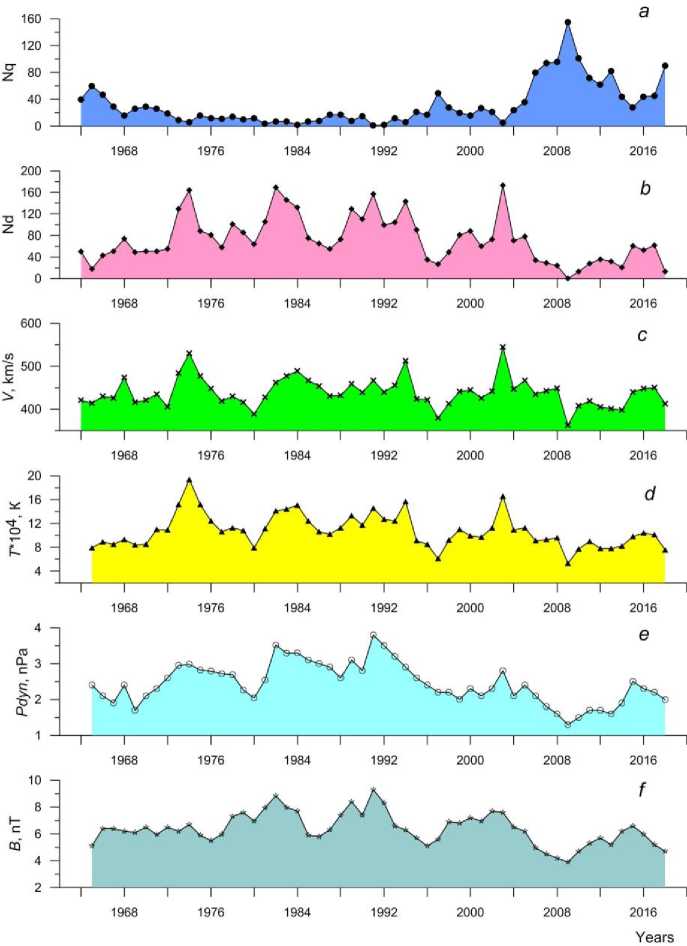
Figure 3. Variations in the annual number of magnetically quiet ( N q, a ) and magnetically disturbed ( N d, b ) days, and the annual mean variations in plasma and IMF parameters V ( c ), T ( d ), P dyn ( e ), and B ( f ) in solar cycles 20–24
DISCUSSION
In the previous sections, I have analyzed cyclic and seasonal variations of the two extreme states of the magnetosphere — very quiet and strongly disturbed. As a characteristic of the global magnetosphere disturbance, I have used the number of magnetically quiet and magnetically disturbed days. From my point of view, long-term variations in the number of quiet and disturbed days reflect the state of space weather for the last five solar cycles. I have also revealed the interplanetary medium factors that control these states at time intervals exceeding the duration of the solar cycle.
The study has shown that the dynamics of the number of quiet and disturbed days varies significantly depending on solar cycle phase and season. Thus, the maximum number of magnetically quiet days is mainly observed during the ascending phase of solar activity and in the winter solstice. The largest number of magnetically disturbed days occurs during the descending phase of solar activity and in the season of equinoxes. It should be noted that the obtained cyclic dynamics of the number of quiet (disturbed) days does not contradict the known cyclic variations in both solar and magnetospheric activity. In contrast to [Ouattara et al., 2009] which observes a tendency for the number of quiet days to decrease and for the number of disturbed days to increase by the end of the twentieth century, in this paper I have revealed the cyclic nature of the dynamics of the number of magnetically quiet and magnetically disturbed days. Moreover, I have detected an anomalous increase in the number of very quiet days in solar cycle 24 as compared to the previous cycles.
The fairly good correlation between the annual number of quiet (disturbed) days and V , T , P dyn indicates that space weather conditions are determined by characteristics of SW plasma. One of the most important factors defining the cyclic variation of the number of quiet (disturbed) days is likely to be the SW velocity, which is in good agreement with the proton temperature and the dynamic pressure [Veselovskii et al., 1998] . Besides, the maximum annual mean values of these parameters fall on the descending phase of solar activity when Earth is exposed to high-speed hot streams from polar coronal holes. It is the descending phase of solar activity during which the largest number of disturbed days is observed (Figure 1, b ). The minimum annual mean V , T , P dyn are observed during the ascending phase of solar activity, coinciding with the dynamics of the number of quiet days (Figure 1, a ).
Along with the velocity and dynamic pressure, the geoeffective parameters include IMF Bz. It is unexpected, however, that the dynamics of the number of magnetically disturbed and magnetically quiet days does not correlate with the variation of IMF Bz in the solar cycle, as indicated by the low correlation coefficients between Nd, Nq and Bz (Table 2). Papitashvili et al. [2000] have shown that the correlation between IMF Bz and geomagnetic activity index Kp, regardless of the Bz sign, is very weak (r < 0.5). This is likely to have an effect on the correlation between the number of magnetically disturbed (magnetically quiet) days and IMF Bz. Furthermore, the geoeffectiveness of IMF Bz essentially depends on the duration and value of southward Bz (Bs) [Zhang, Moldwin, 2014]. For example, the Bs extreme events of <–10 nT lasting for >3 hrs do not always generate geomagnetic storms. Moreover, Zhang, Moldwin [2014] state that the integral duration and the number of Bs events are associated with the sunspot number when Bz<–5 nT. In other words, the Bz dynamics does not exhibit cyclicity characteristic, for example, of the SW velocity or IMF strength modulus, therefore the lack of correlation between the dynamics of Nd, Nq and Bz in time intervals exceeding the duration of the solar cycle is quite predictable.
Seasonal variations of the number of quiet (disturbed) days is probably also related to the seasonal dependence of geoeffective SW parameters. Thus, Nusinov et al. [2015], after analyzing frequency distributions of hourly values of SW velocity, B z events, and CME for seasons in solar cycle 23, have shown that highspeed SW streams with V >500 km/s are more common in summer than in winter and equinox. The distribution of B z events, along with the two equinoctial maxima, exhibits a summer maximum. Besides, CMEs in SW most often occur during the summer solstice [Nusinov et al., 2015] . One of CME species is magnetic clouds [Burlaga et al., 1981] , which generate magnetic storms of different intensities and have a significant impact on the seasonal variation of geomagnetic activity. Geoeffectiveness of magnetic clouds depends on their orientation in space, namely on the tilt angle of their axis to the plane of the ecliptic [Barkhatov et al., 2014] . Thus, during equinox periods geomagnetic activity increases due to a large number of magnetic clouds with small angles of inclination of their axis to the plane of the ecliptic. During solstice periods, such magnetic clouds are not geoeffective [Barhatov et al., 2014] . Consequently, magnetic clouds of specific configuration, along with other geoeffective SW structures, contribute to the equinoctial maxima of the number of magnetically disturbed days. Using the results obtained by Nusinov et al. [2015] who have confirmed the existence of equinoctial and summer maxima, I can suppose that the geoeffectiveness of SW streams in winter is lower than in summer and equinox. The probability of observing magnetically quiet days in winter can significantly increase. In this regard, the fact that the maximum number of quiet days is observed in winter becomes understandable (Figure 2, a ). Thus, the statistically significant summer maximum of geomagnetic activity first discovered in [Nusinov et al., 2015] does not manifest itself in the seasonal dependence of the number of magnetically disturbed days (Figure 2, b ); rather it coincides with the minimum number of quiet days in the summer solstice (Figure 2, a ).
The equinoctial maxima of disturbed days (Figure 2, b) certainly reflect the seasonal variation of the SW velocity, the number of Bz events and geomagnetic storms [Zhang et al., 2006; Vijaya Lekshmi et al., 2011; Nusinov et al., 2015]. The presence of the two equinoctial maxima in the seasonal variation of the number of magnetically disturbed days may be explained by any of the known hypotheses or their combination [Cortie, 1912; McIntosh, 1959; Russell, McPherron, 1973].
Reeves et al. [2013] , who analyze the long-term variation of the SW velocity, have observed that the years with a high mean SW velocity include a larger number of days with a high velocity and a smaller number of days with a low velocity. Indeed, if the annual mean SW velocity affects the annual number of quiet (disturbed days), in the years with a high mean velocity there should be a larger number of disturbed days and a smaller number of quiet days. For example, Figure 3, c shows that 1994 and 2003 are years with a high annual mean SW velocity ( V > 500 km/s). In those years there were a larger number of disturbed days (143 and 173 respectively) than quiet (6 and 5 respectively) ones. In 1997 and 2009, the annual mean SW velocity was low ( V < 400 km/s). The years exhibit a larger number of quiet (49 and 155 respectively) and a smaller number of disturbed (27 and 0 respectively) days. Following [Reeves et al., 2013], we can note that it is the annual number of days with a high or low SW velocity that determines the long-term trend in the number of quiet (disturbed) days.
Geomagnetic storms are one of the main factors of space weather. Storms with sudden or gradual commencement are distinguished by the source on the Sun and in SW. According to [Obridko et al., 2013] , storms with sudden commencement are driven by CMEs. The source of storms with gradual commencement is highspeed SW streams from coronal holes — HSS. CME and HSS, which cause global magnetospheric disturbances, affect the intensity and duration of geomagnetic storms [Hutchinson et al., 2011] . During the ascending phase and solar maximum, CME streams prevail; during the descending phase, geomagnetic activity is largely determined by HSS [Holappa et al., 2014] . Given this, we can assume that the first, low maximum in the variation of the number of disturbed days during the ascending phase of solar activity (Figure 1, b ) is associated with CME; and the second, much higher maximum of N d during the descending phase of solar cycle, with HSS.
This assumption is confirmed by the comparison between the annual number of quiet (disturbed) days and the number of magnetic storms with sudden and gradual commencement in the solar cycle. Figure 4 illustrates the distribution of Wolf numbers (a), the dynamics of Nq (b) and Nd (c), and the variation of the number of the geomagnetic storms of above two types (d). I have chosen a number of geomagnetic storms for 1964–2010 from []; after 2010, from [ obsda-ta/dataviewer/]. The storm statistics includes all storms regardless of intensity — I have selected them only according to the character of commencement (sudden or gradual). Figure 4, c, d indicates that in nearly each solar cycle the first low maxima in the variation of the number of disturbed days correspond to the maxima of the number of storms with sudden commencement. At the same time, the second maxima of the number of disturbed days in each cycle coincide more closely
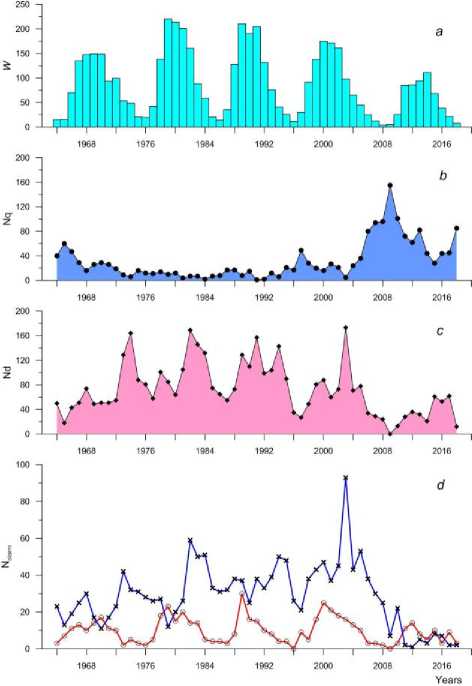
Figure 4. Distribution of Wolf numbers W (a) and variations of the annual number of magnetically quiet (Nq, b) and magnetically disturbed (Nd, c) days, and the number of geomagnetic storms (Nstorm, d). Storms with sudden and gradual commencements are marked with open circles and crosses respectively with the maxima of storms with gradual commencement.
The correlation analysis shows that long-term variations in both Nq and Nd more closely correlate with the number of storms with gradual commencement. The correlation coefficients between Nq, Nd and Nstorm with gradual commencement are –0.50 and 0.70 respectively. The correlation coefficients between Nq, Nd and Nstorm with sudden commencement are, however, much lower: –0.37 and 0.35 respectively. This fact also suggests that the dynamics of the annual number of quiet (disturbed) days is mainly determined by recurrent high-speed SW streams from coronal holes. Moreover, over the period analyzed, as inferred from the catalogs, the number of storms with gradual commencement (associated with coronal holes) is about three times larger than the number of storms with sudden commencement (driven by flares and CME). Hence, the main contribution to the magnetospheric disturbance level during the descending phase of solar activity is made by recurrent HSS. The number of magnetically disturbed days, therefore, dominates during the descending phase of solar activity as compared to the ascending phase. The fact that the number of quiet days is larger during the ascending phase of solar activity indicates that during this phase the contribution of HSS to geomagnetic activity is much smaller, and the number of magnetic storms with gradual commencement is much smaller too.
It should be noted that the substorms that contribute to the global magnetosphere disturbance are also classified as geomagnetic effects of space weather. According to statistical studies of substorms, e.g., [Newell et al., 2013; Chu et al., 2015; Newell et al., 2016] , the maximum number of substorms is observed during the descending phase of solar activity and in the equinox season. One of the main parameters of the interplanetary medium determining the occurrence of substorm activity is the SW velocity speed with an increase in which the probability of the occurrence of substorms increases [Newell et al., 2016] . According to terms used in [Despirak et al., 2019] , “extended substorms” as an analog to classical substorms generally occur during HSS [Despirak et al., 2019] . Thus, the cyclic and seasonal behaviors of substorms, due to their interaction with high-speed SW streams, largely coincide with the statistics of geomagnetic storms.
Besides SW plasma parameters, the cyclic variation of the number of quiet (disturbed) days is significantly affected by the IMF strength modulus and its dynamics (Figure 3, f ). Note that from 1998 (solar cycle 23) there is a tendency for the sunspot magnetic field strength to decrease [Penn, Livingston, 2010] , which continues in solar cycle 24. A consequence of the low solar magnetic field is a decrease in IMF. The combination of the low SW velocity (and hence weak dynamic pressure) with the low IMF strength modulus and small B z variations [Tsurutani et al., 2011] is most likely to lead to the anomalous increase in the number of quiet days in solar cycle 24 as compared to the previous cycles.
The fact that the anomalous increase in the number of magnetically quiet days could be caused by a significant decrease in the IMF strength modulus and SW dynamic pressure (as a combination of the SW plasma velocity and density) is confirmed by Figure 5, which shows the annual number of magnetically quiet days as a function of annual mean B and P dyn . We can see that a decrease in the mean values of both B and P dyn leads to an increase in the annual number of magnetically quiet days. These dependences are best approximated by exponential functions with fairly high correlation coefficients, which indicate the non-linear nature of the impact of the interplanetary medium on the global magnetospheric disturbance.
As noted above, there is no correlation between the number of quiet (disturbed) days and Wolf numbers. We can assume that the fundamental role in the increase
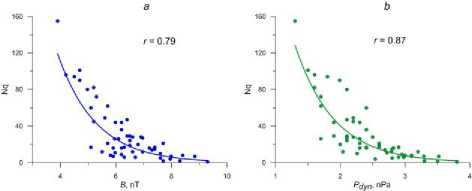
Figure 5. Annual number of magnetically quiet days versus annual mean IMF strength modulus ( a) and SW dynamic pressure ( b )
in the number of quiet days in solar cycle 24 is played not by the sunspot number and groups of sunspots but by the decrease in their magnetic field strength with time [Penn, Livingston, 2010] . It is possible that the processes occurring inside the Sun [McIntosh et al., 2019] also cause solar activity to go down and yield the observed effect of the increasing number of quiet days. In turn, the tendency for solar and geomagnetic activity to decrease from solar cycle 19 to 24 may be associated with the minimum of the 200-year solar cycle approaching (2050–2060) [Gvishiani et al., 2015] . Thus, the statistics of magnetically quiet and magnetically disturbed days reflecting the change in SW and IMF parameters and, consequently, processes on the Sun may be used for space weather forecast.
CONCLUSION
The paper has shown that as a characteristic of extreme conditions of the global magnetosphere disturbance (very quiet and strongly disturbed) for periods comparable to the 11-year solar cycle or exceeding it we can take the number of magnetically quiet and magnetically disturbed days. The dynamics of magnetically quiet and magnetically disturbed days depends on the solar cycle phase, season, and space weather. The maximum number of magnetically quiet days is mainly observed during the ascending phase of solar activity and during the winter solstice. The maximum number of magnetically disturbed days occurs during the descending phase of solar activity and during equinoxes. An anomalously large increase in the number of magnetically quiet days has been found in solar cycle 24 as compared to the previous cycles. The variation in the annual number of quiet (disturbed) days in the solar cycle has been shown to depend on the behavior and magnitude of the speed, temperature, SW plasma dynamic pressure, and IMF strength modulus. The laws of the long-term variation in the number of quiet (disturbed) days and their relation with SW and IMF parameters can be used for space weather forecast.
I thank the creators of the databases and catalogs of geomagnetic storms the World Data Centre for Geomagnetism (Kyoto), Goddard Space Flight Center (NASA, USA), and World Data Center for Solar-Terrestrial Physics (Moscow) for providing the data, as well as B.I. Klain for discussion of the results.
The work was performed under the theme “The impact of cosmic factors on the development of extreme processes in Earth’s magnetosphere” State Task No. 0144-2014-00116.
Список литературы Глобальная возмущенность магнитосферы Земли и ее связь с космической погодой
- Бархатов Н.А., Ревунова Е.А., Виноградов А.Б. Проявление ориентации магнитных облаков солнечного ветра в сезонной вариации геомагнитной активности // Космические исследования. 2014. Т. 52, № 4. С. 286-295. DOI: 10.7868/S0023420614040025
- Веселовский И.С., Дмитриев А.В., Суворова А.В. Средние параметры солнечного ветра и межпланетного магнитного поля на орбите Земли за последние три цикла // Астрономический вестник. 1998. Т. 32, № 4. С. 352-358.
- Гвишиани А.Д., Старостенко В.И., Сумарук Ю.П., и др. Уменьшение солнечной и геомагнитной активности с 19-го по 24-й цикл // Геомагнетизм и аэрономия. 2015. Т. 55, № 3. С. 314-322. DOI: 10.7868/S0016794015030098
- Дэспирак И.В., Любчич А.А., Клейменова Н.Г. Разные типы потоков солнечного ветра и суббури в высоких широтах // Геомагнетизм и аэрономия. 2019. Т. 59, № 1. С. 3-9. DOI: 10.1134/S001679401901005X
- Ермолаев Ю.И., Ермолаев М.Ю. Солнечные и межпланетные источники геомагнитных бурь: аспекты космической погоды // Геофизические процессы и биосфера. 2009. T. 8, № 1. С. 5-35.
- Макаров Г.А. Гелиоширотные закономерности магнитно-возмущенных дней со среднесуточным значением геомагнитного индекса DstСолнечно-земная физика. 2018. Т. 4, № 3. С. 28-32.
- DOI: 10.12737/szf-43201803
- Нусинов А.А., Руднева Н.М., Гинзбург Е.А., Дремухина Л.А. Сезонные вариации статистических распределений индексов геомагнитной активности // Геомагнетизм и аэрономия. 2015. Т. 55, № 4. С. 511-516.
- DOI: 10.7868/S0016794015040100
- Обридко В.Н., Канониди Х.Д., Митрофанова Т.А., Шельтинг Б.Д. Солнечная активность и геомагнитные возмущения // Геомагнетизм и аэрономия. 2013. Т. 53, № 2. С. 157-166.
- DOI: 10.7868/S0016794013010148
- Шевнин А.Д. Интервалы геомагнитного спокойствия по индексам Kp // Геомагнетизм и аэрономия. 2003. Т. 43, № 2. С. 225-230.
- Ahluwalia H.S. Ap time variations and interplanetary magnetic field intensity // J. Geophys. Res. 2000. V. 105, N A12. P. 27,481-27,487.
- DOI: 10.1029/2000JA900124
- Borovsky J.E., Denton M.H. Differences between CME-driven storms and CIR-driven storms // J. Geophys. Res. 2006. V. 111, A07S08.
- DOI: 10.1029/2005JA011447
- Burlaga L.F., Sittler E., Mariani F., Schwenn R. Magnetic loop behind an interplanetary shock: Voyager, Helios, and IMP 8 observations // J. Geophys. Res. 1981. V. 86. P. 6673-6684.
- Chu X., McPherron R. L., Hsu T.-S., Angelopoulos V. Solar cycle dependence of substorm occurrence and duration: Implications for onset // J. Geophys. Res: Space Phys. 2015. V. 120. P. 2808-2818.
- DOI: 10.1002/2015JA021104
- Cortie A.L. Sunspot and terrestrial magnetic phenomena, 1898-1911 // Mon. Not. R. Astron. Soc. 1912. V. 73. P. 52-60.
- Holappa L., Mursula K., Asikainen T. A new method to estimate annual solar wind parameters and contributions of different solar wind structures to geomagnetic activity // J. Geophys. Res: Space Phys. 2014. V. 119. P. 9407-9418.
- DOI: 10.1002/2014JA020599
- Hutchinson J.A., Wright D.M., Milan S.E. Geomagnetic storms over the last solar cycle: A superposed epoch analysis // J. Geophys. Res. 2011. V. 116, A09211.
- DOI: 10.1029/2011JA016463
- Kane R.P. The idea of space weather - a historical perspective // Adv. Space Res. 2006. V. 37. P. 1261-1264.
- DOI: 10.1016/j.asr.2006.01.014
- Katus R.M., Liemohn M.W., Ionides E.L., et al. Statistical analysis of the geomagnetic response to different solar wind drivers and the dependence on storm intensity // J. Geophys. Res: Space Phys. 2015. V. 12. P. 310-327.
- DOI: 10.1002/2014JA020712
- Loewe C.A., Prӧlss G.W. Classification and mean behavior of magnetic storms // J. Geophys. Res. 1997. V. 102, N A7. P. 14209-14213.
- DOI: 10.1029/96JA04020
- McIntosh D.H. On the annual variation of magnetic disturbance // Philos. Trans. Roy. Soc. London. Ser. A. 1959. V. 251. P. 525-552.
- McIntosh S.W., Leamon R.J., Dikpati M., et al. What the sudden death of solar cycles can tell us about the nature of the solar interior // Solar phys. V. 294, N 88. 2019.
- DOI: 10.1007/s11207-019-1474-y
- Newell P. T., Gjerloev J. W., Mitchell E. J. Space climate implications from substorm frequency // J. Geophys. Res: Space Phys. 2013. V. 118. P. 6254-6265.
- DOI: 10.1002/jgra.50597
- Newell P.T., Liou K., Gjerloev J.W., et al. Substorm probabilities are best predicted from solar wind speed // J. Atmos. Solar-Terr. Phys. 2016. V. 146. P. 28-37.
- DOI: 10.1016/j.jastp.2016.04.019
- Ouattara F., Amory-Mazaudier C., Menvielle M., et al. On the long term change in the geomagnetic activity during the 20th century // Ann. Geophys. 2009. V. 27. P. 2045-2051.
- DOI: 10.5194/angeo-27-2045-2009
- Papitashvili V.O., Papitashvili N.E., King J.H. Solar cycle effects in planetary geomagnetic activity: Analysis of 36-year long OMNI dataset // Geophys. Res. Lett. 2000. V. 27, N 17. P. 2797-2800.
- DOI: 10.1029/2000GL000064
- Penn M.J., Livingston W. Long-term evolution of sunspot magnetic fields // Proc. IAU Symp. ʼʼThe Physics of Sun and Star Spotsʼʼ. 2010. V. 273. P. 126-133.
- Reeves G., Morley S., Cunningham G. Long-term variations in solar wind velocity and radiation belt electrons // J. Geophys. Res: Space Phys. 2013. V. 118. P. 1040-1048.
- DOI: 10.1002/jgra.50126
- Russell C.T., McPherron R.L. Semiannual variation of geomagnetic activity // J. Geophys. Res. 1973. V. 78. P. 92-108.
- Tanskanen E.I., Hynönen R., Mursula K. Seasonal variation of high-latitude geomagnetic activity in individual years // J. Geophys. Res: Space Phys. 2017. V. 122. P. 10,058-10,071.
- DOI: 10.1002/2017JA024276
- Tsurutani B.T., Echer E., Gonzalez W.D. The solar and interplanetary causes of the recent minimum in geomagnetic activity (MGA23): a combination of midlatitude small coronal holes, low IMF Bz variances, low solar wind speeds and low solar magnetic fields // Ann. Geophys. 2011. V. 29. P. 839-849.
- DOI: 10.5194/angeo-29-839-2011
- Vijaya Lekshmi D., Balan N., Tulasi Ram S., Liu J.Y. Statistics of geomagnetic storms and ionospheric storms at low and mid latitudes in two solar cycles // J. Geophys. Res. 2011. V. 116, A11328.
- DOI: 10.1029/2011JA017042
- Yermolaev Y.I., Lodkina I.G., Nikolaeva N.S., Yermolaev M.Y. Occurrence rate of extreme magnetic storms // J. Geophys. Res: Space Phys. 2013. V. 118. P. 4760-4765.
- DOI: 10.1002/jgra.50467
- Zhang J.-C., Liemohn M.W., Kozyra J.U., et al. A statistical comparison of solar wind sources of moderate and intense geomagnetic storms at solar minimum and maximum // J. Geophys. Res. 2006. V. 111. A01104.
- DOI: 10.1029/2005JA011065
- Zhang X.-Y., Moldwin M.B. The source, statistical properties, and geoeffectiveness of long-duration southward interplanetary magnetic field intervals // J. Geophys. Res: Space Phys. 2014. V. 119. P. 658-669.
- DOI: 10.1002/2013JA018937
- URL: http://swdcwww.kugi.kyoto-u.ac.jp/index.html (дата обращения 30 января 2019 г.).
- URL: http://www.wdcb.ru/stp/data/storms/mag-netic_storms/ (дата обращения 16 января 2019 г.).
- URL: http://www.kakioka-jma.go.jp/obsdata/dataviewer/ (дата обращения 16 января 2019 г.).
- URL: http://omniweb.gsfc.nasa.gov/ow.html (дата обращения 30 января 2019 г.).
