gSemSim: Semantic Similarity Measure for Intra Gene Ontology Terms

Автор: Muhammad Naeem, Saira Gillani, Muhammad Abdul Qadir, Sohail Asghar
Журнал: International Journal of Information Technology and Computer Science(IJITCS) @ijitcs
Статья в выпуске: 6 Vol. 5, 2013 года.
Бесплатный доступ
Gene Ontology (GO) is an important bioinformatics scheme to unify the representation of gene and gene product attributes across all species. Measuring similarity or distance between GO terms is a key step for determining hidden relationship between genes. The notion of similarity between GO terms is a usual step in knowledge discovery related tasks. In literature various similarity measures between GO terms have been proposed. We have introduced a novel similarity measure scheme to improve three conventional similarity measures to reduce their limitations. The salient feature of the proposed GO Semantic Similarity (gSemSim) measure is its ability to show more realistic similarity between concepts in perspective of domain knowledge. A comparative result with other technique has also been presented that showing an improved contextual meaning of the proposed semantic similarity. This study is expected to assist the community of bio informaticians in the selection of better similarity measure required for correct annotations of genes in gene ontology.
Semantic Similarity Measures, Intra-Ontology Similarity, Gene Annotation
Короткий адрес: https://sciup.org/15011910
IDR: 15011910
Текст научной статьи gSemSim: Semantic Similarity Measure for Intra Gene Ontology Terms
Published Online May 2013 in MECS
P The notion of similarity measure for Gene Ontology (GO) terms is an important step towards knowledge discovery in bioinformatics domain data. GO is developed by the identification of genome elements and by marking biological information of the elements on the genomes [1]. GO is organized as a directed acyclic graph where each term has defined relationships to one or more other terms in the same domain or to other domains. GO contains three orthogonal taxonomies or aspect, that hold terms describing the attributes of molecular function, biological process and cellular component for a gene product. Molecular function based GO is related to the investigation of genomic elemental activities of a gene with the scope of molecular level. It also involved regulation and interactions expression. Binding or catalysis is a notable example of molecular function in GO. The cellular component in GO is mostly concerned with organelles and their structure within cell and extracellular environment. The biological process in GO is related to the operational activities within tissues, organism and cells.
Gene ontology is originally based on annotations (manual or electronic) and classification of the domain specific terms. The huge volume of information related to gene has motivated scientist to exploit the computational techniques to build electronic annotations in a faster way. However, software tools are not sufficient for such purpose therefore expertise of human with domain knowledge may also be an inevitable and additional requirement for gene annotation. Manual annotation of genes is primarily an area of human expertise of the relevant domain. This kind of annotation is also known as curation [2]. On the other hand, electronic annotation is performed by computing tools. None of the approach is sufficient if performed independently. The reason behind this fact is that both of the techniques are complementary to each other in the same annotation series of processes. To perform electronic annotations, a variety of software tools has been developed and is in use. Some notable PSI-BLAST [3], tools include FatiGO tool which address the distribution of GO terms for two sets of genes [4]; decision tree based phenotype annotation extration tool [5]; Similarity score with PSI-BLAST [6]. All of these approaches are limited to only GO annotation and did not include semantic similarity. Human Genome Project [7] is a notable project in this context. In this project the genome sequences of a lot of organism including human have been completed. However there is still a lot more to be investigated.
Validation of electronic annotations is made by their matching to manual annotations exactly or to their corresponding ancestors. The level of match or similarity corroborates the correctness of electronic annotations.
Measuring similarity or distance between gene annotations is a mandatory requirement for calculating the correlation between genes. This helps in gene expression as well as gene classification. There are a number of similarity measuring techniques to infer the correlation between GO terms [2]. Assessment of semantic similarity enables not only to infer knowledge but also sort out items according to their respective classes. Such similarities measures are significant when it is difficult to extrapolate the prominent and relevant properties of GO terms. Keeping in view the role of semantic similarity in various domains, some models have been proposed [8]. Some notable models related to our study include geometric and feature-based models. The geometric models are related to the metric space organized into different dimension. On the other hand, the feature based models corroborate characteristics of objects while considering similarity as a function of disjunctive and common features [8].
A number of measures [9, 10, 11, 2] were introduced to incorporate the similarity between ontologies defined by various kinds of description logics; however they had not been able to address the expressivity of actual context between two concepts. Based on the literature review investigated, our study is focused towards introduction of a new semantic similarity measure. We have improved semantic similarity measures proposed by Resnik et al., [9], and Lin et al, [11]. In this study, we have also presented a qualitative and quantitative comparative evaluation of our proposed measure to semantic similarity measure GraSM demonstrated by Cuoto et al. [9] which is a graph based common disjunctive ancestor semantic similarity measure. Major challenge in our study is to improve the identification of the similarity between GO terms. This study is expected to assist the community of bio informatics in selection of the best similarity measure for manual or electronic annotations of genes producing gene ontology.
We can divide the evaluation of the similarity measure techniques for GO in two dimensions: Coherent and Incoherent. The first dimension evaluates ontology design and its potential for finding and calculating the information content of all the common ancestors between two terms in rich knowledge representation. The second dimension (Incoherent) evaluates the information content of non common parents of both the terms within the directed acyclic graph of ontology. We set the benchmark for the verification of similarity measure techniques of GO terms. While considering the ontology as a directed acyclic graph, our interest lies in comparison of two concepts at a time (pair-wise comparison). Our process for the evaluation consists of following four activities:
-
1. Determine all the parent nodes of the two concepts whose similarity measurement is required.
-
2. Compute the information content of the common ancestors to show the coherence between the
-
3. Calculate the information content based on the number of non common ancestors of both the terms representing the incoherence between the concepts.
-
4. Inference on the ratio of the common ancestors to non common ancestors for the computation of the similarity.
concepts.
The contribution of our study includes analysis and comparison of four schemes for pair wise semantic similarity measure of GO terms as per the benchmark. We performed the analysis on a sample dataset taken from GO [1]. Our analysis indicates that the proposed scheme, gSemSim , outperforms the existing schemes.
The rest of the paper is organized in five sections. In section 2, we have identified characteristics and mathematical formulation of various similarity measures relevant to this study. In section 3, we have mentioned related work in literature review of semantic similarity measures. We then introduce gSemSim , our proposed measure in section 4. For validation, we illustrated our experimental setup and evaluation methodology and its results in comparison to other measures on a sample gene ontology data set in Section 5 followed by concluding remarks in section 6.
-
II. Case Study for Evaluation
As given in the literature, some of the tools have been developed based upon the schemes. In these projects, majority of the similarity measures have been exploited the semantic network-like representation of the ontology which is a directed acyclic graph; we also have focused on this graph structure representation as shown in Fig. 1.
In order to give a detailed insight into the problem formulation mentioned in the previous section, we evaluated the semantic similarity measures for four terms tested in five pairs. The rationale behind this small data set was the objective to highlight the problems associated with other techniques mentioned in the literature. The same evaluation technique can be applied to a larger data set as well. The Fig. 1 is a part of gene ontology taken from GO [1]. The part of this
DAG under experiment is related to muscular development concepts and its hierarchies. The array of this information content is subjected to the calculation of the Share between two concepts. Cuoto et al. [2] has formally defined these terminologies such as:
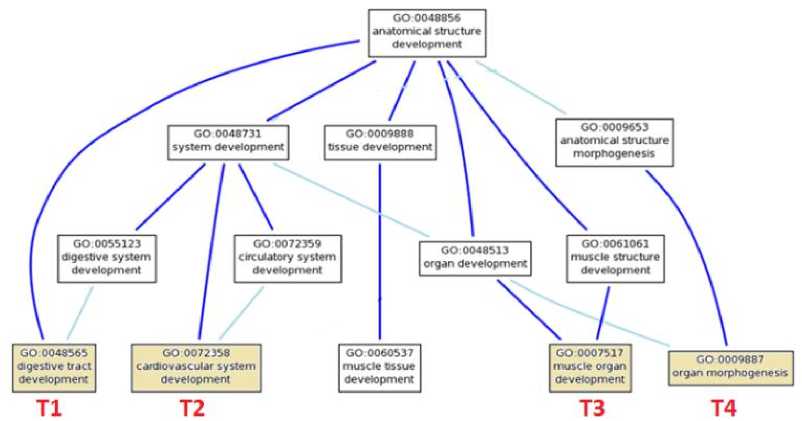
Fig. 1: Part of subgraph of GO terms. [1]
Frequency of a concept, C , is determined by number of decedents of C including the concept itself. This denotes that frequency of a concept at higher level of DAG is higher as compared to their descendant. This value would be one for each of the leaf node concept. In the formal way, the frequency can be stated as follows in equation (1):
Freq (C) = ^ {Occur (C) | C e Anc (C)}
The root node of each DAG will have the highest frequency. The probability of a concept would be a ratio between frequencies of the concept to the max frequency as defined in equation (2). This eventually result range of probability between 0 and 1.
Pr ob ( C) = Freq ( C )/max Freq
Information Content (IC) is measured by taking logarithmic value of probability of a concept as given in equation (3). The negative sign is used to convert the log value into positive because negative information content is meaningless and every number smaller than 1 always deliver negative value on taking its logarithm.
IC (C) = - Log (Pr ob (C)) (3)
The equation (3) shows that higher the probability, lower will be the information content. So the information content of root node would always be zero. Common Ancestors is merely an intersection between sets of ancestors of both of the concepts C 1 and C 2 as given in the following equation (4).
CommonAnc (C, C2) =
Anc ( C) n Anc (C2)
Share of IC is calculated by taking the highest information content value among all of the common ancestors. This value is a foundation for determination of semantic similarity measure.
Share( C, C2) =Max{IC(a) | a e CommonAnc(C, C2)} ^^
Table 1: Statistical Information of Subgraph of GO Terms
|
GO Term |
Freq |
Probability |
IC |
|
GO:0048856 |
13 |
1 |
0 |
|
GO:0048731 |
8 |
0.615384615 |
0.700439718 |
|
GO:0009888 |
2 |
0.153846154 |
2.700439718 |
|
GO:0009653 |
2 |
0.153846154 |
2.700439718 |
|
GO:0055123 |
2 |
0.153846154 |
2.700439718 |
|
GO:0072359 |
2 |
0.153846154 |
2.700439718 |
|
GO:0048513 |
3 |
0.230769231 |
2.115477217 |
|
GO:0061061 |
2 |
0.153846154 |
2.700439718 |
|
GO:0048565 |
1 |
0.076923077 |
3.700439718 |
|
GO:0072358 |
1 |
0.076923077 |
3.700439718 |
|
GO:0060537 |
1 |
0.076923077 |
3.700439718 |
|
GO:0007517 |
1 |
0.076923077 |
3.700439718 |
|
GO:0009887 |
1 |
0.076923077 |
3.700439718 |
Table 1 is the tabulated format of the Fig. 1. It shows the various gene ontology terms annotated along with other statistical data. Frequency, Probability and Information Content (IC) for each GO term has been computed using equation (1, 2 and 3). We have selected four terms GO:0048565, GO:0072358, GO:0007517 and GO:0009887 for which we are to compute the pairwise similarity measure applying all the techniques. We shall identify these GO terms as T1, T2, T3, and T4 respectively.
The go term (T4) GO:000988 organ morphogenesis can be described as the process in which anatomical structures are generated and organized [1]. Muscle Organ Development which is shown by accession number GO:0007571 (T 3 ) is the process responsible for causing cellular metabolism. This causes the reduction in the protein synthesis ability of a cell [1]. The term (T 1 ) GO:0048565 is related to gut development. While the term (T 2 ) GO:0072358 cardiovascular system development is related to the process with specific outcome of cardio related organ from its initial formation to mature state.
-
III. Related Work
Resnik et al., [9] proposed semantic similarity measures which explored the information content of the most informative common ancestor. In this technique the similarity measure was much related to the molecular function GO annotations. They argued that this similarity measure is quite simple like the edge counting method while non sensitive to the problem of changing link distances. Moreover they described that their similarity measure has a provision of adaptation of static knowledge structures to various contexts. The similarity as shown in following equation (6) is the simplest share formula for the information content of two concepts.
Sim Resnik ( Ci, C2) Share ( Ci, C2)
Jiang et al. [10] defined a semantic similarity measure which was incorporated on distance measure. This distance measure was aimed towards calculating the difference between the information content of the concepts and the information content of their most informative common ancestor. Given two concepts C1 and C 2 , semantic similarity proposed by Jiang and Conrath is determined by the reciprocal value of distance measure between two concepts as depicted by the following equation (7).
Distjc ( Ci, C2) =
IC (C ) + IC (C2) - 2 X Share( Q, C2) (7)
The equation (7) shows the distance between two concepts which involves the IC values of each of the concept and share information content of both of the concepts. Equation (8) calculates the similarity value between two concepts which is indirectly calculated by means of distance between these concepts.
Simjc ( C i , C 2 ) = - 1 DiStJc ( C i , C 2 ) + 1
Lin et al., [11] defined a semantic similarity measure which is the ratio of the information content of the most informative common ancestor to the information content of both the concepts. Lin described semantic similarity as the ratio between Common Share of information content to information content of each of the concepts C1 and C2 formally described by the equation (9).
Sim ( C i , C 2 ) =
2 x Share ( C , C 2) x [ IC ( C ), IC ( C 2 )]-1 (9)
Cuoto et al. [2] proposed a graph based similarity measures which serve as an extension to the Lin, Resnik, Jiang and Conrath’s measures. They also argued that finding a disjunctive common ancestor leads to reveal that at least one of the terms has unique interpretation in comparison to the other terms. Such calculations turn these terms less similar. GraSM [2] considers the less informative common ancestor resulting in lower similarities than the original . It was discussed in literature that Couto inquired into the value of share which plays a pivoted role in computation of semantic similarity between two concepts. They described that by taking in account the less informative common ancestor, GraSM yields lower value of similarity as compared to the original measures. They presented it formally as in the following equation (10):
ShareGraSM ( Ci, C2) ={IC(a) | a e CommonDisJAnc(Cx, C2)} ^^^
They also argued that Resnik’s measure attained substantial correlation in the molecular function prospects but exhibiting feeble correlation in the aspects of biological process. They concluded that the reason behind this non uniformity was high GO similarity between pair of protein with low sequence similarity; moreover proteins exhibiting same biological role do not ineluctably share similar sequence.
Hirst et al., [12] introduced the idea of similarity relatedness known as Hirst and St-Onge measure which is based upon the computation of the path length in a graph. They described that if the synonym sets of two concepts are connected by a path in the graph then it implies that both of the concepts have relatedness to each other. The degree of similarity lies in the length of the path. The shorter the path, the more closer both of the concepts are to each other. They also described that the path which alters its direction too often denote less similarity relatedness between two concepts. However, if we investigate Hirst and St-Onge measure in context of gene ontology, its effectiveness is arguable because in gene ontology most of the concepts are forming large number of paths while exhibiting alteration in paths many a times. The long path can enables the domain expert more effectively to infer their relatedness with other terms. So it can be argued that Hirst and St-Onge measure may be effective in other domain but not in gene ontology.
Amir et al., [13] proposed a technique to compute distance between two attribute values with same attribute in unsupervised learning where unexpected outcome emanate out of unknown origins of information. They highlighted that similarity between two attributes is primarily a function of their affiliation with other attributes. They showed that computational cost of determining similarity between two attribute values is linear with respect to volume of data object set. They examined their distance measure with K-mode clustering algorithm over categorical data objects. Ganti et al. [14] illustrated the concept of similarity for categorical data objects. They described it formally as follows:
Let x ,x ∈ A ∧ y ∈ A
If ( x , y ) and ( x , y ) are strongly related then it implies that both x , x are similar with reference to Ak
Pesquita et al., [15, 16] demonstrated that the evaluation of similarity measures in domain of gene ontology is an exigent but tough task due to non existence of any common standard of evaluation. They presented an online tool CESSM for the automated evaluation of gene ontology based on semantic similarity measures. They described that this tool can make a comparison based on the sequence, protein family and enzyme class similarity. Pesquita et al., [15, 16] argued that despite availability of many semantic similarity measures being used in the domain of gene ontology, it is not strongly evident which one of them is best suited for the gene products annotation. They also pointed out that it is still much debatable in the research community on the validity of electronic annotation in context of semantic similarity calculations. They also illustrated that the relationship between sequence similarity and semantic is non linear while it can be approximated by means of a rescaled normal cumulative distribution function.
Rodr´ıguez and Egenhofer [17] introduced matchingdistance similarity measure for evaluating semantic similarity in recognition of geographical objects. Their technique was based on idea of feature based classes with contextual considerations. They claim that their results show good correlation with domain expert’s evaluation of the concepts. Lord et al., [18 19] inquired into the effectiveness of the semantic similarity measures on gene ontology. Their study was a comparison between GO similarity and their related sequence similarity. They demonstrated that both of these similarities are related to each other in a biological domain. However it can be argued that their claim was not consistent for various prospects of gene ontology.
Keßler [20] reported that context has a substantial role in measuring the similarity between two concepts. However, the context has been mostly ignored in theories of modeling existent similarity measurements [20]. They inquired into the influence of context in existent similarity measurements in the geospatial domain. As similarity is a measurement between entity types which is a visual or tangible rendering of someone or something known as concepts in human minds. The similarity is perceived on what is stated in terms of computational representation about these types. These facts eventually corroborate the idea that most similarity measures are incapable of being compared. Keßler [15] also argued that other than the issue of representation, context is another prime challenge for similarity judgments.
Ricklefs and Blomqvist [21] stated that Information Retrieval System is usually directed towards statistical methods while the semantic web advises more knowledge intensive approaches. They described that very few experiments have been performed to display the pros and cons of certain similarity measures in the domain of related to real-world problems. Raftopoulou and Petrakis [22] classified the similarity measures in three categories; edge-based, information-content-based and feature-based approaches. Information-contentbased approaches have a wider scope as they can also be used for corpus of texts or such related information. The feature-based methods rely on the concise explanation of property definitions of the concepts [22]. Ricklefs and Blomqvist [21] focused only the edge based semantic similarity.
Adnan et al., [23] described a quantifiable ranking formulation in ontology searching. Their scheme was aimed towards providing the measure for inter ontology similarity. They proposed a ranking system to measure ranking between two concepts in different ontologies in similar domain in their ontology search engine, OntoFetcher . They defined the concept of similarity and dissimilarity between two concepts while providing a complete ranking system. However, they did not consider measuring similarity of intra ontology concepts.
-
IV. Proposed Scheme: gSemSim
In this section we shall describe our work in detail. In previous sections, it was highlighted that the objective of this study is to measure the similarity between gene ontology in context of its corresponding domain knowledge. In previous research work [9, 10, 11, 2] we examined that similarity measure was applied to a specific task without incorporation of human judgment. This study harbored human judgment to the quality of the relevance assessments by the computation techniques. gSemSim improves semantic similarity of the concepts in the context of its domain knowledge. As a first step, this technique computes the array of information content of all ancestors between two terms. In the next step, it identifies all common ancestors for both terms followed by summing up their respective information content. We proposed that if Share value is replaced by the ratio of both of these values then it gives better result as compared to GraSM. Formally, we can define our similarity measure as: Given two concepts C1 and C2, the share of the information content between two concepts in a directed acyclic graph is:
CmnAnc ( C , C ) = ∑ IC ( C x ) : ∀ C x ∈ Anc ( C 1 ) ∧∀ C ∈ Anc ( C ) у. C x ^ { C 1 , C 2 }
AllAnc ( C , C ) =
∑ IC ( C x ) : ∀ C x ∈ Anc ( C x )
∨∀ C ∈ Anc ( C )
у C x ^ { C 1 , C 2 }
Equation (11) describes the set of all common ancestors Cx of both of the concepts C1 and C2. Equation (12) indicates the set of all ancestors Cx related to any of the concepts C1 or C2. Equation 13 is formulated from equation (11) and equation (12) showing the novel share of the contents for similarity value. Intuitively we would state that this is a ratio between intersections of two sets to the union of same two sets. This ratio keeps ensure that the depth of the DAG is considered as well as the entire related information concept for the given two concepts. We shall explain mathematical observation of equation (13) by an applying it on the dataset in table 1 in the next section.
-
V. Results
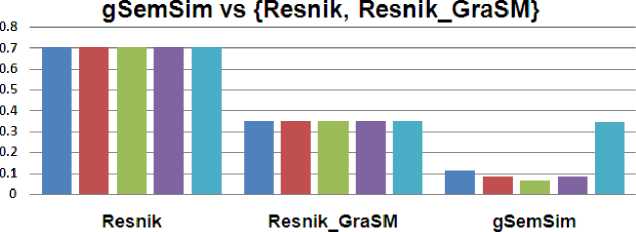
In previous sections, we formulated mathematical equations describing the idea of gSemSim . We computed share and similarity measure using the equation (5) to equation (13) on the dataset in table 1. Fig. 2 showing the comparison of gSemSim to technique by Resnik and modified Resnik version (Resnik_GraSM).
Share ( C , C ) =
AlA ( C , C ) CmA ( C , C )
■ Sim(T1,T2) ■Sim(T1,T4) ■Simfrija) eSim^JS) ■Sim(T3,T4)
Fig. 2: Comparison of gSemSim with Resnik and Resnik_GraSM
Cuoto argued that in order to improve the correlation, less informative common ancestors are assumed to be preferable. Genes with common functions are likely to demonstrate correlated expression levels, which can be used to categorize data sets of interacting genes obtained from microarray data. Cuoto et al. [2] performed their experiment and provided their result for evidence. Nonetheless, we are not impressed by such statement as if less informative common ancestors are preferable then there are many cases when misleading similarities between concepts arises. This fact is highlighted in Fig. 2 where pair wise similarity among various terms was shown same for both of the techniques.
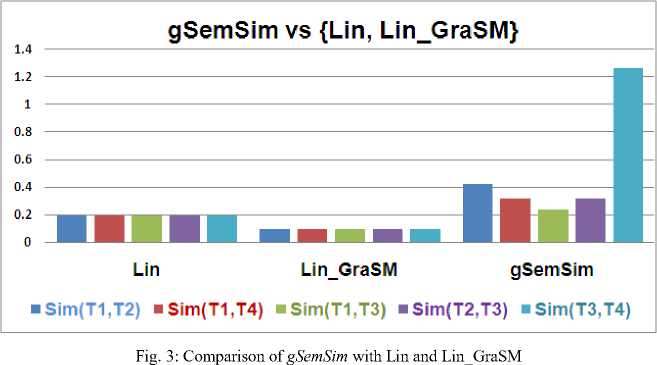
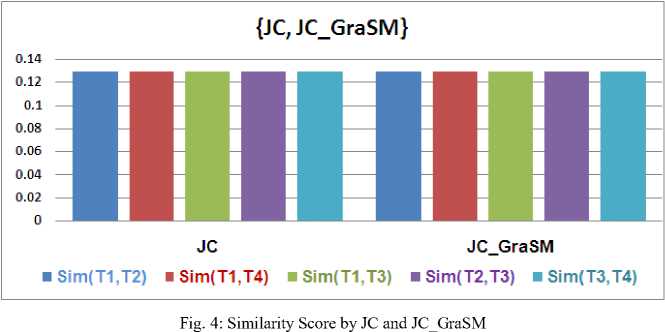
However when we change the Share value, it gives different results for different pairs. Fig. 2, 3 and 4 depict the result to the problem shown in case study section. According to the result set similarity between all of the four pair wise terms was constant for conventional techniques including Resink, Lin, JC and their extension GraSM. This result set was quite arguable as the similarity between different terms is surely different. However our results illustrate that similarity between term T1 and T2 is more than the similarity between term T1 and T4. It can be explained by the fact that the concept of digestive tract development (T1) is more related towards cardiovascular system development (T2) as compared to organ morphogenesis (T 4 ).
The cardiovascular system commence to its development and formation in the third week of gestation, whereas the gut start to begin at the sixteenth day of human development in the embryo. From these descriptions of biological process, it is evident that the term T 1 and T 2 are more related in context of biological process because both of them commence out in embryo in early weeks of embryo settlement. Both falls in the same folder process wise. On the other hand the term T3 and T4 are more related to each other as both are closely anatomical structures and share more common information as compared to term T1 and T2. The same fact is true in case of term T 2 and T 3 where similarity should be lower than the similarity between terms T 1 , T 2 and T 3 , T 4 .
A careful examination of Fig. 2 and 3 positively indicates that our proposed measuring scheme gSemSim delivers better improvement for Resnik and Lin measures; yet for JC similarity scheme, the values of gSemSim are not impressive enough.
-
VI. Conclusion
When analyzed the evaluation results in previous section, the following conclusions can be drawn out. Four semantic similarity approaches investigated in this study embark on their limitations over a sample dataset of gene ontology. This leads us to introduce a novel semantic measure gSemSim based on the ratio between intersection and union of ancestors of two concepts. This strategy ensures the inclusion of their context in much better and refined way. This measure will be helpful in investigating the final impact of the correlation or cohesion resulting from the implementation of the similarity measures. At the same time, this measure will also be helpful in coping with the limitations found in relative performance to other similarity measures used by research community. The careful examination and analysis of the results can substantiate that the proposed scheme gSemSim has seriously improved the semantic similarity measures as compared to Resnik, and Lin measures. In this study, we have also presented a qualitative and quantitative comparative evaluation of our proposed measure to the semantic similarity measure GraSM presented by Cuoto which is a graph based common disjunctive ancestor semantic similarity measure. This study is expected to assist the community of bio informatics in the selection of best similarity measure for annotations of gene ontology.
We can identify the future work in at least two dimensions. The first dimension is related to implementing the scheme to perform exhaustive experimentation on large dataset publicly available because it is hard to make large number of calculations manually for large dataset. The second dimension is related to the complete evaluation of the result set and computation of the recall values of the information gain. The overall result will be evaluated by the domain expert in order to validate the results.
Список литературы gSemSim: Semantic Similarity Measure for Intra Gene Ontology Terms
- The Gene Ontology, http://www.geneontology.org/, accessed on June, 2012.
- F. Cuoto, M. Silva, “Mining the BioLiterature: towards automatic annotation of genes and proteins”, Advanced Data Mining Technologies in Bioinformatics, Idea Group Inc., 2006.
- Altschul, S. F., Madden, T. L., Schaffer, A., Zhang, J., Zhang, Z., Miller, W., et al. (1997). Gapped BLAST and PSI-BLAST: A new generation of protein database search programs. Nucleic Acids Research, 25(17), 389–402.
- Al-Shahrour, F., Diaz-Uriarte, R., & Dopazo, J. (2004). Fatigo: A web tool for finding significant associations of gene ontology terms with groups of genes. Bioinformatics, 20, 578–580.
- King, O. D., Lee, J. C., Dudley, A. M., Janse, D. M., Church, G. M., & Roth, F. P. (2003). Predicting phenotype from patterns of annotation. Bioinformatics, 19(Suppl. 1), 183–189.
- Chang, J., Raychaudhuri, S., & Altman, R. (2001). Including biological literature improves homology search. Pacific Symposium on Biocomputing, 6, 374–383.
- Potential Benefits of Human Genome Project Research, Department of Energy, Human Genome Project Information. 2009-10-09. accessed on June, 2011.
- A. Tversky, “Features of Similarity”, Psychological Review, 84 (2), pp. 327-352, 1977.
- P. Resnik, “Using information content to evaluate semantic similarity in a taxonomy”, Proceedings of the 14th International Joint Conference on Artificial Intelligence, 1995.
- J. Jiang, D. Conrath, “Semantic similarity based on corpus statistics and lexical taxonomy”, Proceedings of the 10th International Conference on Research on Computational Linguistics, 1997.
- D. Lin, “An information-theoretic definition of similarity”, Proceedings of the 15th International Conference on Machine Learning, 1998.
- G. Hirst and D. St-Onge, “Lexical chains as representations of context for the detection and correction of malapropisms”, Fellbaum 1998, pp.305–332.
- A. Amir, D. Lipika, “A method to compute distance between two categorical values of same attribute in unsupervised learning for categorical data set”, Pattern Recognition Letters Vol. 28 (2007) Pp. 110–118
- V. Ganti, J.E. Gekhre, R. Ramakrishnan, “CACTUS-Clustering data using summaries”. 2nd International Conf. on Knowledge Discovery and Data Mining (KDD), 1999, pp. 311–314.
- C. Pesquita, D. Pessoa, D. Faria, F. Couto, CESSM: “Collaborative Evaluation of Semantic Similarity Measures”, BMC Bioinformatics 9. 2009
- C. Pesquita, D. Faria, H. Bastos, A.O. Falcao, F. Couto, “Metrics for GO-based protein semantic similarity: a systematic evaluation”, BMC Bioinformatics 9 (2008).
- M.A. Rodr´ıguez, M.J. Egenhofer, “Comparing geospatial entity classes: An asymmetric and context-dependent similarity measure”, International Journal of Geographical Information Science 18(3) (April-May 2004)
- P. Lord, R. Stevens, A. Brass, C. Goble, “Semantic similarity measures as tools for exploring the Gene Ontology”, Proceedings of the 8th Pacific Symposium on Biocomputing, 2003.
- P. Lord, R. Stevens, A. Brass, C. Goble, “Investigating semantic similarity measures across the Gene Ontology: the relationship between sequence and annotation”, Bioinformatics 19 (10) (2003) 1275–1283.
- C. Keßler, “Similarity measurement in context”, 6th International and Interdisciplinary Conference, CONTEXT 2007, B. Kokinov, D. C.
- M. Ricklefs and E. Blomqvist, “Ontology-Based Relevance Assessment: An Evaluation of Different Semantic Similarity Measures”, OTM 2008, Part II, LNCS 5332, pp. 1235–1252
- P. Raftopoulou, E. Petrakis, “Semantic Similarity Measures: a Comparison Study. Technical report”, Technical University of Crete. Department of Electronic and Computer Engineering (January 2005)
- S.A.H. Shah, A. Khalid, M.A. Qadir, “OntoFetcher: An Approach for Query Generation to Gather Ontologies and Ranking hem by Ensuring User's Context”, 2008 International Conference on Emerging Technologies IEEE-ICET 2008 Rawalpindi, Pakistan, 18-19 October,
- Hvidsten, T., Lagreid, A., & Komorowski, J. (2003). Learning rule-based models of biological process from gene expression time profiles using Gene Ontology. Bioinformatics, 19, 1116–1123.
