Handgrip muscle force characteristics with general reference values at Chelyabinsk and Belgrade students

Author: Dopsaj M., Nenasheva A.V., Tretiakova T.N., Syromiatnikova Yu.A., Surina-marysheva E.F., Markovi S., Dopsaj V.
Journal: Человек. Спорт. Медицина @hsm-susu
Section: Физиология
Article in issue: 2 т.19, 2019.
Free access
The Aim. The aim of this paper is to define the contractile characteristics of maximal isometric handgrip force and to establish possible differences between the students of the Universities of Chelyabinsk and Belgrade. The secondary aim is to create a practically applicable initial model in order to explore the mentioned characteristics in the future. Material and methods. For the purposes of this research, the overall sample of 225 subjects was tested. 91 subjects were from Russia and 134 were from Serbia. The results were gathered using a strain gage and a standardized isometric handgrip test protocol. The contractile properties of HG muscle force were measured in relation to three different contractile dimensions: the maximal muscle force (Fmax), the maximal explosive muscle force (RFDmax), the time need for achieving maximal (tFmax) and maximal explosive (tRFDmax) muscle force. Results. This study has shown that there are no generally statistically significant differences for all observed variables of HG contractile characteristics between tested Russian and Serbian students. Based on the results of the present study, six different models of the equation for evaluation of HG contractile characteristics of female and male students, i.e. young adults, were made. All defined models are highly statistically significant, accurate and sensitive in the prediction of the general distributive position of an individual or particular group of subjects in relation to the measured contractile characteristics. Conclusions. The obtained results can generally indicate the stability of potential to exert the given contractile characteristic in relation to the population of similar evolutionary (Slavs) at different geographical background.
Hand grip, maximal force, rate of force development, young adults
Short address: https://sciup.org/147233517
IDR: 147233517 | UDC: 612.82 | DOI: 10.14529/hsm190204
Характеристики силы мышц кисти и их референсные значения у студентов из Челябинска и Белграда
Цель. Цель данного исследования - определить сократительные характеристики максимальной изометрической силы сжатия кисти и установить возможные различия между студентами Челябинска и Белграда. Второстепенная цель данного исследования - создать практически применимую модель, чтобы исследовать вышеупомянутые характеристики в будущем. Материалы и методы. В рамках исследования была протестирована выборка из 225 человек, 91 участник из России и 134 - из Сербии. Результаты исследования были собраны с использованием датчика силы сжатия и стандартизированного тестового протокола для изометрического сжатия руки. Сократительные характеристики силы сжатия кисти были измерены относительно трех разных направлений: максимальная мышечная сила (Fmax), максимальная взрывная сила (RFDmax), время, требуемое для достижения максимальной (tFmax) и максимальной взрывной (tRFDmax) силы. Результаты. Данное исследование показало отсутствие статистически значимых различий сократительных характеристик сжатия руки для всех выбранных показателей, изученных у российских и сербских студентов. Исходя из результатов настоящего исследования, были выработаны шесть различных моделей уравнения для оценки сократительных характеристик сжатия руки у студентов различного пола. Все выработанные модели обладают высокой статистической значимостью, точностью и чувствительностью в прогнозировании позиции, занимаемой человеком или определенной группой лиц относительно измеряемых характеристик. Заключение. Полученные результаты говорят об общей устойчивости потенциала для заданной сократительной характеристики у родственных народов (славянские народы), проживающих в различных географических областях.
Text of the scientific article Handgrip muscle force characteristics with general reference values at Chelyabinsk and Belgrade students
Evolutionary, hands are the basic manipulative organ of the human body, and hands are specialized for various manipulative tasks with different physical objects and should be able to realize various types of load, with various grip and pinch precision and intensity level [20]. During all these tasks hands produce proper strength by producing a proper muscle force for gripping. This is the reason why hand grip strength is recognized as a limiting factor in all the manipulative activities realized by the cranial part of the body [20].
Muscle strength is often equated with muscle force and can be defined as the ability of a single muscle or group of muscles to produce a force while contracting against some external resistance [24]. Hand muscle strength expressing the achieved level of maximal muscle force should be easily measured by applying the maximum handgrip (HG) test [13]. Also, HG test is highly reliable, valid and health status responsive, very easy to administer, and widely used as a simple marker of overall body strength in adults [3, 14], overall body strength in children, adolescents and young adults [22], robust marker of aging and general health status [18], and very useful testing tool in sport and sport testing technology [10, 13, 15]. HG test results also highly reflect strength of the other muscle groups which is why it is one of the most important tests at clinical and epidemiological studies considering general physical capability and subsequent health at humans [4, 5, 16, 18, 21].
One of the most important data on the contractile capacity of muscle is the data on the iso- metric characteristics of the force-time curve model, the information’s of the rate of force development (RFD) or how force is rapidly developed in the function of time [1, 6, 11, 17].
For that reason the two most commonly used variables of the HG test, maximal isometric muscle force (F max ) and the maximal rate of force development, i.e. the ability of rapid force deve lopment (RFD max ), provide the basic information on the contractile ability of handgrip muscles [1, 9, 15, 23].
Recently published review studies discussed evidence and suggest that lower levels of physical capability were associated with higher risk of subsequent health problems, and found that weaker grip strength and slower walking speed is associated with increased risk of future fractures and cognitive decline in during the aging [5]. Also, there is strong scientific evidence about evolutionary and genetic relations and patterns between the quality of hand grip strength as a suitable phenotype for identifying genetic variants of importance to mid- and late-life physical functioning [7]. Also, handgrip strength is indicative of blood testosterone level and appears to be one of the signals for genetic quality in males [8], and it seems that should predict reproductive success at females [2].
Strong scientific evidence was previously published where authors found that HG contractile characteristics (F max and RFD max ) in youth and elderly highly correlate with the strength of other muscle groups [4, 8, 18, 22]. Also, HG contractile characteristics were significantly connected with the overall quality of physical capabilities and performance even in athletes involved in the competitive sport [10, 13, 15, 23].
The aim of this paper is to define the contractile characteristics of the maximal isometric handgrip test force and to establish possible differences between the students of the Universities of Chelyabinsk and Belgrade that is the samples of the healthy young adult population from a different geographical origin, i.e. from Russia and Serbia. The secondary aim is to create a practically applicable initial model in order to explore the mentioned characteristics in the future as a part of the analytical and diagnostic system for the purposes of quality control of human health and well-being. Generally, the standardization process for mentioned HG testing could have a wide range of applications: control and assessment of physical ability of the population; control and definition of acute and cumulative physical status 28
of athletes involved in regular training and competition; assessing trends or tendencies of changes in distinct physical abilities in student populations, etc.
Methods
The basic method used in this study was laboratory testing, while applied research design was Cross-Sectional with a multicentric measurement protocol. The study was applied according to standards for research methods in sport [19].
The Research Sample
For the purposes of this research, the overall sample of 225 subjects was tested. According to the nationality and gender subsamples were: Females Russia, N = 52 (Age = 25.4 ± 5.4 yrs., BH = 164.6 ± 6.0 cm, BM = 59.7 ± 11.9 kg, BMI = = 22.05 ± 4.14 kg·m–2); Males Russia, N = 39 (Age = 25.5 ± 2.7 yrs., BH = 180.7 ± 5.4 cm, BM = 79.3 ± 12.4 kg, BMI = 24.19 ± 3.14 kg·m–2); Females Serbia, N = 79 (Age = 23.9 ± 3.6 yrs., BH = 169.1 ± 7.1 cm, BM = 62.8 ± 11.6 kg, BMI = 21.90 ± 3.24 kg·m–2); Males Serbia, N = = 55 (Age = 24.1 ± 2.4 yrs., BH = 183.8 ± 6.4 cm, BM = 82.9 ± 12.2 kg, BMI = 24.48 ± 2.65 kg·m–2). The examinees from Russia were the students from the Institute of Sport, Tourism, and Service from (ISTS) South Ural State University (SUSU), Chelyabinsk, from Sports and Tourism department, and examinees from Serbia were the students from the Faculty of Sport and Physical Education (FSPE) and Pharmaceutical Faculty.
All students voluntarily participated in the study and the research was conducted according to the recommendations of the Declaration of Helsinki guidelines for physicians, for biomedical research involving human subjects , and with the permission of the Ethics Committee of University of Belgrade FSPE and with the permission of the Ethics Committee of the SUSU.
Hand Grip Testing
The handgrip isometric test protocol with standardized procedures and equipment, i.e. a sliding device with a fixed strain gage (All4gym d.o.o., Serbia) that measures isometric hand and finger flexor force, was used [14, 23]. During the test, students were sitting upright in the middle of the free surface of the chair and holding the measuring device in the tested hand. The arm of tested hand was in a natural stretched position, alongside and placed in an abduction position 5 to 10 cm away from the body. The arm of non-tested hand was resting alongside the body and the subjects were not allowed to move during the test, or to lean the hand and the device on the thigh or another solid object.
Prior to the experimental trials of the HG test, each student performed a pre-trial familiar measurement twice, alternating the hands, at the medium and sub-maximal intensity. After a two-minute rest, the test was carried out. The power grip was used, and subjects were asked to make the strongest and fastest possible pressure on the device on the researcher's mark, holding the grip approximately 1–2 seconds, while the verbal encouragement was provided [17]. The HG test of the dominant and non-dominant hand was conducted twice (in randomized order) within a one-minute interval between trials.
For Serbian subsample tests were performed in the Research laboratory (MIL) at FSPE from 2017 to 2018, and for Russian subsample at Research Center for Sports Science at SUSU, Chelyabinsk at 2019, using the same procedure, by the same researcher and with the same equipment.
Data analysis
Maximal isometric muscle force (F max ), maximal rate of force development (RFD max ), as well as the time needed to reach F max and RFD max were recorded from each trial. The maximal force was assessed through the maximum of the achieved muscle force level (F max ), and RFD max was calculated as the maximal slope of the forcetime curve (over the first derivative of the forcetime curve) in regards to the force onset (Knezevic et al., 2014). The onset of the contraction was defined as the point in time when the first derivative of the force-time curve exceeded the baseline by 3% of its maximal value. The strain gage used in HG test was connected to the force reader with the precision of ± 0.1N. The force-time signal was sampled at 500Hz (i.e. 500 samples per second) and low-pass filtered (10Hz) using a fourthorder (zero-phase lag) Butterworth filter [12]. A software-hardware system specially designed for isometric measurement (SMS Isometrics, ver. 3.4.0) was used for data collection and processing. All test results for variables were recorded in the database, and the better result was used for data processing.
Variables
The contractile properties of HG muscle force were measured in relation to three different contractile dimensions: the maximal muscle force (Fmax), the maximal explosive muscle force (RFDmax), the time need for achieving maximal (tFmax) and maximal explosive (tRFDmax) muscle force. All muscle force characteristics, i.e. variables, were calculated for relative values as well.
Variables for maximal muscle force characteristics were:
-
1. Maximal muscle force for the nondominant (F max _ND), dominant (F max _D) and summarized (F max _SUM) hand grip force, expressed in Newton (N).
-
2. Relative muscle force for nondominant (F rel _ND), dominant (F rel _D) and summarized (F rel _SUM) hand grip relative force, expressed in Newton per kilogram of body mass (N/kg).
-
3. Maximal explosive muscle force for the nondominant (RFD max _ND), dominant (RFD max _D), and summarized (RFD max _SUM) hand grip force, expressed in Newtons per second (N/s).
-
4. Relative explosive muscle force for the nondominant (RFDrel_ND), dominant (RFDrel_D) and summarized (RFD rel _SUM) hand grip relative explosive force, expressed in Newton per second per kilogram of body mass (N/s·kg–1).
-
5. Time needed for maximal muscle force production at nondominant (tF max _ND), dominant (tF max _D) and summarized (tF max _SUM) hand grip time, expressed in seconds (s).
-
6. Time needed for maximal explosive muscle force production at nondominant (tRFD max _ND), dominant (tRFD max _D) and summarized (tRFD max _SUM) hand grip time, expressed in seconds (s).
Variables for maximal explosive force characteristics:
Variables for maximal and explosive muscle force time parameters:
Statistics
Basic descriptive statistics were calculated for all variables (Mean ± SD). Multiple and univariate analysis of the variance (MANOVA and ANOVA) were used to calculate the differences between subsamples and the Bonferroni criterion was applied for the comparisons between groups in relation to criteria (Nationality). Inter and intra-variable differences were determined at the probability level of 95%, with a p-value of 0.05 (Hair et al., 1998). All statistical analyses were carried out using the software package SPSS Win Statistics 19.0.
In the next step of the analysis, mathematical modeling by means of multidimensional scaling was used to define the total numerical score of general HG contractile level in function of following basic measured contractile characteristic – Fmax and RFDmax. In this way general HG level for hands, maximal (Fmax_ND and Fmax_D) and maximal isometric explosive muscle force (RFDmax_ND and RFDmax_D), and for overall HG level (Fmax_SUM and RFDmax_SUM) was presented by mathematical analogy where the value of test score for each individual participant was transformed into a proportional point score on a scale from 0 (hypothetical minimum) to 100 (hypothetical maximum) points [15].
The final form of the mathematical model for defining prediction equation was defined by application of the Multivariate Regression Analysis (MRA), where the value of point score represented the criterion variable, and the results of specifically used isometric test variables represented a system of the predictor variables.
Results
All descriptive statistics for the overall sample and all subsamples are shown in Table 1. The results of MANOVA and ANOVA – tests of be-tween-subjects effects are shown in Table 2 and Table 3.
Different defined models of the prediction equation for evaluation of HG contractile characteristics for both female and male students, i.e. young adults, are shown in Table 4.
Descriptive statistics of variables in relation to the defined subsamples
Table 1
|
Dependent Variable |
Female (N = 131) |
Male (N = 94) |
Female RUS (N = 52) |
Female SRB (N = 79) |
Male RUS (N = 39) |
Male SRB (N = 55) |
|
F max _ND |
255.0 ± 52.1 |
486.6 ± 102.6 |
249.5 ± 42.3 |
258.5 ± 57.6 |
463.8 ± 70.3 |
502.8 ± 118.4 |
|
F max _D |
272.1 ± 56.0 |
508.9 ± 108.6 |
261.4 ± 48.7 |
279.1 ± 59.6 |
497.3 ± 83.7 |
517.1 ± 123.4 |
|
F max _SUM |
527.0 ± 104.4 |
995.5 ± 203.7 |
511.0 ± 87.2 |
537.6 ± 113.7 |
961.1 ± 148.0 |
1019.9 ± 233.7 |
|
F rel _ND |
4.22 ± 0.88 |
6.01 ± 1.00 |
4.27 ± 0.79 |
4.18 ± 0.94 |
5.93 ± 0.89 |
6.06 ± 1.08 |
|
F rel _D |
4.51 ± 0.99 |
6.27 ± 1.07 |
4.49 ± 0.98 |
4.52 ± 0.99 |
6.35 ± 1.01 |
6.22 ± 1.11 |
|
F rel _SUM |
8.73 ± 1.81 |
12.28 ± 1.94 |
8.76 ± 1.72 |
8.71 ± 1.88 |
12.28 ± 1.81 |
12.28 ± 2.05 |
|
RFD max _ND |
1624 ± 354 |
3183 ± 709 |
1577 ± 316 |
1655 ± 376 |
3082 ± 526 |
3255 ± 812 |
|
RFD max _D |
1728 ± 411 |
3349 ± 756 |
1674 ± 435 |
1763 ± 394 |
3310 ± 611 |
3375 ± 848 |
|
RFD max _SUM |
3352 ± 719 |
6532 ± 1379 |
3251 ± 706 |
3419 ± 724 |
6393 ± 1069 |
6630 ± 1564 |
|
RFD rel _ND |
26.87 ± 6.18 |
39.19 ± 7.01 |
27.08 ± 6.42 |
26.74 ± 6.06 |
39.34 ± 6.62 |
39.09 ± 7.34 |
|
RFD rel _D |
28.73 ± 7.76 |
41.16 ± 6.91 |
28.93 ± 8.98 |
28.60 ± 6.90 |
42.14 ± 6.75 |
40.46 ± 7.00 |
|
RFD rel _SUM |
55.61 ± 13.29 |
80.35 ± 12.49 |
56.01 ± 14.79 |
55.34 ± 12.30 |
81.48 ± 12.37 |
79.55 ± 12.63 |
|
tF max _ND |
0.631 ± 0.261 |
0.591 ± 0.265 |
0.687 ± 0.339 |
0.595 ± 0.188 |
0.541 ± 0.256 |
0.626 ± 0.267 |
|
tF max _D |
0.659 ± 0.282 |
0.575 ± 0.282 |
0.711 ± 0.348 |
0.625 ± 0.225 |
0.611 ± 0.279 |
0.550 ± 0.283 |
|
tF max _SUM |
1.291 ± 0.494 |
1.166 ± 0.466 |
1.398 ± 0.640 |
1.220 ± 0.355 |
1.152 ± 0.475 |
1.176 ± 0.463 |
|
tRFD max _ND |
0.131 ± 0.030 |
0.121 ± 0.016 |
0.139 ± 0.039 |
0.126 ± 0.021 |
0.121 ± 0.014 |
0.120 ± 0.017 |
|
tRFD max _D |
0.133 ± 0.033 |
0.122 ± 0.025 |
0.136 ± 0.035 |
0.131 ± 0.032 |
0.122 ± 0.018 |
0.122 ± 0.029 |
|
tRFD max _SUM |
0.264 ± 0.055 |
0.243 ± 0.036 |
0.275 ± 0.068 |
0.257 ± 0.044 |
0.243 ± 0.025 |
0.243 ± 0.042 |
Results of MANOVA at the defined subsamples (Multivariate Tests)
Table 2
Results of ANOVA at defined subsamples (Tests of Between-Subjects Effects)
Table 3
|
Dependent Variable |
F |
Sig. |
Partial Eta2 |
Observed Power |
F |
Sig. |
Partial Eta2 |
Observed Power |
||
|
F max_ ND |
m Pi > Pi о s CJ |
0.941 |
0.334 |
0.007 |
0.161 |
m Pi 5 |
3.374 |
0.069 |
0.035 |
0.443 |
|
F max_ D |
3.159 |
0.078 |
0.024 |
0.422 |
0.760 |
0.386 |
0.008 |
0.139 |
||
|
F max_ SUM |
2.058 |
0.154 |
0.016 |
0.296 |
1.920 |
0.169 |
0.020 |
0.278 |
||
|
F rel_ ND |
0.286 |
0.593 |
0.002 |
0.083 |
0.383 |
0.538 |
0.004 |
0.094 |
||
|
F rel_ D |
0.032 |
0.859 |
0.000 |
0.054 |
0.337 |
0.563 |
0.004 |
0.089 |
||
|
F rel_ SUM |
0.024 |
0.877 |
0.000 |
0.053 |
0.000 |
0.999 |
0.000 |
0.050 |
||
|
RFD max_ ND |
1.534 |
0.218 |
0.012 |
0.233 |
1.360 |
0.247 |
0.015 |
0.211 |
||
|
RDF max_ D |
1.488 |
0.225 |
0.011 |
0.228 |
0.164 |
0.686 |
0.002 |
0.069 |
||
|
RFD max_ SUM |
1.712 |
0.193 |
0.013 |
0.255 |
0.673 |
0.414 |
0.007 |
0.128 |
||
|
RFD rel_ ND |
0.096 |
0.758 |
0.001 |
0.061 |
0.030 |
0.863 |
0.000 |
0.053 |
||
|
RFD rel_ D |
0.055 |
0.815 |
0.000 |
0.056 |
1.348 |
0.249 |
0.014 |
0.210 |
||
|
RFD rel_ SUM |
0.078 |
0.780 |
0.001 |
0.059 |
0.544 |
0.463 |
0.006 |
0.113 |
||
|
tF max_ ND |
3.950 |
0.049 |
0.030 |
0.505 |
2.421 |
0.123 |
0.026 |
0.337 |
||
|
tF max_ D |
2.939 |
0.089 |
0.022 |
0.398 |
1.100 |
0.297 |
0.012 |
0.180 |
||
|
tF max_ SUM |
4.154 |
0.044 |
0.031 |
0.525 |
0.059 |
0.809 |
0.001 |
0.057 |
||
|
tRFD max_ ND |
6.566 |
0.012 |
0.048 |
0.720 |
0.066 |
0.797 |
0.001 |
0.057 |
||
|
tRFD max_ D |
0.802 |
0.372 |
0.006 |
0.144 |
0.001 |
0.982 |
0.000 |
0.050 |
||
|
tRFD max_ SUM |
3.645 |
0.058 |
0.027 |
0.474 |
0.009 |
0.923 |
0.000 |
0.051 |
Defined mathematical models for quantitative evaluation of HG contractile characteristics for female and male students – young adults
Table 4
|
HG characteristics |
Gender |
Model eguation for evaluation |
p value |
SEE |
|
F max model |
F |
F max_ SUM_points = –34.12184 + (F max ND • 0.16555) + + (F max D • 0.15405) |
0.000 |
0.0030 |
|
M |
F max_ SUM_points = –31.46588 + (F max ND • 0.08421) + + (F max D • 0.07956) |
0.000 |
0.0028 |
|
|
Maximal RFD max |
F |
RFD max_ SUM_points = –27.96154 + (RFD max ND • 0.02505) + + (F max D • 0.02158) |
0.000 |
0.0029 |
|
model |
M |
RFD max_ SUM_points = –28.96598 + (RFD max ND • 0.01248) + + (RFD max D • 0.01172) |
0.000 |
0.0030 |
|
General HG |
F |
HG SUM_points = –36.49996 + (F max SUM • 0.08532) + + (RFD max SUM • 0.01239) |
0.000 |
0.0029 |
|
contractile model |
M |
HG SUM_points = –33.80934 + (F max SUM • 0.04272) + + (RFD max SUM • 0.00632) |
0.000 |
0.0031 |
Fig. 1 show the examples of evaluation of point score model for HG F max and HG general contractile characteristics for males and females with different age and training status as examples for the application of the defined models.
Discussion
In the majority of sports situations and daily activities during motion, we are required to change the velocity of an external resistance, which may be the mass of our own or someone else’s body or the mass of some object or implement [24].
At one side, it should be noted that during everyday life situations in which time-limited contractions are important, such as fast reflex reaction or fall-risk situations, the ability to develop the force rapidly (or RFD) can be more significant than the ability to produce maximum
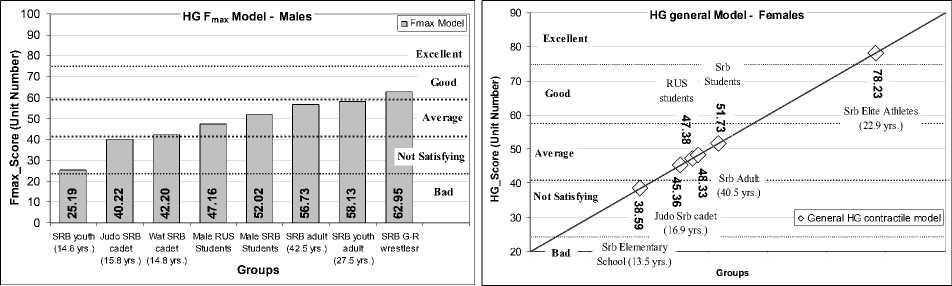
Fig. 1. Point score defined by mathematical models for quantitative evaluation of HG F max contractile model characteristics for male and female students
force [20], where consequently, a faster RFD plays an important role in performing fast movements that should control unexpected changes in body balance maintenance [1]. At the other side, maximal muscular strength appears to be strongly related to the ability to develop muscle force quickly, strong people, even a youth, are able to generate force more rapid even when the external load they are moving is relatively light [1, 24].
The results of the study have shown that there are no generally statistically significant differences for all observed variables of HG contractile characteristics between tested Russian and Serbian students (Table 2). The obtained results can generally indicate the stability of potential to exert the given contractile characteristic in relation to the population of similar evolutionary (Slavs) at different geographical background. However, for the sake of the future research in this area, it should be pointed out that statistically significant partial differences were determined in the female subsample in relation to the variables tFmax_ND, tRFDmax_ND and tFmax_SUM (Table 3, F = 3.950, p = 0.049, F = 6.566, p = 0.012 and F = 4.154, p = 0.044, respectively). At this point, there is no valid explanation for the shorter time to maximal level and intensity of the contraction of nondominant hand determined in Serbian students. In this moment there is no valid explanation for their shorter mechanical exertion of maximal muscle force and rate of force development in relation to tested Russian students. Hypothetical reasons for the determined differences can include social, cultural and climate factors as well as physical constitution, especially considering the fact that girls from Serbia are much taller (RUS F – 164.6 vs SRB F – 169.1 cm) and heavier than tested Russian female students (RUS F – 59.7 vs SRB F – 62.8 kg, see.
Subject sample), although having approximately the same BMI.
This study has determined that averaged values for F max for non-dominant, dominant hand and summarized results for females are between 249.5 to 258.5 N, 258.5 to 279.1 N, and 511.0 to 537.6 N, while for males they are between 463.8 to 502.8 N, 497.3 to 517.1 N, and 961.1 to 1019.9 N, respectively (Table 1). All results are in line with previously published age group standards [14, 21], but lower than standards for athletes [13]. When we consider the fact that maximal HG force values are age-dependent and reach maximal level approximately between 30 and 35 years regardless of gender, we can infer that tested samples in our study have not yet reached full biological maturity according to the maximal strength potential [21].
Considering maximal HG rapid force potential (RFD max ), it was established that females for non-dominant, dominant hand and summarized values have results between 1577 to 1655 N/s, 1675 to 1763 N/s, and 3251 to 3419 N/s, while males have results in range between 3082 to 3255 N/s, 3310 to 3375 N/s, and 6393 to 6630 N/s, respectively (Table 1). There are no many published articles with similar or comparable data about HG RFD max , but we can conclude that the male students have higher RFD max level than youth control and water polo cadet players, but female students do not have higher RFD max than selected and highly trained youth basketball female players [23].
According to the results of the time parameters, it can be concluded that time needed to reach HG F max for non-dominant and dominant hand are generally between 0.631 and 0.659 s and 0.591 to 0.575 s, while for RFD max the time was between 0.131 to 0.133 and 0.121 to 0.122 for females and males, respectively (Table 1).
Based on the results of the present study, six different models of the equation for evaluation of HG contractile characteristics of female and male students, i.e. young adults, were made (Table 4). All defined models are highly statistically significant, accurate and sensitive in the prediction of the general distributive position of an individual or particular group of subjects in relation to the measured contractile characteristics (Fig. 1).
Conclusion
This study has shown that there are no generally statistically significant differences for all observed variables of HG contractile characteristics between tested Russian and Serbian students. The obtained results can generally indicate the stability of potential to exert the given contractile characteristic in relation to the population of similar evolutionary (Slavs) at different geographical background.
Quantitatively, on the basis of the results of this study it was established that averaged values for F max for non-dominant, dominant hand and summarized values for females were between 249.5 to 258.5 N, 258.5 to 279.1 N, and 511.0 to 537.6 N, and for males they were between 463.8 to 502.8 N, 497.3 to 517.1 N, and 961.1 to 1019.9 N, respectively. Considering maximal HG rapid force potential (RFD max ), it was established that females for non-dominant, dominant hand and summarized values had results between 1577 to 1655 N/s, 1675 to 1763 N/s, and 3251 to 3419 N/s, while males had results between 3082 to 3255 N/s, 3310 to 3375 N/s, and 6393 to 6630 N/s, respectively. According to the results of time parameters, it can be concluded that time needed to reach HG F max for non-dominant and dominant hand are generally between 0.631 and 0.659 s and 0.591 to 0.575 s, while the time for RFD max was between 0.131 to 0.133 and 0.121 to 0.122 for females and males, respectively.
Based on the results of the present study, six different models of the equation for evaluation of HG contractile characteristics of female and male students, i.e. young adults, were made. All defined models are highly statistically significant, accurate and sensitive in the prediction of the general distributive position of an individual or particular group of subjects in relation to the measured contractile characteristics. Also, all models can be easily applied in praxis, whether in the system of sport, the system of physical educations at schools, health system or well-being life physical functioning evaluation system.
Acknowledgments
The paper is a part of the project “Effects of the Applied Physical Activity on Locomotor, Metabolic, Psychosocial and Educational Status of the Population of the Republic of Serbia”, number III47015, funded by the Ministry of Education, Science and Technological Development of the Republic of Serbia – Scientific Projects 2011–2019 Cycle.
References Handgrip muscle force characteristics with general reference values at Chelyabinsk and Belgrade students
- Aagaard P., Simonsen E.B., Andersen J.L., Magnusson P., Dyhre-Poulsen P. Increased Rate of Force Development and Neural Drive of Human Skeletal Muscle Following Resistance Training // J Appl Physiol, 2002, vol. 93, no. 4, pp. 1318-1326.
- Atkinson J., Pipitone R.N., Sorokowska A., Sorokowski P., Mberira M., Bartels A., Gallup G.G.Jr. Voice and Handgrip Strength Predict Reproductive Success in a Group of Indigenous African Females // PLoS ONE, 2012, vol. 7, no. 8, p. e41811.
- Bohannon R.W. Dynamometer Measurements of Hand Grip Strength Predict Multiple Outcomes // Percept Motor Skills, 2001, vol. 93, pp. 323-328.
- Bohannon R., Magasi S., Bubela D., Wang Y.-C., Gershon R. Grip and Knee Extension Muscle Strength Reflect a Common Construct Among Adults // Muscle Nerve, 2012, vol. 46, no. 555-558.
- Cooper R., Kuhi D., Cooper C., Gale C., Lawlor D., Matthews F., Hardy R., The Falcon, and Halcyon Study Teams. Objective Measures of Physical Capability and Subsequent Health: a Systematic Review // Age Ageing, 2011, vol. 40, pp. 14-23.
