He assessment of the regional tourism infrastructure development

Author: Velichkina Anna Vladimirovna
Journal: Economic and Social Changes: Facts, Trends, Forecast @volnc-esc-en
Section: Young researchers
Article in issue: 2 (32) т.7, 2014.
Free access
The Russian Federation has a high potential for tourism, but, according to the World Economic Forum, it ranks only 63rd in the world in the rating of travel and tourism sector competitiveness in 2013. The obstacle to tourism development in the country and its regions is still an underdeveloped tourist infrastructure, the slow pace of development and improvement of its basic elements. The article discloses the tourist infrastructure concept in the region, defines its structure, summarizes methodological approaches to its assessment and reveals the advantages and disadvantages of the considered methods. It presents the author’s method to estimate the regional tourism infrastructure development that has been approbated by the data of the Northwestern Federal District. The research has resulted in the regions’ differentiation by the following development levels: high, above average, average, below average. The evaluation results have helped to indicate the key problems, hindering the regional tourist infrastructure development, and to formulate the basic directions of its improvement...
Regional tourist infrastructure, method, tourism development issues, northwestern federaldistrict
Short address: https://sciup.org/147223578
IDR: 147223578 | UDC: 338.48(470.12) | DOI: 10.15838/esc/2014.2.32.18
Text of the scientific article He assessment of the regional tourism infrastructure development
Nowadays the tourism development issues are in focus of the regional economy, as this industry is highly profitable and dynamically developing. The Northwestern Federal district (NWFD) is profitably located due to unique climatic conditions and presence of the largest cultural heritage objects [9].
The inbound tourist flow in the district amounted to more than 11.5 million visitors in 2011. The leaders in the tourist flow volume have recently been Saint Petersburg, Leningrad and Vologda oblasts. Their share accounts for about 80% of the total inbound flow in the Northwestern Federal District (according to the 2011 data). Other regions are lagging behind significantly (fig. 1). However, the growing volume of tourist services in the Pskov Oblast and the Komi Republic reveal active tourism development there in recent years (fig. 2).
In the period under review (2007–2012) the tourism of the Vologda Oblast has developed significantly: the tourism revenues have been growing, the share of this industry in the regional GRP has been increasing. In 2012 the enterprises of tourism sphere and related industries assigned 225.5 million rubles to consolidated budget of the Vologda Oblast ( fig. 3 ). For 2007–2012 the tourism revenues per capita had grown by 80% and reached 10811 rubles in 2012 [4]. The tourism role in the regional economy should be specially emphasized, as the share of industry in the gross regional product has increased by 1.2 percentage points to 4.2%.
The regional tourism development is closely connected with tourist infrastructure, which either acts as an obstacle for the industry development, or determines its positive dynamics. However, for most NWFD regions the infrastructure problems cause decrease in the territory’s competitive advantages in the tourist services market.
In this regard, it is important to find the approach of integrated assessment of the region’s tourist infrastructure and develop the directions of its improvement.
The detailed study of the regional tourist infrastructure requires clarifying its definition, structure and problems, hindering its development.
The tourist infrastructure concept is not new but the scientific literature lacks its common interpretation. The ambiguity and vagueness of the concept “tourist infrastructure” is caused by its insufficient attribution to certain types of economic activity and uncertain range of tourist infrastructure objects.
One should agree with D.F. Vaselikh’s definition of regional tourist infrastructure. According to him, it is “a combination of material objects, which are the carriers of various tangible and intangible properties that ensure the highest possible quantitative and qualita-
Figure 1. Tourist flow in the regions of the Northwestern Federal District in 2011
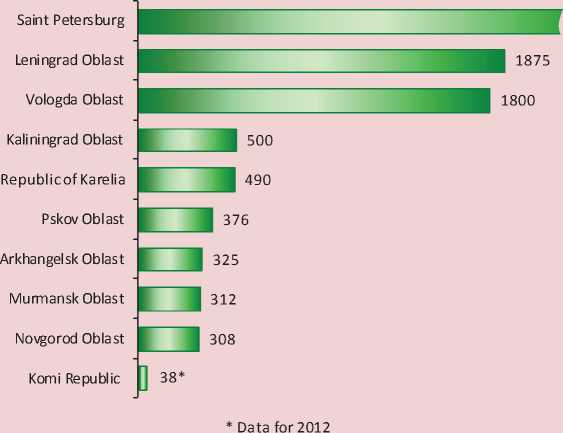
Figure 2. Tourist services volume in 2011
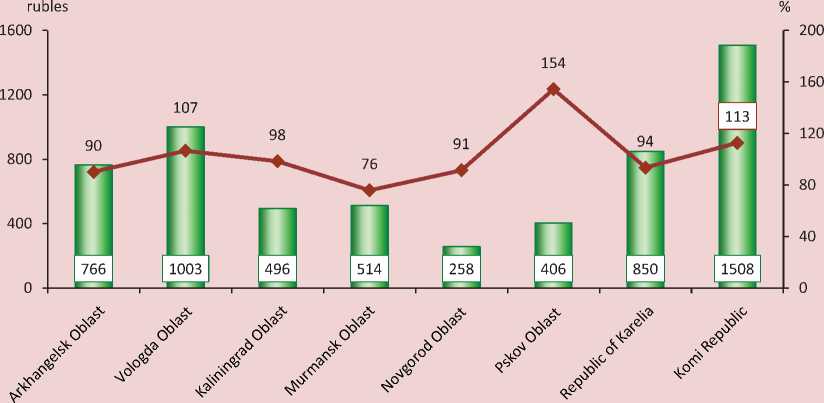
■ ■ Tourist services volume per capita, rubles
1 e Average annual growth in 2010-2011, %
Figure 3. Total tourism revenue in the Vologda Oblast in 2007–2012, thousand people
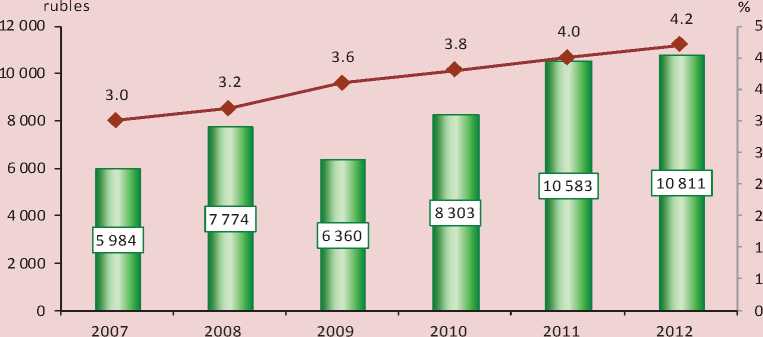
Tourism revenue per capita, rubles Tourism revenue, in % to the GRP
tive implementation of the tourists’ objectives in certain spatial-temporal parameters (in a particular place at particular time)” [3].
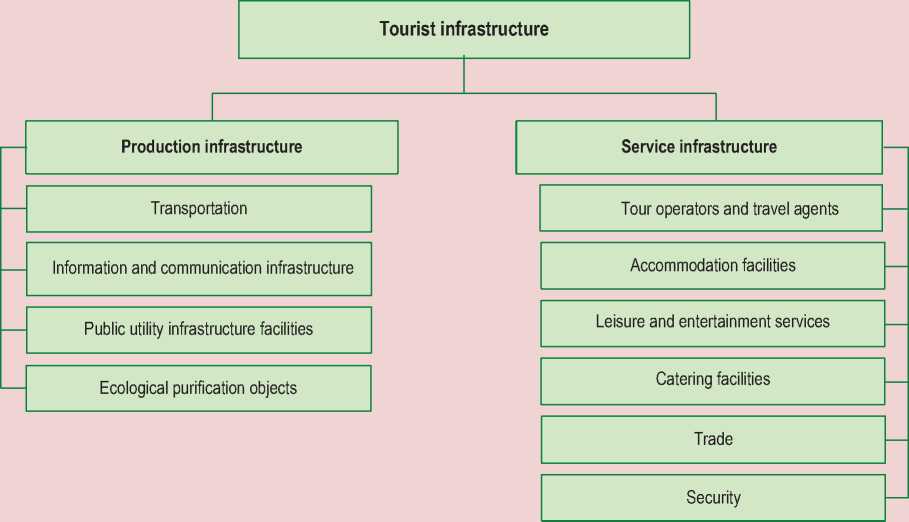
The results of theoretical and methodological analysis can determine the composition of the regional tourist infrastructure. It is a set of enterprises that create conditions to meet the tourism needs, i.e. production infrastructure, and enterprises that directly meet different needs of tourists, i.e. services infrastructure (fig. 4). Therefore, the comprehensive assessment of tourist infrastructure development should be based on a thorough, coherent analysis of its elements [4].
Figure 4. Elements of regional tourist infrastructure
There are the authors’ methods to directly assess tourist infrastructure development (for example, methods of V.S. Bogolyubov, I.G. Limonina, O.B. Evreinov, A.V. Kuchumov and others). Figuratively, these techniques can be divided into two approaches.
According to the first approach (I.G. Limo-nina, A.V. Kuchumov), the development of regional tourist infrastructure is evaluated through a combination of its elements. These methods single out “weak points” in the tourist infrastructure development in the territorial aspect, as well as provide an opportunity to conduct the comprehensive economic-geographical study of tourist infrastructure development in general, without reducing the significance of its separate elements. However, these methods have some disadvantages, as they do not clearly define the indicators system importance within each group of infrastructure elements, describing the current state of tourist infrastructure better. At the same time, some methods have incomplete composition.
The second approach representatives (V.S. Bogolyubov, O.B Evreinov) estimate the regional tourist infrastructure through the analysis of its objects. The proposed model is very useful both for the annual and operational planning at tourist infrastructure enterprises and strategic business planning. However, the disadvantages are the following: the current system of statistical indicators can be approbated at the regional level.
Summarizing the stated above, we can conclude that the most complete and objective method of tourist infrastructure estimation is that one, which is based on the existing tools and takes into account the official statistics indicators. In addition, this method can be supplemented by the qualitative indicators analysis of tourism infrastructure development, obtained by expert assessments and based on the survey results, conducted among tourists and enterprises of the tourism industry.
The method basis is the index of regional tourist infrastructure, quantitatively chara- cterizing the level of its development and it is an arithmetic average of ten indicators indices (fig. 5). These blocks reflect the state of structural elements of the tourist infrastructure in the region.
According to Figure 6 , at the first stage of calculation of a regional tourism infrastructure index the various indicators are presented in the form of normalized data when the real values are compared with the best in the sample.
Figure 5. Scheme of assessment of a tourist infrastructure development level
|
Transportation (I 1 ) |
Density of railway lines for general use Density of hard surface roads Passenger turnover by types of transport (rail, inland waterway, air, road) Number of public buses per 100000 people Transport services volume per person |
||
|
Information and communication infrastructure (I2) |
Communication services volume per person Number of registered subscriber terminals of mobile communication Population coverage with television and radio broadcasting Share of the enterprises that use information and communication technologies, in the total number of the surveyed organizations Number of personal computers per 100 employees |
||
|
Public utility infrastructure (I3) |
Wear of production facilities and water, gas and electricity facilities Volume of utility services per person Number of accidents at heat supply sources, steam and heat networks Number of accidents at water supply system |
||
|
Ecological purification objects(I4) |
Expenses for capital repair of environmental protection facilities per capita Current (operational) costs for environmental protection per capita |
||
|
Tour operators and travel agents (I5) |
Number of tourist organizations per 100000 people Number of tour packages, sold to the population, per 1000 people, units |
||
|
Accommodation facilities (I6) |
Number of group accommodation Number of places at group accommodation Number of overnight stays at group accommodation Coefficient of group accommodation use Number of treatment centers, recreation and tourist camps |
||
|
Leisure and entertainment service (I7) |
Number of museums, theatres, zoos, circuses, parks, treatment centers, leisure establishments, sport facilities Number of theater spectators per 1000 people Number of museum visits per 1000 people Volume of paid culture services per person Volume of paid tourist services per person |
||
|
Catering facilities (I8) |
Number of public catering facilities per 100000 people Number of places at public catering facilities per 1000 people Turnover of public catering per person |
||
|
Trade (I 9 ) |
Number of trade enterprises per 1000 people Retail trade turnover per capita |
||
|
Security (I 10 ) |
Number of registered crimes per 10000 people Number of accidents per 100000 people Harmful substances emissions into the atmosphere Discharge of contaminated sewage waters into water objects |
TOURIST INFRASTRUCTURE INDEX OF THE REGION
Stage I Bringing indicators to the same dimension
Figure 6. Methodological instruments to calculate a tourist infrastructure index
Stage III
Calculation of the tourist infrastructure index
Stage II Calculation of separate blocks indices
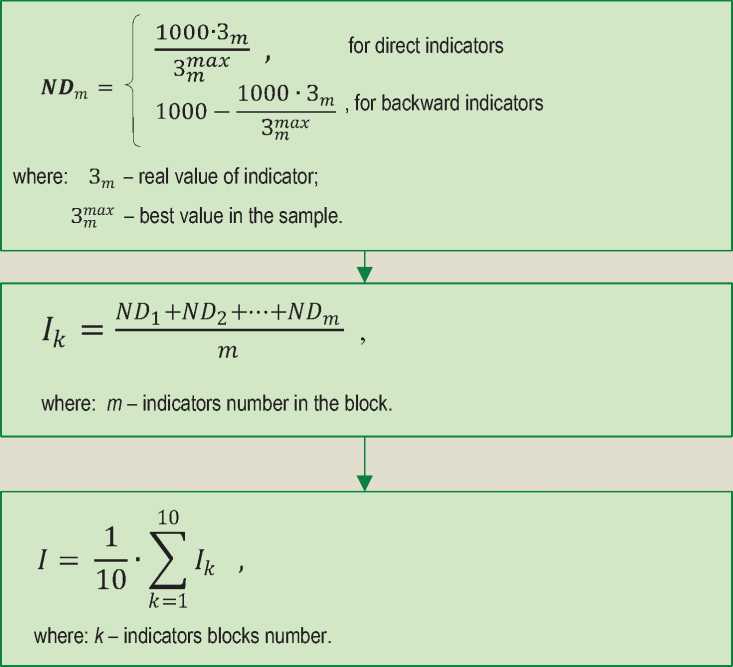
At the second stage the indices of individual blocks are calculated as the arithmetic average of the normalized indices values. At the final stage the integral index of tourist infrastructure is calculated.
The method approbation on the materials of NWFD subjects has resulted in differentiation of territories groups by the level of tourist infrastructure development (fig. 7) .
The cell boundaries were formed, depending on the average value of the tourist infrastructure index in the Northwestern Federal District ( tab. 1 ). According to the calculations, the average value of the tourist infrastructure index in 2011 was 488, maximum – 1000 (fig. 7) .
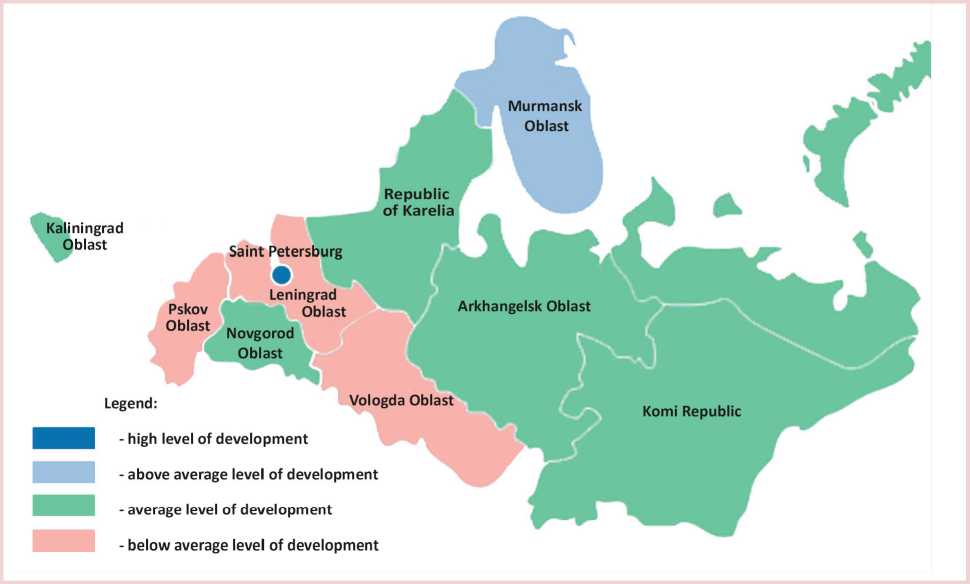
The NWFD regions are distributed by the tourist infrastructure development level in 2011, according to the survey results (fig. 8) .
The high level of tourist infrastructure development is recorded in Saint Petersburg, a leader by most of the index components, except for the ecological purification objects and security block.
In the Murmansk Oblast the infrastructure development level is above average, due to the values growth of the indicators of public utility infrastructure facilities, ecological purification objects, information and communication infrastructure, catering facilities and trade.
The average level of tourist infrastructure development is identified in Novgorod, Kaliningrad, Archangelsk oblasts and republics of Komi and Karelia. The tourist infrastructure index value in these regions varies from 443 to 491.
The below average level of tourist infrastructure is observed in Leningrad, Vologda and Pskov oblasts, due to low rates by many index components.
Figure 7. Distribution of the NWFD regions, according to the tourist infrastructure index in 2011
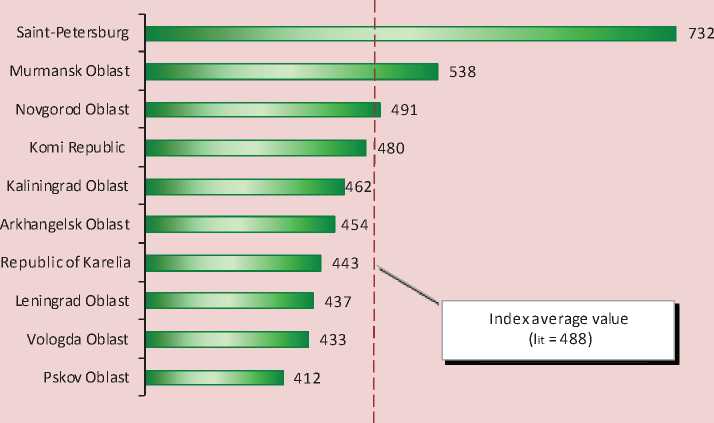
Table 1. Interpretation of threshold values for integral estimate of the tourist infrastructure development level
|
Group number (N) |
Cell boundary |
Tourist potential level |
|
|
Lower boundary |
Upper boundary |
||
|
1 |
у Imax 4 Imax 1 2N N |
Y Imax 3 Imax 1 2N N |
Very low |
|
2 |
Y Imax 3 Imax 1 2N N |
Y Imax 2 Imax ' 2N N |
Low |
|
3 |
Y Imax 2 Imax 1 2N N |
Y Imax 2N |
Below average |
|
4 |
Y Imax 2N |
Y Imax + 2N |
Average |
|
5 |
Y , Imax + 2N |
Y , Imax Imax + 2N ' N |
Above average |
|
6 |
Y , Imax Imax + 2N ' N |
Y Imax 2 Imax + 2N 1 N |
High |
|
7 |
Y , Imax 2 Imax + 2N ' N |
Y Imax 3 Imax + 2N 1 N |
Very high |
Note: I max - the maximum value of the tourist infrastructure index, equal to 1000; I - the average value of the tourist infrastructure index; N – the groups number, according to the tourist infrastructure level.
Figure 8. Distribution of the NWFD regions by a tourist infrastructure development level in 2011
It is critical to define the tourism development prospects by means of correlation of the tourism and recreation competitiveness levels and tourist infrastructure development in the region. For it, it is worthwhile to use the matrix, constructed on the basis of portfolio analysis method ( tab. 2 ).
The leading NWFD region in tourism development is the city of Saint Petersburg, characterized by a high level of tourism and recreation competitiveness and tourist infrastructure development.
Very perspective regions are Murmansk, Kaliningrad, Vologda oblasts and the Republic of Karelia. To realize tourism development prospects in the Murmansk Oblast it is necessary to conduct a complex of measures, aimed at improving its tourism and recreation competitiveness. Kaliningrad, Vologda oblasts and the Republic of Karelia, having a sufficiently high level of tourism competitiveness, should pay more attention to enhancing a tourist infrastructure.
Achieving high performance in Leningrad, Novgorod, Pskov, Arkhangelsk oblasts and the Komi Republic is possible with significant investments in infrastructure projects and longterm encouragement of tourism and recreation competitiveness.
Thus, the matrix identifies correlation between tourist infrastructure and tourism development, singles out the regions, which should pay attention to tourist infrastructure development.
The problems, hindering the tourism infrastructure development in the regions, can be classified as following: infrastructure problems of the material and technological base and administrative-legal problems. The infrastructure problems include:
– insufficient development of production infrastructure, due to high expenses to construct the engineering infrastructure objects for tourism and recreation complexes (electricity network, water supply, transportation, treatment facilities);
Table 2. Matrix of tourism development prospects in the NWFD regions
|
Tourist infrastructure development level |
|||||
|
High |
Above average |
Average |
Below average |
||
|
Го го “ 60 Q о <л Н оз оз та Е S с = Е ' 5 3 |
High |
Saint Petersburg |
– |
– |
– |
|
Above average |
– |
– |
Kaliningrad Oblast |
Vologda Oblast, Republic of Karelia |
|
|
Average |
– |
– |
Novgorod Oblast |
Leningrad Oblast |
|
|
Below average |
– |
Murmansk Oblast |
Arkhangelsk Oblast |
- |
|
|
Low |
– |
– |
Komi Republic |
Pskov Oblast |
|
References He assessment of the regional tourism infrastructure development
- Barabanov A.S. Otsenka konkurentosposobnosti regiona . Problemy teorii i praktiki upravleniya , Moscow, 2011, no.3, pp. 69-81.
- Bogolyubova S.A., Vasilikha D.F. Faktory neeffektivnogo razvitiya regional’noi infrastruktury turizma . Sovremennye problemy nauki i obrazovaniya . Available at: http://www.science-education.ru/100-4960.
- Vasilikha D.F. Strategicheskoe upravlenie razvitiem regional’noi infrastruktury turizma: avtoref. dis. … kand. ekon. nauk: 08.00.05 . Saint Petersburg, 2012. 19 p.
- Velichkina A.V. Problemy razvitiya turistskoi infrastruktury regiona (na primere Vologodskoi oblasti) . Problemy razvitiya territorii , 2013, no.66, pp. 40-48.
- Ismaev D.K. Organizatsiya v”ezdnogo turizma v RF: ucheb. posobie . 2nd edition, revised and supplemented. Moscow: Knigodel, 2009. 152 p.
- O federal’noi tselevoi programme “Razvitie vnutrennego i v”ezdnogo turizma v Rossiiskoi Federatsii (2011-2018 gody)”: Postanovlenie Pravitel’stva RF ot 2 avgusta 2011 g. № 644 . Sobranie zakonodatel’stva RF , 2011, no.34, p. 4966.
- Publichnyi doklad o rezul’tatakh deyatel’nosti Departamenta dorozhnogo khozyaistva i transporta Vologodskoi oblasti za 2012 g. . Ofitsial’nyi portal Vologodskoi oblasti . Available at: http://vologda-oblast.ru/ru/government/executive_power/index.php?id_16=100&from_17=1.
- Selyakova S.A., Dubinicheva L.V., Markov K.V. Sostoyanie i perspektivy razvitiya turistskoi industrii v Vologodskoi oblasti . Ekonomicheskie i sotsial’nye peremeny: fakty, tendentsii, prognoz , 2009, no.1, pp. 80-88.
- Ilyin V.A., Plekhanov Yu.N., Uskova T.V., Selyakova S.A., Dubinicheva L.V., Markov K.V., Bogacheva E.N. Strategiya razvitiya turizma v Vologodskoi oblasti . Vologda: VNKTs TsEMI RAN, 2009. 187 p.
- Tatarkin A.I., Bimatov M.R. Otsenka investitsionnykh potrebnostei sotsial’no-ekonomicheskogo razvitiya regiona . Zhurnal ekonomicheskoi teorii , 2010, no.2, pp. 29-33.
- Uskova T.V., Dubinicheva L.V., Orlova V.S. Sotsial’no-ekonomicheskii resurs turizma: monografiya . Vologda: ISERT RAN, 2011. 182 p.
