Heart and aortic baroreceptors: operation in providing hemodynamic processes in cardiovascular system

Author: Rudenko Mikhail Y., Zernov Vladimir A., Mamberger Konstantin, Rudenko Sergey M.
Journal: Cardiometry @cardiometry
Section: Original research
Article in issue: 3, 2013.
Free access
Aims Up to the present, ECGs have been classified on the basis of the analysis of the ECG curve shape. But this made impossible to classify many ECG shapes. The most promising methods for the classification must evaluate each of the 10 cardiac cycle phases both by their functions and hemodynamic parameters. The aim hereof is to develop the new classification principles for all possible ECG shape variations. Materials and methods The heart cycle phase analysis method is used to calculate the hemodynamic parameters in each of 10 phases, like the phase-related blood volumes and the level of contraction of the corresponding cardiovascular musculature determining its function dynamics in the cardiac cycle phase structure related to the compensation mechanism for maintaining normal hemodynamics. Results An ECG phase changes periodic table consisting of 10 groups of the actual ECG curves typical for the corresponding pathologies is proposed. Each group contains 4 levels of characteristic phase changes. Conclusion The ECG phase changes periodic table is the first attempt to classify the great variety of the ECG shapes. In this case the proposed system requires further investigations. It has been demonstrated that the theoretical concept of the table is in compliance with practice. Further it is planned to improve characteristics of every group and every level.
Baroreceptors, cardiac cycle, cardiovascular system, ecg, hemodynamics
Short address: https://sciup.org/148308742
IDR: 148308742
Text of the scientific article Heart and aortic baroreceptors: operation in providing hemodynamic processes in cardiovascular system
Aims Up to the present, ECGs have been classified on the basis of the analysis of the ECG curve shape. But this made impossible to classify many ECG shapes. The most promising methods for the classification must evaluate each of the 10 cardiac cycle phases both by their functions and hemodynamic parameters. The aim hereof is to develop the new classification principles for all possible ECG shape variations. Materials and methods The heart cycle phase analysis method is used to calculate the hemodynamic parameters in each of 10 phases, like the phase-related blood volumes and the level of contraction of the corresponding cardiovascular musculature determining its function dynamics in the cardiac cycle phase structure related to the compensation mechanism for maintaining normal hemodynamics. Results An ECG phase changes periodic table consisting of 10 groups of the actual ECG curves typical for the corresponding pathologies is proposed. Each group contains 4 levels of characteristic phase changes. Conclusion The ECG phase changes periodic table is the first attempt to classify the great variety of the ECG shapes. In this case the proposed system requires further investigations. It has been demonstrated that the theoretical concept of the table is in compliance with practice. Further it is planned to improve characteristics of every group and every level. Keywords Cardiovascular system • ECG • Cardiac cycle • Baroreceptors • Hemodynamics Imprint Mikhail Y. Rudenko, Vladimir A. Zernov, Konstantin K. Mamberger, Sergey M. Rudenko. Heart and aortic baroreceptors: operation in providing hemodynamic processes in cardiovascular system; Cardiometry; No.3; November 2013; p.31-44; doi: 10.12710/cardiometry.2013.3.3144 Available from:
Electrocardiology is based on an ECG shape interpretation and correlation of its clinically justified changes with the relevant pathological processes. Hemodynamic and metabolic processes are not the subject of electrocardiology. However, the current knowledge of hemodynamics can significantly extend the concepts of electrocardiography. For this purpose, we must clearly understand the processes forming an ECG, or more precisely its phase structure.
The aim hereof is to describe the phase structure of the heart performance on the basis of the heart and aortic baroreceptors functioning.
Materials and methods
Basic cardiovascular system characteristics
All hemodynamic processes, performance and metabolism of the cardiovascular system are reflected in the cardiac cycle phase structure [1, 2]. It consists of the following sequence of phases:
-
1. Phase of early diastole.
-
2. Phase of atrial systole.
-
3. Phase of closing of atrioventricular valves.
-
4. Phase of contraction of interventricular septum (IVS).
-
5. Phase of contraction of myocardium.
-
6. Phase of tension of IVS and myocardium muscles.
-
7. Phase of rapid ejection of blood from ventricles.
-
8. Phase of slow ejection.
-
9. Phase of blood volumes distribution in aorta.
-
10. Phase of buildup of systolic pressure in aorta.
Each phase is responsible for its own functions. The quality of these functions depends on the muscles state. Therefore, it is reasonable to note the main features of the heart muscles.
The main difference between the heart musculature and the smooth muscles is the nerve impulse action potential duration, or to be more precise, the time of their absolute nonexcitability (refractory period), which triggers the muscle contraction by acting on the cell membrane. This period is longer in the heart muscle, that provides the complete contraction required in a given phase, interlocking any external influence, which is considered as interference, resulting in a tetanic contraction. Thus, the duration of action potential in the smooth muscle is equal to 2 ms, and that in the cardiac muscle is 0.3s., respectively. In the atrial muscle it is 0.15 ms [1, 2]. It is a kind of a guarantee of the normal cardiovascular system performance. An elevated excitability threshold can also be referred to the protective functions of the heart muscles contraction.
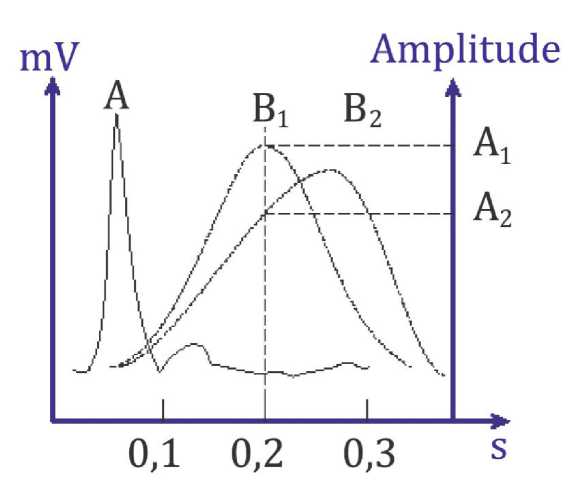
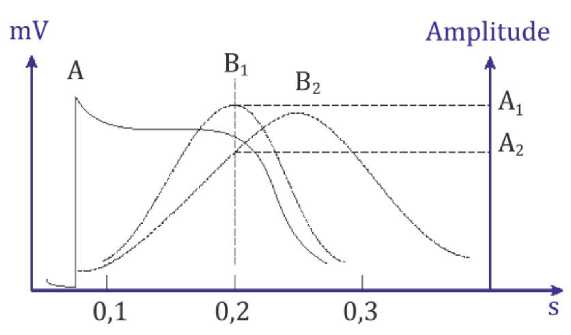
The duration of the action potential and the elevated threshold of excitability provide normal conditions for muscle contraction in each cardiac cycle phase. Another important factor is the quality of the muscle contraction and relaxation in each cardiac cycle phase. If the muscle is unable to fully perform its function of contraction in a phase, this function will be compensated by increasing the load of contraction in the other muscle groups in the next phase. It is called a compensatory mechanism.
(a)
(b)
Figure 1. A single muscle contraction: a) smooth muscle b) cardiac muscle. A - action potential; A1 , A2 - muscle contraction amplitude; B1 - normal muscle contraction, B2 -weakened muscle contraction;
Therefore, important is the quality of contraction that depends on biochemical reactions it is provided by. The source of energy for muscle contraction is ATP. After ATP hydrolysis, inter-membrane Ca2+ transport is provided, which regulates the contraction and the relaxation of the muscles. In its turn, the content of Ca2+ has influence on the enzyme activity of myosin. Another important factor is the ionic concentration of the medium, characterizing the pH-acid-base balance.
Change in the Ca2+ concentration on the muscle cell membrane surface is accompanied by a proportional change in the potential on the human skin. This process is reflected in the galvanic skin response that is registered by different instruments. The Ohm's law is the basis of such a registration. ECG is one of the forms of galvanic skin response registration (GSR). The method of ECG registration is based on recording potentials, but not the skin resistance. The signal is amplified in the frequency range of 0.35Hz to 15Hz. It is just the frequency range where the informational component of the ECG is not distorted, and where it carries more pronounced characteristics of the cardiovascular system phase processes. The lower band section of 0.35Hz is fundamentally important, as it is ideal and its increase leads to the ECG signal differentiation. Such increasing results in impossibility of unambiguous treating the ECG amplitude process or its rate of change which characterizes the energy characteristics during the analysis.
Thus, the study of the key processes highlighted above allows identifying the cardiovascular system main characteristics in full for the purpose of using them in cardiology diagnostics. These are functions of muscle contraction, expressed in the amplitude of contraction, and biochemical processes determining the muscle contraction quality. The amplitude of contraction is determined by the shape of GSR, particularly on the ECG, to analyze the compensatory mechanism processes, and biochemical reactions are used for the analysis of energy basis of muscle contraction process. Registration methods are divided into invasive and non-invasive. Non-invasive technologies should be preferred.
But the main indicator of the cardiovascular system performance is hemodynamics. Data on blood circulation are important [3]. It is the information that concentrates all the physiological significance of the cardiovascular system. Cardiovascular system functions and biochemistry are target-oriented to the normal hemodynamics maintenance. With all the normal parameters of hemodynamics, which are expressed in the phase blood volumes, the functions may change. These changes are reflected in the compensatory mechanism that offers important diagnostic criteria. In conjunction with the hemodynamic and functional parameters, the biochemical indicators characterizing the aerobic and anaerobic processes should be also considered.
Cardiovascular system baroreceptors and their role in hemodynamics control
Cardiovascular system hemodynamics is controlled by three baroreceptors: the atrioventricular (AV) node, the sinoatrial (SA) node, and the aortic baroreceptors (AB). All the three types are called baroreceptors. This term implies a semantic concept defining the principle of work, namely, bar. The bar is a unit of measure of pressure, and “baros” in Greek means “weight” [4]. On this basis, the work of the baroreceptors is evaluated by pressure. If the nodes are blood-pressure-loaded, they generate an action potential, which is transmitted through the nerve fiber and the aortic heart muscles to provide the contraction. Therefore it is very important to know the phase blood volumes. It is precisely these phase-related volumes that load the baroreceptors and start the process of contraction. The SA node controls atrial contraction, the AV node controls the IVS and myocardium contraction, and the aortic baroreceptors (AB) control the aorta contraction.
According to the laws of the formation of the ECG as a variety of GSR and based on the signal amplitude dependence on Ca2+ quantity that effects the muscles contraction, the P wave amplitude on the ECG corresponds to the amplitude of atrial muscles contraction, and the IVS and myocardium contraction amplitude corresponds to the R and S waves amplitude. The amplitude of the aorta dilation corresponds to the T wave amplitude.
An ECG can be represented as a series of sequentially connected simple harmonic sinusoidal oscillations (Fig. 2). The beginning and the end of the complete oscillation correspond to the beginning and the end of the cardiac cycle phase. This idea follows from the logic of the wave-like change of the energetic processes occurring in biological systems in nature [5-9].
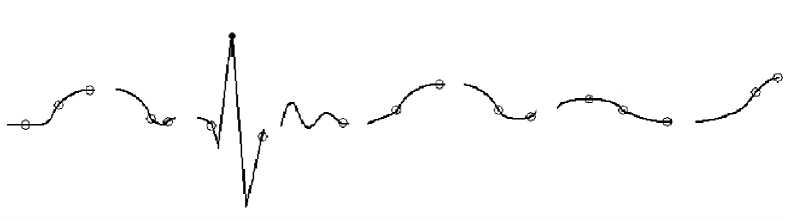
Figure 2. ECG as a sequence of harmonic sinusoidal waves. Each complete oscillation corresponds to the cardiac cycle phase.
There are phases of an increase and a decrease in every process of this sort. In each of the phases there is a maximum rate of the increase and a minimum rate of the decrease. These cases are defined by mathematical derivatives of the first order. Graphical differentiation illustrates these cases, which correspond to the maximum and minimum on the derivative curve (Fig. 3).
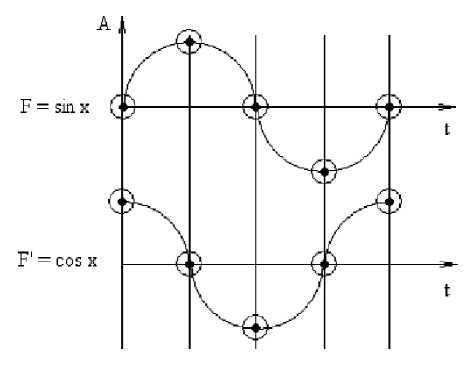
Figure 3. Sinusoidal harmonic oscillation and its first order derivative.
The concepts mentioned above are important not only for an identification of the cardiac cycle phase boundaries, but also for estimating the energy of the muscle contraction in a given phase. The amplitude of the derivative characterizes the process rate. But the rate is related to energy expenditure. The higher is the rate, the more energy is expended. Therefore, muscles contraction energy in each cardiac cycle phase can be evaluated according to the amplitude of the derivative [10].
As a result, it is possible to consider an ECG as a sequence of harmonic sinusoidal oscillations and determine the periods of baroreceptors triggering. Let us consider Figure 4 in detail, where the principle of baroreceptors performance is shown. In the upper part of the figure the sinusoidal oscillation ECG with the indicated cardiac cycle phases is presented. Below are the graphs of baroreceptor response to the blood volumes pressure during the given time period.
Results
Correlation between the ECG and the functions of action potential generation by baroreceptors At the end of the early diastole phase, when the atrioventricular valves are open, the ventricles and the atria are filled with certain blood volumes, the pressure on the SA and AV nodes remains the same. However, the SA node threshold of excitability is lower.
Because of the blood pressure in the atria it starts generating an action potential, which triggers the atrial muscle contraction that is reflected by the beginning of P-wave build up on ECG. The atrial contraction provides for atrioventricular valves closing. The P wave indicates that firstly the atria being filled with additional blood expand, and, starting from the point P on ECG, the atrioventricular valves closing begins, which ends at the point Q on ECG.
ECG
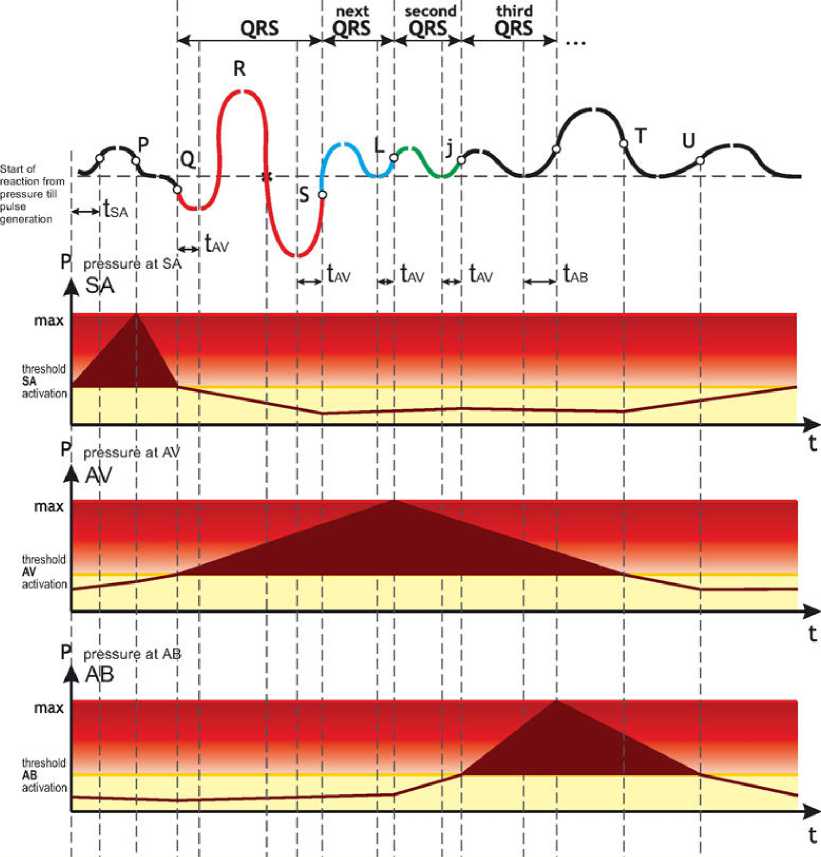
Figure 4. The principle of the heart and aortic baroreceptors performance forming an ECG.
At this time, the pressure at the AV node reaches its threshold value, and the AV node generates the action potential that triggers the IVS and myocardium contraction mechanism. This period begins at the point Q and ends at the point S on ECG. Normally, it lasts about 90ms.
It is important to know that if a blood volume is not high enough to properly load the AV node, the SA node being under the pressure starts generating an action potential for the second time contracting the atrial muscles that will be reflected on ECG as a second P-wave. In classical electrocardiology this is called atrial arrhythmia. Figure 5 shows the actual recording of the described process.
Several processes occur during the period of the IVS and myocardium contraction that corresponds to the QRS complex. The first process is a transition from the relaxed state of the heart muscles to constantly contracted muscles state till the end of systole. Another process is the creation of vortex flows in the directed blood flow in the ventricles. The third process is the creation of rotational motions of blood elements. These processes are always available, otherwise the energy will be not enough to eject the required blood volume from the ventricles.
At the end of the QRS complex, the heart muscles remain in a state of tension. In Figure 6 this state corresponds to the appearance of the constant tension component, the processes of the IVS and the myocardium contraction will be repeated because of the tension. The repeated contraction occurs because the pressure at the AV node does not change, the action potential is generated again and again, and the processes are similar to those that occur during the QRS complex. This process will be reflected in the phase of tension S – L on ECG. Only the amplitude of the IVS and myocardium contractions will be considerably lower than that during the QRS complex. This is due to the fact that the muscles in this phase will be under a constant tension. The level of tension is manifested on ECG quite clearly in case of compensatory mechanism for the IVS or myocardium weakness as an elevation above the S - L phase isoelectric line. The process in this phase is responsible for the diastolic pressure regulation. Constant tension and alternating oscillations allow ejecting the necessary blood volume through the closed aortic valve in cases of blood ejection from the peripheral organs or excessive aortic dilatation.
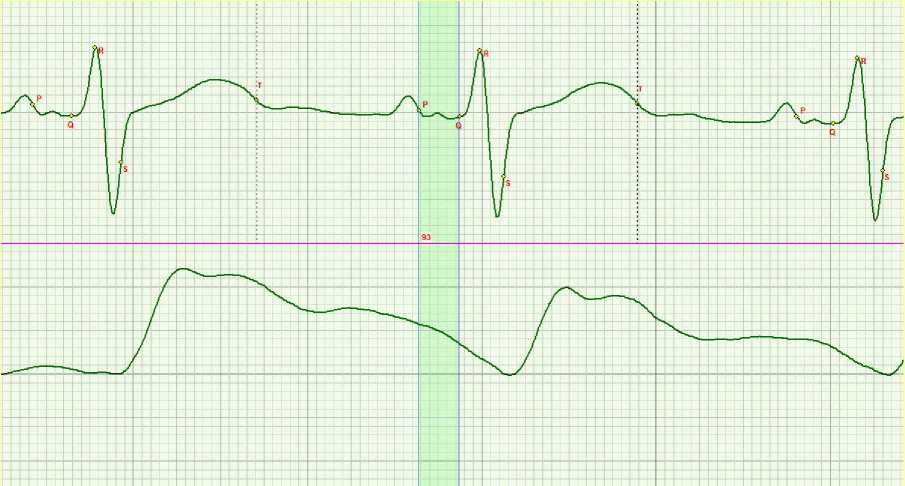
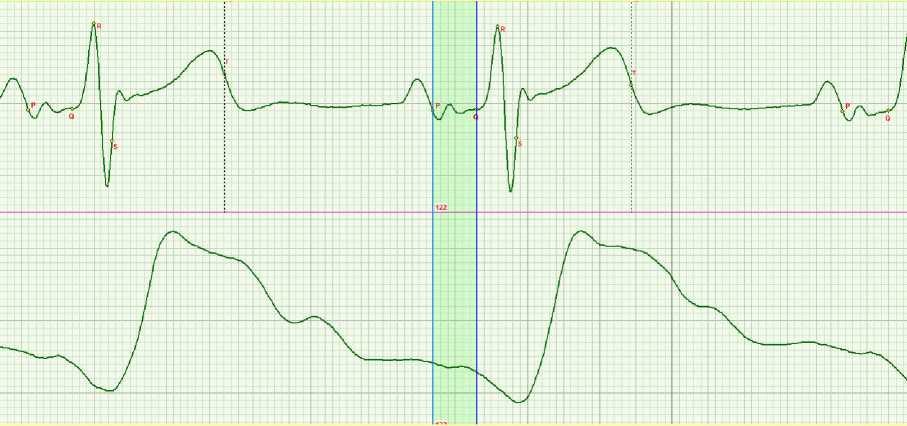
Figure 5. The second P wave generation on the ECG because of residual pressure at the SA node.
It is important to know that during the QRS complex energy is expended on the basis of energy release from aerobic processes, and in the phase of S – L it occurs on the basis of release from anaerobic processes. The higher is the constant tension, the more lactic acid is accumulated in the muscles.
In Figure 4 the S – L phase is denoted as the next QRS. This emphasizes the identity of the occurring processes. However, in the classical electrocardiology a repeated action potential is called re-entry and is interpreted as there re-entry of excitation pulse to the AV node, that actually is not observed, since the AV node is activated only by pressure, but not by electrical stimulation.
In the next phase of rapid ejection L-j the valve opens, and blood starts flowing into the aorta. The pressure at the AV node begins to decrease, but remains sufficient to generate the third AV node action potential in the given cycle. The whole procedure is repeated again. Therefore, this phase is called the second QRS in Figure 4. The energy expended in this phase also depends on the anaerobic processes. But the ATP resynthesis will require larger expenditures of phosphocreatine. Therefore, the phosphocreatine biochemical process will be more pronounced here.
The same process will be repeated in the next j - Tн phase of slow ejection. It is called the third QRS. The phosphocreatine process will also be strongly demanded here. Only at the time the blood volume is sufficient to create the necessary pressure at the aortic baroreceptors, the action potential leading to the aorta dilatation appears, which corresponds to the T wave on ECG. The aorta dilatation is necessary for transporting to the periphery the blood flow pattern created in the aorta in the L - j phase, which takes place in the elevated fluidity mode.
Discussion and conclusions
The given above principles of performance of the cardiovascular system baroreceptors make it possible to interpret the electrocardiology in a new way.
Statement on ethical issues
Research involving people and/or animals is in full compliance with current national and international ethical standards.
Conflict of interest
None declared.
Author contributions
M.Y.R., K.M., V.A.Z., S.M.R. developed the concept, analyzed the data and prepared the manuscript and, V.A.Z. drafted the manuscript and read the ICMJE criteria for authorship. All authors read and approved the final manuscript.
References Heart and aortic baroreceptors: operation in providing hemodynamic processes in cardiovascular system
- Rudenko M, Voronova O, Zernov V. Theoretical Principles of Heart Cycle Phase Analysis. ISBN 978-3-937909-57-8, München -London -New York:Fouqué Literaturverlag.
- Rudenko M, Zernov V, Voronova O. Fundamental Research on the Mechanism of Cardiovascular System Hemodynamics Self-Regulation and Determination of the Norm-Pathology Boundary for the Basic Hemodynamic Parameters and Analysis of the Compensation Mechanism as a Method of Revealing the Underlying Causes of the Disease.Heart Rhythm.November 2012;9(11):1909 DOI: 10.1016/j.jelectrocard.2013.09.016
- Glenn AL, Bulusu KV, Shu F, Plesniak MV. Secondary flow structures under stent-induced perturbations for cardiovascular flow in a curved artery model. International Journal of Heat and Fluid Flow. 2012;35:76-83.
- Rau H, Elbert T. Psychophysiology of arterial baroreceptors and the etiology of hypertension. Biological Psychology.2001;57:179-201.
- Kligfield P, Gettes LS, Bailey JJ, Childers R, Deal BJ, Hancock EW, et al. Recommendations for the Standardization and Interpretation of the Electrocardiogram. Part I: The Electrocardiogram and Its Technology A Scientific Statement From the American Heart Association Electrocardiography and Arrhythmias Committee, Council on Clinical Cardiology; the American College of Cardiology Foundation; and the Heart Rhythm Society. Circulation. 2007;115:1306-24 DOI: 10.1161/CIRCULATIONAHA.106.180200
- Krstacic G, Krstacic A, Smalcelj A, Milicic D, Jembrek-Gostovic M. The chaos theory and nonlinear dynamics in heart rate variability analysis: Does it work in short-time series in patients with coronary heart disease? ANNALS OF NON INVASIVE ELECTROCARDIOLOGY. APR 2007;12(2):130-6 DOI: 10.1111/j.1542-474X.2007.00151.x
- Krstacic G, Parati G, Gamberger D, Castiglioni P, Krstacic A, Steiner R. Heart rate variability and nonlinear dynamic analysis in patients with stress-induced cardiomyopathy. MEDICAL & BIOLOGICAL ENGINEERING &COMPUTING. OCT 2012;50(10):1037-46 DOI: 10.1007/s11517-012-0947-z
- Kundu M, Nasipuri M, Basu DK. Knowledge-based ECG interpretation: a critical review. Pattern Recognition 2000;33:351-73.
- Luo S, Macfarlane P. The value of electrocardiographic databases-some case studies. Journal of Electrocardiology. November-December 2011;44(6):746.
- Dushanin SA. Advanced methods for investigation of energy metabolism in muscles performance. Kiev1984.
