Heart Beat Classification Using Particle Swarm Optimization

Author: Ali Khazaee
Journal: International Journal of Intelligent Systems and Applications(IJISA) @ijisa
Article in issue: 6 vol.5, 2013.
Free access
This paper proposes a novel system to classify three types of electrocardiogram beats, namely normal beats and two manifestations of heart arrhythmia. This system includes three main modules: a feature extraction module, a classifier module, and an optimization module. In the feature extraction module, a proper set combining the shape features and timing features is proposed as the efficient characteristic of the patterns. In the classifier module, a multi-class support vector machine (SVM)-based classifier is proposed. For the optimization module, a particle swarm optimization algorithm is proposed to search for the best value of the SVM parameters and upstream by looking for the best subset of features that feed the classifier. Simulation results show that the proposed algorithm has very high recognition accuracy. This high efficiency is achieved with only little features, which have been selected using particle swarm optimizer.
ECG Beat Classification, SVM, PSO, Feature Selection
Short address: https://sciup.org/15010428
IDR: 15010428
Text of the scientific article Heart Beat Classification Using Particle Swarm Optimization
Published Online May 2013 in MECS
Electrocardiograms (ECG) are a non-invasive method of measuring the electrical properties of the heart. Electrocardiograms provide abundant information about the physiological state of the heart and have become one of the most important methods in diagnosing of heart disease. Heart arrhythmias result from any disturbance in the rate, regularity, and site of origin or conduction of the cardiac electric impulse [1]. Classification of arrhythmia is an important step in developing devices for monitoring the health of individuals.
In the literature, Several computer-aided heart beat classification algorithms have been proposed for this task. Among the most recently published work are those presented in [2]–[19]. In [2], the authors used wavelet feature extraction in tandem with genetic algorithms for classification of ECG beats. In [3], the authors presented an effective cardiac arrhythmia classification algorithm using the heart rate variability signal. The proposed algorithm is based on the generalized discriminant analysis feature reduction scheme and the support vector machine classifier. In [4] the authors proposed new morphological features; also they used temporal features together their morphological features. They adopted multi-layer perceptron (MLP) neural networks with various training algorithms as their classifier. In [5], the author used independent components analysis for ECG detection. In [6], the authors utilized the temporal features. In [7, 8], the authors used wavelet transform and power spectral density of ECG signals, respectively. In [9], an imagebased technique is presented which extracts discriminative information from the trajectories of ECG signals in the state space. The method presented in [10] used SVM for classification of heart beats. In [11], the authors used Lyapunov exponents as their features and a recurrent neural network trained them to differentiate between four types of beats. In [12], different classification systems based on linear discriminant classifiers are explored. In [13], the authors used Hermit functions and self-organizing maps for clustering of ECG signals. In [14], a power spectral based method is proposed for the classification of cardiac arrhythmias. In [15], an automatic online beat segmentation and classification system based on a Markovian approach is proposed. In [16], a Gaussian mixture model based classifier is presented for ECG classification after the registration of ECG signal using Pan-Tompkins algorithm. The classification scheme is based on the principle components extracted from the ECG features using principal component analysis. In [17], a rulebased rough-set decision system is presented for the development of an inference engine for disease identification. In [18], a patient-adapting heart beat classifier system based on linear discriminants is proposed. In [19], the authors used different classifiers such as SVMs and MLP neural networks.
As mentioned above, artificial neural networks (ANNs) have been widely applied for detecting arrhythmias. However, the practicability of ANNs is limited due to some weaknesses [20]. Using SVMs is the method that is receiving increasing attention, with remarkable results recently [21]. The main difference between ANNs and SVMs is the principle of risk minimization.
The largest problems encountered in setting up the SVM model are how to select the kernel function and its parameter values. The parameters that should be optimized include the penalty parameter (C) and the kernel function parameters such as the value of gamma (Y) for the radial basis function (RBF) kernel. On the other hand, one of the other SVM classifier problems is selecting the number of features. Therefore, both suitable feature subset selection and model parameter setting play an important role in the classification performance [22]. In this study, particle swarm optimization (PSO) is chosen as an optimization technique to optimize the input feature subset selection and the SVM parameters setting simultaneously.
This paper is organized as follows. Section 2 describes the efficient features. Section 3 describes the concepts needed, including the basic SVM and PSO concepts. Section 4 describes the PSO-SVM hybrid system. Section 5 describes the experimental design, including the data description and experiment settings. Some of the evaluation results of this system are given in Section 6. Finally, Section 7 concludes with a discussion of the paper.
-
II. Efficient Features
Feature extraction plays an important role in any classification task. In this work, based on extensive research, we have used a balanced combination of morphological and timing features. These features describe the basic shape of the signals and position of waves within a given window of beats. The extracted parameters that describe the basic shape of the beats are: amplitude of P-peak (amP), amplitude of Q-valley (ampQ), amplitude of R-peak (ampR), amplitude of S-valley (ampS) and amplitude of T-peak (ampT). Features that describe wave position within a beat window are: position of P-peak (posP), position of Q-valley (posQ), position of R-peak (posR), position of S-valley (posS) and position of T-peak (posT). The time duration between PVC beats contains useful information about their types. So we define three features called nxtRR, prevRR and ratRR. These features are defined as the time interval between the next (nxtRR), and the previous (prevRR) beats and also the time ratio between the last beat to the next one (ratRR), respectively. To extract these features we propose a two-steps method. The first step involves the cutting of the normal and PVC and other beats by making use of the annotation files which exist in MIT-BIH arrhythmia database. The second step involves identification of peaks and valleys in every normal or abnormal beat and obtaining their respective amplitudes and positions.
In order to break to normal and abnormal beats, we process annotated file records from MIT-BIH database. For example to extract the normal beats, the algorithm examines the annotation file which contains the indices of the normal beat. Then it creates a matrix with rows equal to the number of normal beats. An R-wave detector is required to initialize our computer-aided
ECG classification process. Afterwards, the algorithm saves 180 samples surrounding the target normal beat from all the recorded samples. The sample beat itself is also saved in the final matrix. We also extracted the abnormal beats in the same manner.
After classification of normal and abnormal beats, peaks and valleys are detected. For this purpose, we implemented the Al-Alaoui algorithm [23]. The peak and valley detector recognizes the P, Q, R, S, and T waves. A normalization procedure is introduced to eliminate the effect of amplitude changes. The 180-sample vectors, before extraction of features, were normalized to a mean of zero and standard deviation of unity.
In addition to the morphological features, we also extracted three local timing features that contributed to the discriminating power of morphology-based features, especially in discriminating morphologically similar heartbeat patterns. They are an R-R time interval ratio (IR) and two R-R time intervals. The IR ratio feature reflects the deviation from a constant beat rate and was defined as:
iR i =
Г-Г ,
- 1
T 1 -T
±I + 1 ^z
T where i represents the time at which the R-wave for beat i occurs. The local RR-interval ratio information was chosen as opposed to other parameters such as average RR-interval because it provides a convenient differentiator between normal beats
( IR ~ 1)
i and PVC
к t ( IR < 1)
beats i
and is normalized by definition
( i at constant rate). Two other timing features are the next and previous R-R time intervals for each heartbeat. Each feature vector is then normalized to have a zero-mean and a unit variance.
-
III. Needed Concepts3.1 Support Vector Machine (SVM)
-
3.1.1 Binary SVM
We have proposed a multi-class SVM based classifier. SVM is a supervised machine learning method that was originally developed for binary classification problems, but it can be used for multi-class classification [24]. SVM, uses structural risk minimization (SRM) principle whereas in ANN, empirical risk minimization (ERM) is used minimizing the error on the training data [25]. Following subsections describe the binary SVM classifier and multi-class SVM classifier.
SVM performs classification tasks by constructing optimal separating hyper-planes (OSH). OSH maximizes the margin between the two nearest data points belonging to two separate classes.
Suppose the training set,
(xi, УЧ), i = 1,2,....l, x e Rd, У e{-l,+l} can can e separated by the hyper-plane w x+ b = 0, where w is the weight vector and b is bias. If this hyper-plane maximizes the margin, then the following inequality is valid for all input data:
y i ( w T x i + b ) > 1, for all x i i = 1,2,..., /
2/1 W|
The margin of the hyper-plane is . Thus, the problem is the maximizing of the margin by minimizing of w subject to (2). This is a convex quadratic programming (QP) problem and Lagrange multipliers (ai,i = 1,...,/;ai > 0) are used to solve it:
LP = |llwl 12^ai [У (w Txi + b)-1]
i = 1 (3)
After minimizing LP with respect to w and b , the optimal weights are given by:
l
** w =^ау--x i i=1
The dual of the problem is given by [25]: l ll
L d = У a i — 1 Е^ у^ iT X j i = 1 2 i = 1 j = 1
У1 ( w T xi + b ) > 1 - ^ for i = 1,2,..., /
To obtain the OSH, it should be minimizing the l
ф=2I HI + C У. ^i i =1 subject to (23), where C is the penalty parameter, which controls the tradeoff between the complexity of the decision function and the number of training examples, misclassified.
In the nonlinearly separable cases, the SVM map the training points, nonlinearly, to a high dimensional
K ( xi, x j )
feature space using kernel function j , where linear separation may be possible. The kernel functions of SVMs are as follows:
Linear: K(xi' xj) = xixj(9-1)
Gaussian radial basis function (GRBF):
K ( x i -, X j ) = exp(-|| x i - x j | |2/2 ст 2)
(9-2)
Sig ОО K(X- xj) = tanhbX'-X+ П)
where CT , d, Y and П are the parameters of the kernel functions. After a kernel function is selected, the QP problem will become:
To find the OSH, it must maximize Ld under the l l a y = 0
constraints of i =1 . The Lagrange multipliers are only non-zero (a ^ 0) when yi(w Xi + b) = 1 . Those training points, for which the equality in (2) holds, are called support vectors (SV) that can satisfy ai ^ 0 . The optimal bias is given by:
l ll
L d = y « i - 1 yy «^ j yy j K ( x i , x j ) i = 1 2 i = 1 j = 1
*
the i is derived by:
* *T b = yi — w xi
« i = arg max Ld
a
l
0 < a i < C ; i = 1,2,..., / ; ^ a i y i = 0
j = 1
for any support vector x i . The optimal decision function (ODF) is then given by:
l f (x) = sgn(^ yaqxT xi+ b *)
1=1 (7)
*
where i ’s are optimal Lagrange multipliers.
For input data with a high noise level, SVM uses soft margins can be expressed as follows with the introduction of the non-negative slack variables ^i,i = 1’-"1:
After training, the following, the decision function, becomes:
l
f ( x ) = sgn( ^ y a * K ( x , x i ) + b *)
i = 1
The performance of SVM can be controlled through the term C and the kernel parameter which are called hyper-parameters. These parameters influence on the number of the support vectors and the maximization margin of the SVM.
-
3.1.2 Multi-class SVM-based Classifier
-
3.2 Particle Swarm Optimization
There are two widely used methods to extend binary SVMs to multi-class problems [26]. One of them is called the one-against-all (OAA) method. Suppose we have a P-class pattern recognition problem, P independent SVMs are constructed and each of them is trained to separate one class of samples from all others. When testing the system after all the SVMs are trained, a sample is input to all the SVMs. Suppose this sample belongs to class P1 ideally only the SVM trained to separate class P1 from the others can have a positive response. Another method is called one-against-one (OAO) method. For a P-class problem, P (P - 1)/2 SVMs are constructed and each of them is trained to separate one class from another class. Again, the decision of a testing sample is based on the voting result of these SVMs. The structure of this classifier is showed by Fig. 1.
As mentioned the performance of multi-class SVM based classifier can be controlled through hyperparameters of the SVMs. In this paper we have an optimization algorithm, namely PSO for selection of the optimal values of these parameters. Next section describes this optimization method.
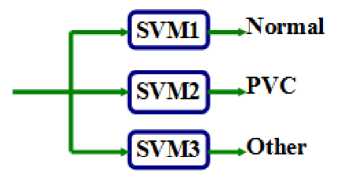
Fig. 1: The structure of the classifier
This section provides a brief introduction to basic PSO concepts. PSO is a form of stochastic optimization technique originally developed by Kennedy and Eberhart [27] that originated from the simulation of the behavior of a group of a flock of birds or school of fish or the social behavior of a group of people. Each individual flies in the search space with a velocity which is dynamically adjusted according to its own flying experience and its companions' flying experience, instead of using evolutionary operators to manipulate the individuals like in other evolutionary computational algorithms. Each individual is considered as a volumeless particle (a point) in the N-dimensional search space. At time step t , the ith particle is represented as X‘ ( t ) = ( x 1 (t ), x ‘ 2 ( t),■■■,x iN ( t )) . The set of positions of m particles in a multidimensional space is identified
X = {X,...,X ,...,X ,...,Xm } as 1 j l m . The best previous position (the position giving the best fitness value) of the ith particle is recorded and represented as Pi (t) (p11, p‘2,..., pN ). The index of the best particle among all the particles in the population (global model) is represented by the symbol g . The index of the best particle among all the particles in a defined topological neighborhood (local model) is represented by the index subscript l . The rate of movement (velocity) for particle i at time step t is represented as V(t) = (v‘i(t),vi2(tX—,vN(t)) . The particle variables are manipulated according to the following equation (global model [27]):
v n ( t ) = W x v n ( t - 1)
+ c i x rand 1() x ( p m - X ‘ n ( t - 1)) (13)
+ c 2 x rand 2() x ( p n - x to ( t - 1))
x in ( t ) = x in ( t - 1) + v in ( t )
where n is the dimension (1 < n < N ) , c 1 and c 2 are rand 1() rand 2()
positives constants, and are two random functions in the range [0, 1], and w is the inertial weight.
The inertial weight is linearly decreasing [28] according to the following equation:
W„ maxmin tmax max
For the neighborhood ( lbest )
model, the only change
is to substitute p n for pgn in the equation for velocity. This equation in the global model is used to calculate a particle's new velocity according to its previous velocity and the distance of its current position from its own best
( pbest )
experience
( gbest )
and the group's best experience
The local model calculation is identical, except that the neighborhood's best experience is used instead of the group's best experience.
Particle swarm optimization has been used for approaches that can be used across a wide range of applications, as well as for specific applications focused on a specific requirement. Its attractiveness over many other optimization algorithms relies in its relative simplicity because only a few parameters need to be adjusted.
-
IV. Classification Modeling by the Combination ofPSO and a Support Vector Machine (PSO-SVM)
In this research, a nonlinear SVM based on the popular Gaussian kernel (SVM-RBF) has been studied. The largest problems encountered in setting up the SVM model are how to select the kernel function and its parameter values. The parameters that should be optimized include the penalty parameter (C) and the kernel function parameters such as the value of gamma ( Y) for the radial basis function (RBF) kernel.
On the other hand, one of the other SVM classifier problems is selecting the number of features. With a small and appropriate feature subset, the rationale for the classification decision can be realized more easily. Therefore, both suitable feature subset selection and model parameter setting play an important role in the classification performance [22].
Particle representation . The particle is comprised of three parts: the input features, C, and Y , when the RBF kernel is selected. Fig. 2 illustrates the representation of a particle with dimension n + 2, where n is the total number of input features (variables) of a data set. The value of the n variables ranges between 0 and 1. If the value of a variable is less than or equal to 0.5, then its corresponding feature is not chosen. Conversely, if the value of a variable is greater than 0.5, then its corresponding feature is chosen (see Fig. 2).
Fitness function. The fitness function is used to evaluate the quality of every particle which must be designed before searching for the optimal values of both the SVM parameters and the feature selection. The fitness function is based on the classification accuracy of the SVM classifier.
|
Input features |
C |
Y |
|
|
Particle |
x x ................ x |
x n + 1 |
x n + 2 |
Fig. 2: Particle representation
-
V. Experiment Design5.1 MIT-BIH Arrhythmia Database
-
5.2 Experiment settings
In the experiments, we considered a nonlinear SVM based on the popular Gaussian kernel (SVM-RBF). The related parameters C and Y for this kernel were varied in the arbitrarily fixed ranges [1, 100000] and [0, 1] so as to cover high and small regularization of the classification model, and fat as well as thin kernels, respectively. In addition, for comparison purposes, we implemented, in the first experiment, the SVM classifier with two other kernels, namely linear and polynomial kernels, leading therefore to two other SVM classifiers, termed as SVM-linear and SVM-poly, respectively. The degree d of the polynomial kernel was varied in the range [2, 5] in order to span polynomials with low and high flexibility. In the particle swarm, there are several coefficients whose values can be adjusted to produce a better rate of convergence. Table 1 shows the coefficient values in the PSO algorithm.
The MIT-BIH arrhythmia database [29] was used as the data source in this study. The database contains 48 recordings. Each has a duration of 30 minutes and includes two leads; the modified limb lead II and one of the modified leads V1, V2, V4 or V5. The sampling frequency is 360 Hz, the data are bandpass filtered at 0.1–100 Hz and the resolution is 200 samples per mV. Twenty-three of the recordings are intended to serve as a representative sample of routine clinical recordings and 25 recordings contain complex ventricular, junctional, and supraventricular arrhythmias. There are over 109,000 labelled ventricular beats from 15 different heartbeat types. There is a large difference in the number of examples in each heart beat type. The largest class is “Normal beat” with about 75,000 examples and the smallest class is “Supraventricular premature beat” (SP) with just two examples.
The database is indexed both in timing information and beat classification. For more details about MITBIH Arrhythmia database see [30]. We used a total of 12 records from the database. We extracted a total of
30,873 beats; 22,476 normal beats, 5,394 abnormal PVC arrhythmia beats, and 3,003 other arrhythmic beats. We used the database index files from database to locate beats in ECG signals.
Table 1: Coefficient values in the PSO algorithm
|
Swarm size |
20 |
|
Acceleration constant |
3 |
|
Maximum velocity |
8 |
|
Maximum number of iterations |
200 |
|
Size of the local neighborhood |
2 |
|
Constants C1=C2 |
2 |
-
VI. Results
-
6.1 Experiment 1: classification in the whole original hyper-dimensional feature space
-
6.2 Experiment 2: performance evaluation with optimization in different runs
As the first experiment, we applied the SVM classifier directly on the entire original hyperdimensional feature space, which is made up of 13 features. The performances of the one-against-one (OAO) and the one-against-all (OAA) methods using the SVM classifier with different kernels are compared in Table 2. We chose the best SVM classifier parameter values to maximize this prediction.
As reported in Table 2, the percentage recognition accuracies of the OAO and OAA methods achieved with the SVM classifier based on the Gaussian kernel (SVM-RBF) on the test set were equal to 95.1970% and 95.0913%, respectively. These results were better than those achieved by SVM-linear and SVM-poly. Indeed, the percentage recognition accuracies of the OAO (and OAA) methods were equal to 93.8427% (92.0160%) for the SVM-linear classifier and 95.0253% (94.8006%) for the SVM-poly classifier.
In this experiment, we trained the SVM classifier based on the Gaussian kernel, which proved in the previous experiments to be the most appropriate kernel for ECG beat classification; then, to evaluate the performance of the proposed algorithm (PSO-SVM), eight different runs were performed. PSO finds the best combination of the parameters of the SVM classifier
Table 2: Performance comparison of the one-against-one (OAO) and one-against-all (OAA) methods with different kernels
|
Method |
Recognition accuracy (%) |
Normal |
PVC |
Other |
||
|
SVM-linear |
OAO |
93.8427 |
Normal |
21755 |
197 |
324 |
|
PVC |
447 |
4410 |
337 |
|||
|
Other |
437 |
122 |
2244 |
|||
|
SVM-linear |
OAA |
92.0160 |
Normal |
21297 |
309 |
670 |
|
PVC |
470 |
4441 |
283 |
|||
|
Other |
528 |
157 |
2118 |
|||
|
SVM-poly |
OAO |
95.0253 |
Normal |
22010 |
141 |
125 |
|
PVC |
368 |
4494 |
332 |
|||
|
Other |
429 |
111 |
2263 |
|||
|
SVM-poly |
OAA |
94.8006 |
Normal |
21868 |
245 |
163 |
|
PVC |
266 |
4567 |
361 |
|||
|
Other |
410 |
129 |
2264 |
|||
|
SVM-rbf |
OAO |
95.1970 |
Normal |
22024 |
135 |
117 |
|
PVC |
339 |
4526 |
329 |
|||
|
Other |
423 |
111 |
2269 |
|||
|
SVM-rbf |
OAA |
95.0913 |
Normal |
21887 |
213 |
176 |
|
PVC |
228 |
4616 |
350 |
|||
|
Other |
397 |
122 |
2284 |
|||
Table 3: Selected features and the optimal values of the SVM classifier parameters for different runs
|
Run |
Unnecessary features |
Size of features |
γ |
C |
Best fitness |
|
#1 |
[6,8] |
11 |
0.0086 |
28597.68 |
97.21 |
|
#2 |
[6,8] |
11 |
0.0085 |
29122.62 |
97.19 |
|
#3 |
[1,5,6,8] |
9 |
0.0019 |
177892.44 |
97.15 |
|
#4 |
[8,11] |
11 |
0.0038 |
61024.65 |
97.18 |
|
#5 |
[8,11] |
11 |
0.0041 |
55219.29 |
97.18 |
|
#6 |
[6,8,11] |
10 |
0.0020 |
211879.98 |
97.12 |
|
#7 |
[7,13] |
11 |
0.0823 |
710.01 |
97.03 |
|
#8 |
[1,4,5,7,10,11,13] |
6 |
0.1434 |
2853.45 |
97.05 |
And features to gain the fitness function maximum. More detailed information about the selected features and the optimal values of the SVM classifier parameters (i.e., the γ parameter and optimal values of the C parameter) obtained by the proposed algorithm (PSO-SVM) are shown in Table 3. The proposed algorithm successfully finds the global optimum just with 200 iterations. It can be seen that the sixth, eighth and eleventh features were the most unnecessary features among multiple runs. Using eleven features and optimum SVM parameters, the proposed PSO-SVM algorithm produced the best accuracy of 97.21%. Fig. 3 and Fig. 4 show the values of sixth and eighth features for 100 samples of each of three classes. As it can be seen, these features don't provide good discrimination for three classes. However, other features such as 10th and 12th (Fig. 5 and Fig. 6) provide good discrimination for Other and PVC classes.
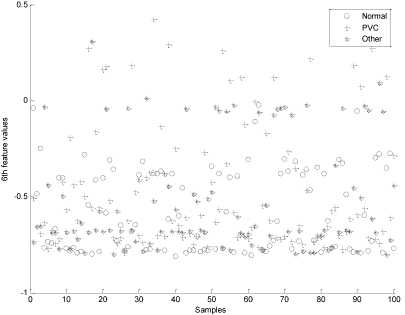
Fig. 3: scatter plot of the sixth feature for 100 samples of three classes
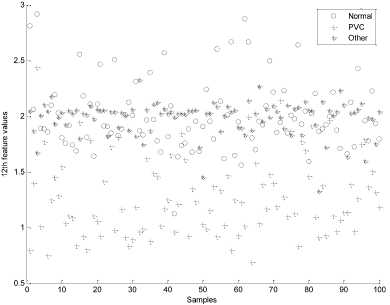
Fig. 6: scatter plot of the 12th feature for 100 samples of three classes
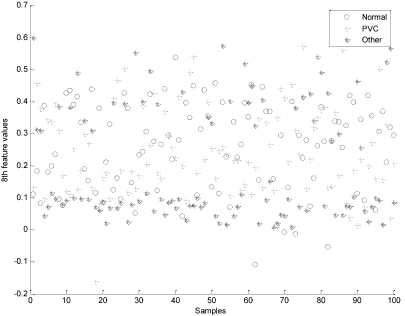
Fig. 4: scatter plot of the eighth feature for 100 samples of three classes

Fig. 5: scatter plot of the tenth feature for 100 samples of three classes
-
VII. Discussion and Conclusion
In this study, PSO-SVM approach is proposed for an automatic ECG beat classification. This approach presents methods for improving SVM performance in two aspects: feature selection and parameter optimization. The new method that proposed in this paper is the combination of a support vector machine and particle swarm optimization (PSO-SVM). This modified PSO is jointly applied to optimize the feature selection and the SVM kernel parameter.
Ten morphological features are extracted. Three timing features are extracted as well. This combination of features captures all the temporal and shaping aspects of beats to classify ECG beats in three different classes.
The SVM was employed as the classifier. In the first experiment the OAO and OAA SVM using linear, polynomial with various orders and GRBF kernels were examined. As reported in Table 2, the percentage recognition accuracy achieved with the SVM classifier based on the Gaussian kernel (SVM_rbf) using OAO method on the test set was better than those achieved by SVM-linear and SVM-poly with various orders. So, GRBF kernel and OAO strategy was used in other experiments. We evaluated the proposed model using a data set in the second experiment. The simulation results indicate that the PSO-SVM method can correctly select the discriminating input features and also achieve high classification accuracy (97.21%, see Table 3). This high efficiency is achieved with 11 features, which have been selected using the particle swarm optimizer. From the obtained experimental results, it is obvious that the proposed PSO-SVM approach boosts the generalization capability achievable with the SVM classifier and can achieve high classification accuracies while training beats are limited.
References Heart Beat Classification Using Particle Swarm Optimization
- G. D. Clifford, F. Azuaje, and P. E. McShary, Advanced methods and tools for ECG data analysis, Artech House, Norwood, MA 02062, 2006.
- A. E. Zadeh, A. Khazaee, High Efficient System for Automatic Classification of the Electrocardiogram Beats, Ann Biomed Eng. 2011;39(3):996-1011.
- B. Mohammadzadeh Asl, S. K. Setarehdan, M. Mohebbi, Support vector machine-based arrhythmia classification using reduced features of heart rate variability, Artificial Intelligence in Medicine, vol. 44, 2008, pp. 51-64.
- A. Ebrahimzadeh, A. Khazaee, Detection of premature ventricular contractions using MLP neural networks: A comparative study, Measurement 43 (2010) 103–112.
- S.N. Yu, K.T. Chou, Selection of significant for ECG beat classification, Expert Syst. Appl. 36 (2009) 2088–2096.
- T. Ince, S. Kiranyaz, and M. Gabbouj, A Generic and Robust System for Automated Patient-Specific Classification of Electrocardiogram Signals, IEEE Trans. Biomed. Eng., vol.56, 2009, pp.1415 - 1426.
- A. Ebrahimzadeh, A. Khazaee, An efficient technique for classification of Electrocardiogram signals, Advances in Electrical and Computer Engineering 9 (2009) 89-93.
- C.H. Lin, Frequency-domain features for ECG beat discrimination using grey relational analysis-based classifier, Comput. Math. Appl., vol. 55, 2008, pp. 680–690.
- R.R. Sarvestani, R. Boostani, M. Roopaei, VT and VF classification using trajectory analysis, Nonlinear Anal. 2008, doi:10.1016/ j.na.2008.10.015.
- E. D. Ubeyli, Support vector machines for detection of electrocardiographic changes in partial epileptic Engineering Applications of Artificial Intelligence patients, vol. 21, 2008, pp. 1196-1203.
- P. Chazal, M. O’Dwyer, RB. Reilly, Automatic classification of heartbeats using ECG morphology and heartbeat interval features, IEEE Trans. Biomed. Eng. vol. 51, 2004, pp.1196–1206.
- M. Lagerholm et al., Clustering ECG complexes using Hermite functions and self-organizing maps, IEEE Trans. Biomed. Eng., vol. 47, 2000, pp.839–847.
- L. Khadra, A.S. Al-Fahoum, S. Binajjaj, A quantitative analysis approach for cardiac arrhythmia classification using higher order spectral techniques, IEEE Trans. Biomed. Eng., vol. 52, 2005, pp. 1840–1845.
- A. Khazaee, A. Ebrahimzadeh, Classification of electrocardiogram signals with support vector machines and genetic algorithms using power spectral features, Biomedical Signal Processing and Control 5 (2010) 252–263.
- R. JoyMartis, C. Chakraborty, A. K. Ray, A two-stage mechanism for registration and classification of ECG using Gaussian mixture model, Pattern Recognition, 42 (2009) 2979–2988.
- S. Mitra, M. Mitra, B.B. Chaudhuri, A rough set-based inference engine for ECG classification, IEEE Trans. Instrum. Meas. 55 (2006) 2198–2206.
- F. de Chazal, R.B. Reilly, A patient adapting heart beat classifier using ECG morphology and heartbeat interval features, IEEE Trans. Biomed. Eng. 53 (2006) 2535–2543.
- S. Osowski, T. Markiewicz, L. T. Hoai, Recognition and classification system of arrhythmia using ensemble of neural networks, Measurement, vol. 41, 2008, pp. 610–617.
- A. Ebrahimzadeh, A. Khazaee, V. Ranaee, Classification of the electrocardiogram signals using supervised classifiers and efficient features, computer methods and programs in biomedicine 99 (2010) 179–194.
- Mohamed EA, Abdelaziz AY, Mostafa AS. A neural network-based scheme for fault diagnosis of power transformers. Electric Power Systems Research 2005;75(1):29–39.
- Vapnik V. The nature of statistical learning theory. New York: Springer-Verlag;1995.
- Huang CL, Wang CJ. A GA-based attribute selection and parameter optimization for support vector machine. Expert Syststems With Applications 2006;31(2):231–40.
- M. A. Al-Alaoui, A unified analog and digital design to peak and valley detector, window peak and valley detectors, and zero crossing detectors, IEEE Transactions on Instrumentation and Measurement, vol. 35, pp. 304-307, 1986.
- C. Cortes, and V. Vapnic, Support Vector Network, Machine Learning, vol. 20, pp.1-25, 1995.
- C. Burges A Tutorial on Support Vector Machines for Pattern Recognition, Data Mining and Knowledge Discovery, vol. 2, pp 121-167,1998.
- B. Scholkopf, C. Burges, and V. Vapnik, Extracting support data for a given task, ICKDDM, pp. 252-257,1995.
- Eberhart RC, Kennedy J. A new optimizer using particle swarm theory. In: Proc. ISMMH S. 1995. p. 39–43.
- Shi YH, Eberhart RC. Empirical study of particle swarm optimization. In: Proceedings of the congress on evolutionary computation. 1999. p. 1945–50.
- R.G. Mark, and G. B. Moody, MIT-BIH Arrhythmia Database 1997 [Online]. Available: http://ecg.mit.edu/dbinfo.html
- G. B. Moody, and R. G. Mark, The impact of the MIT/BIH arrhythmia database,” IEEE Eng. Med. Biol. Mag., vol. 20, no. 3, pp. 45–50, May- Jun. 2001.
