Hierarchical Clustering Algorithm based on Attribute Dependency for Attention Deficit Hyperactive Disorder

Author: J Anuradha, B K Tripathy
Journal: International Journal of Intelligent Systems and Applications(IJISA) @ijisa
Article in issue: 6 vol.6, 2014.
Free access
Attention Deficit Hyperactive Disorder (ADHD) is a disruptive neurobehavioral disorder characterized by abnormal behavioral patterns in attention, perusing activity, acting impulsively and combined types. It is predominant among school going children and it is tricky to differentiate between an active and an ADHD child. Misdiagnosis and undiagnosed cases are very common. Behavior patterns are identified by the mentors in the academic environment who lack skills in screening those kids. Hence an unsupervised learning algorithm can cluster the behavioral patterns of children at school for diagnosis of ADHD. In this paper, we propose a hierarchical clustering algorithm to partition the dataset based on attribute dependency (HCAD). HCAD forms clusters of data based on the high dependent attributes and their equivalence relation. It is capable of handling large volumes of data with reasonably faster clustering than most of the existing algorithms. It can work on both labeled and unlabelled data sets. Experimental results reveal that this algorithm has higher accuracy in comparison to other algorithms. HCAD achieves 97% of cluster purity in diagnosing ADHD. Empirical analysis of application of HCAD on different data sets from UCI repository is provided.
Hierarchical Clustering, Attribute Dependency, ADHD, Cluster Purity
Short address: https://sciup.org/15010568
IDR: 15010568
Text of the scientific article Hierarchical Clustering Algorithm based on Attribute Dependency for Attention Deficit Hyperactive Disorder
Published Online May 2014 in MECS
Attention Deficit Hyperactive Disorder also recognized as Hyperkinetic disorder rooted by an unknown factor that disrupts the processing of brain. This makes it difficult for an individual in sustaining attention till completion of a task, without waiting for their turn, acting recklessly which in turn affects their academic performances like reading, writing, communicating and lowers their confidence. It is well noticed among school going children of the age group between 6 and 13 years. Kids with these symptoms are considered as unworthy and having low learning motivation, poor self esteem, social rejection and rejected by their peer children [1] [2]. It is found in literature that around 10% of the school going children suffers from ADHD [3]. The diagnostic reports reveal that the percentage of boys reported to have ADHD is comparatively higher than that of girls. The symptoms are very difficult in differentiating it from other disorders that increases the risk of being misdiagnosed or remain undiagnosed. Correct and early diagnosis is more vital to overcome their academic challenges and lack of diagnosis may worsen their behavior. Also, proper diagnosis helps the teachers and parents in handling those children in a different way.
DSM-IV [4][5] diagnostic criteria is used for diagnosing ADHD. Figure 1.1 (see Appendix - I) shows the criteria and their sub types for identifying ADHD. The sub – types include inattention, hyperactive and impulsive and their combined type. The behavioral disorders are studied through 13 characteristics (attributes) like careless mistakes, sustaining attention, listening, following instruction, organizing tasks, loss of attention, distraction, forgetting activities, fidgets, engaging activities, talking excessively, blurting answers and interrupts. The values assumed by these characteristics are of the form yes/no answers.
Clustering, which has attained a major focus of research under unsupervised learning is being applied in various fields not limited to data mining, pattern recognition, statistics, machine learning, image processing, medical diagnosis and digital signal processing. The proposed hierarchical clustering algorithm (HCAD) is applied for medical diagnosis to classify the students with ADHD in academic environment. Classification and clustering techniques play vital roles in identifying hidden patterns from a given data sets. Clustering is a technique for grouping of data with similar properties. There are various clustering techniques which include partitioning approaches, Hierarchical methods, Density based methods and Grid based methods. The partition approaches like centroid based clustering and representative object based technique fix the centroid for the desired number of clusters and data are added to each of these clusters based on the distance between the data and the centroid. On further iterations the best centroids are selected with in each cluster and the cluster objects are refined based on the similarity and dissimilarity measures between intra clusters and inter cluster respectively. Hierarchical methods like BIRCH, Chameleon and Probabilistic hierarchical clustering use agglomerative and divisive methods [6]. The agglomerative method follows a bottom up approach, where the data sets are initially formed into different groups and on iteration they are combined with other groups until desired number of clusters is formed. The divisive method follows a top down approach, where the entire data set is considered as one cluster and on iteration they are partitioned into different clusters until desired number of clusters is formed.
Density based methods like Dbscan, Optics and Denclue [6] form the clusters based on dense relation between objects in the data space. The clusters formed by this approach are of arbitrary shapes. Grid-Based methods like Sting and Clique, partition the data space into grids or cells, independent of the distribution of input objects. Its processing time is independent of data objects but dependent on the number of grids. Each one of these techniques has its own merits and demerits based on the data sets and applications. In this paper we are going to discuss on key issues of Hierarchical clustering technique and we propose an algorithm called Hierarchical clustering algorithm based on attribute dependencies (HCAD) also, the superiority of HCAD over many existing algorithms in this direction. The organisation of the rest of the paper is as follows.
An elaborative literature review is presented in section 2, which provides the background of the work to be carried out in this paper. In section 3, we introduce the algorithm along with the formulae and concepts required for its understanding. In Section 4, we first make an analysis of the results of the application of HCAD on various well known data sets including the ADHD data set. Next, we make a comparative study of computational time, cluster purity and entropy between HCAD and other algorithms. In section 5 we provide the concluding remarks and some directions for further research.
Hierarchical clustering provides a clear understanding of the classified data pictorially through a dendogram. Single link algorithm is an agglomerative clustering that merges all the sub clusters closer to the larger cluster but has the drawback of leaving smaller sub clusters away from the larger cluster (called dispersion degree) [7]. It also has a disadvantage that the relatively larger subclusters tend to absorb the other sub-clusters during the merging process [8]. The clusters formed by this method (nearest neighborhood) achieve local proximity. The complete linking of the same type uses farthest neighborhood to merge the neighbor clusters. Though this technique overcomes dispersion degree, it finds difficulty in merging larger clusters but achieves global proximity [6].
UPGMA [9] overcomes the tradeoff between dispersion degree and global proximity by using group average scheme. Algorithms like Hybrid hierarchical clustering (BHHC) requires prior knowledge about the data for clustering. The parameters like cluster center and number of clusters influence the cluster partitioning [10]. The Block modeling hierarchical clustering algorithm (HCUBE) uses structural equivalence between a pair of objects to identify the similarity between them. It has been successfully applied in social networking to identify the distinct cluster of pages to achieve the similar pages in a cluster. Two pages X and Y are considered to be structurally equivalent if their connections to the network are identical [11]. These relations are represented in relation matrix and Dissimilarity matrix. The closeness
and inter-connectivity between the objects are identified using Euclidean distance or density function with in each cluster and is measured through variance formula [12]. Ordinal consistency clustering algorithm preserves the strict partial ordering based on the dissimilarity measures for hierarchical partitioning, which fails when the data ordering changes. The divisive order invariant approach works effectively in presence of missing and noisy data but only provides binary split [8].
The Leaders – Sub leaders based hierarchical clustering algorithm uses representatives (leaders) and sub representatives (sub leaders) of the clustering [10] [13]. This sort of algorithms work in two stages like finding representatives and then partitioning the data based on conventional clustering algorithm and is computationally expensive. Other algorithms like PCTree have high space complexity as they store the details of patterns and their representations [14]. Most of correlation clustering algorithms compute the correlation between the objects and then use conventional clustering algorithms for partitioning and hence increase the time complexity [3]. Hierarchical Relationship between correlation clusters can be obtained by decomposing the data based on correlation in high dimensional space. Eigen values, PCA are used to select the centroid of the cluster and other objects belonging to the cluster [15]. ACCA (Average correlation clustering algorithm) works based on the basis of similarity of the data (gene) measured through average correlation are put into k clusters [16]. Since correlation between each pair of genes is computed the computational time is high as number of genes grows. The correlation clustering algorithms use correlation between any two data objects to find their similarity in the cluster and the partitions are formed based on high correlation between objects in the same cluster. As number of objects increases the complexity also increases, thus there are limitations on dimensions. Our proposed algorithm uses correlation between attributes rather than that between objects and therefore, can work on high dimensional data.
The proposed algorithm HCAD is a divisive hierarchical clustering algorithm. It performs decomposition of data objects based on the attribute dependencies. The attribute dependencies are measured by Spearman’s rank Correlation. It measures the strength of relationship between the two attributes. The formula for finding correlation between a pair of attributes x and y is given in (3.1).
rs
=1
-
6 ∑ D
N 3
-
N
(3.1)
Where D is the difference between the ranks of each object and r s is the rank correlation and N is the total number of objects. Correlation between every pair of attributes is calculated and represented in a matrix form
(dependency matrix). From the dependency matrix, the attributes with the highest dependency value is considered for partition. The partition is performed by finding equivalence relation between the selected attributes (splitting attribute). The selected attributes are removed from the attribute list. This process is repeated until there is no more partitioning. The results are evaluated using entropy and purity and can be computed using (3.2) and (3.3) below.
m
E ( C ) =- E P - log 2 P - , (3.2)
= 1
For m clusters pi is the probability of the data point belonging to the ith cluster. Purity of the cluster is measured by using Normalized Mutual Information (NMI) by finding the entropy H(c) and the probability of the object belonging to a class c j and fixed in the cluster ^ and is computed by (3.4)
Purity ( u, C ) = ---- (u,C) —
[ H (u ) + H ( c ) ] /2
P ( ^ n c ,)
I(u,C)=EEP(®incj)log / x z\ i J P (®-) P (с,-)
(3.3)
(3.4)
Where u = { ^ , < y 2 ,..., ^ - } is set of clusters and C = is set of classes.
-
c 1 , c 2 ,..., c j
-
3.1 Definition of Equivalence Relation
Cluster validity is also measure by chi – square, Rand Index (RI), Adjusted Rand Index (ARI) and Jaccard Index. Here, we have used RI, ARI and Jaccard measure to test the significance of the result.
A relation S on a set A is an equivalence relation if and only if it satisfies the properties of reflexive, Symmetric and transitive. Here equivalence relation for numeric data is calculated using Mahalanobis distance [17]. Mahalanobis distance for numerical and mixed data can be calculated using (3.1.1).
D 2 = ( X - M ) T C - 1 ( X - M ) (3.1.1)
where,
D - Mahalanobis distance
-
X - vector of data
M – vector of mean value of independent variables
C – inverse of covariance matrix
The equivalence relation for categorical data can be obtained by finding the objects whose values match with other tuples. The number of partitions (branches) depends on the equivalence relation. For example, in categorical data, if the splitting attribute a i has the values {high, medium, low} and a j has the value {yes, no} the number of partitions will then be 6 on the best case, by fining the set of tuples with the values in the set given below {(high, yes), (high, no), (medium, yes), (medium, no), (low, yes), (low, no)}. As decomposition is based on equivalence relation between two attributes, HCAD has higher probability of converging soon.
HCAD Algorithm (data set, no of attributes, no of tuples)
Input : Data set, number of attributes in Attribute List and number of tuples
Output : k Partitions of the data set.
-
1. Find the correlation between every pair of attributes in the attribute list A and store it in dependency matrix D
-
2. Find the maximum value in dependency D[i,j] matrix and their attributes i.e, a i and a j .
-
3. Delete the attributes a i and a j from attributes list A.
-
4. Find the equivalence class using indiscernibility relation on splitting attributes a i and a j for k partition.
-
5. Repeat the above procedure from step 1 to 4 to all k partitions
D[i,j] = correlation (ai, a j )
{A –{a i , a j } }
Partition k = EquivalenceRelation(dataset, a i , a j )
HCAD (Partition , no of attributes, no of tuples in kth partition)
Stopping criterion : repeat the procedure until there is no more attributes in the attribute list for splitting.
-
Example 3.1
We take the diabetics data set from UCI repository and its subset of tuples for empirical analysis. It consists of 10 tuples with eight attributes and one decision attribute “class”.
The steps of analysis are:
-
a. Obtain dependency Matrix using correlation coefficient.
-
b. Select the best splitting attribute, based on the maximum dependency value for portioning and is obtained by using equivalence class which is obtained through Mahalanobis distance (3.1.1).
-
c. Eliminate the splitting attribute from the attribute list From the above table the attributes (preg, age) has maximum dependency of 0.8. Therefore the above said attributes are considered as splitting attributes. The next step is to find equivalence relation between the attributes preg, age on table 3.1.1 using Mahalanobis distance.
Based on the Mahalanobis distance partitioning is carried out. Here, 10 tuples are partitioned into three clusters based on the distance values (i.e) values between 0 and 0.8 will be put into cluster1 , above 0.8 to 1.2 into cluster 2 and above 1.2 into cluster3. Hence, three clusters with tuples are Cluster 1 = {1, 4, 5, 7, 8}, Cluster 2 = {2, 3, 6} and Cluster 3 = {9, 10}. All the tuples in Cluster1 has same class label tested_positive. Similarly in tuples in cluster 3 has same class label tested_negative. Cluster 2 has different class labels and therefore need to be split into further partitions. The splitting attributes are removed from the attribute list.
Attribute List = {{preg, plas, pres, skin, insu, mass, pedi, Revised Attribute List = {plas, pres, skin, insu, mass, age} – {preg, age} } pedi}
Table 3.1.1 diabetics data set
|
S.No |
preg |
Plas |
Pres |
skin |
insu |
mass |
pedi |
age |
Class |
|
1 |
1 |
115 |
70 |
30 |
96 |
34.6 |
0.529 |
32 |
pos |
|
2 |
3 |
126 |
88 |
41 |
235 |
39.3 |
0.704 |
27 |
neg |
|
3 |
8 |
99 |
84 |
0 |
0 |
35.4 |
0.388 |
50 |
neg |
|
4 |
7 |
196 |
90 |
0 |
0 |
39.8 |
0.451 |
41 |
pos |
|
5 |
9 |
119 |
80 |
35 |
0 |
29 |
0.263 |
29 |
pos |
|
6 |
11 |
143 |
94 |
33 |
146 |
36.6 |
0.254 |
51 |
pos |
|
7 |
10 |
125 |
70 |
26 |
115 |
31.1 |
0.205 |
41 |
pos |
|
8 |
7 |
147 |
76 |
0 |
0 |
39.4 |
0.257 |
43 |
pos |
|
9 |
1 |
97 |
66 |
15 |
140 |
23.2 |
0.487 |
22 |
neg |
|
10 |
13 |
145 |
82 |
19 |
110 |
22.2 |
0.245 |
57 |
neg |
Pos – tested_positive class neg – tested_negative class
Table 3.1.2 Attribute Dependency Matrix
|
Plas |
Pres |
skin |
insu |
Mass |
pedi |
Age |
|
|
preg |
0.3526 |
0.441 |
-0.069 |
-0.253 |
-0.156 |
-0.810 |
0.8045 |
|
plas |
0.539 |
-0.284 |
-0.239 |
0.4125 |
-0.147 |
0.3670 |
|
|
pres |
0.0440 |
0.0108 |
0.4944 |
0.0404 |
0.4566 |
||
|
skil |
0.6769 |
-0.141 |
0.1896 |
-0.3561 |
|||
|
insu |
-0.140 |
0.4491 |
-0.2560 |
||||
|
mass |
0.2897 |
0.0448 |
|||||
|
pedi |
-0.602 |
Table 3.1.3 Mahalanobis distance for splitting attributes
|
S.No |
preg |
age |
Maha.Distance |
|
1 |
1 |
32 |
0.40165 |
|
2 |
3 |
27 |
1.14028 |
|
3 |
8 |
50 |
0.86292 |
|
4 |
7 |
41 |
0.02178 |
|
5 |
9 |
29 |
0.79961 |
|
6 |
11 |
51 |
1.03175 |
|
7 |
10 |
41 |
0.02178 |
|
8 |
7 |
43 |
0.10318 |
|
9 |
1 |
22 |
2.25577 |
|
10 |
13 |
57 |
2.36128 |
Table 3.1.5 Attribute dependency for cluster 2
|
pres |
skin |
insu |
Mass |
pedi |
|
|
Plas |
0.9700 |
0.8374 |
0.71260 |
0.4219 |
-0.163 |
|
Pres |
0.6795 |
0.5208 |
0.1890 |
-0.3978 |
|
|
Skin |
0.9802 |
0.8488 |
0.4027 |
||
|
Insu |
0.9367 |
0.5760 |
|||
|
Mass |
0.8257 |
Table 3.1.6 Mahalanobis distance
|
S.NO |
skin |
Insu |
Mahab.dist |
|
2 |
41 |
235 |
0.82859 |
|
3 |
0 |
0 |
1.14577 |
|
6 |
33 |
146 |
0.02564 |
We repeat the procedure in step a, b and c on cluster 2 as follows.
Table 3.1.4 Cluster 2
|
S.NO |
Plas |
pres |
skin |
insu |
mass |
Pedi |
Class |
|
2 |
126 |
88 |
41 |
235 |
39.3 |
0.704 |
neg |
|
3 |
99 |
84 |
0 |
0 |
35.4 |
0.388 |
neg |
|
6 |
143 |
94 |
33 |
146 |
36.6 |
0.254 |
pos |
The splitting attributes are (skin, insu) as it has the maximum dependency value as shown in table 3.1.5. The distance between the attributes are computed and partitioned into three clusters based on the range mentioned earlier. Cluster 1 (between 0 and 0.8) has one tuple {6} whose class label is tested_positive and cluster 2 (above 0.8 and below 1.2) has tuples {2, 3} with same class label tested_negative. Cluster 3 (above 1.2) has no tuples. The clustering is completed in two steps for 10 tuples.
Unlike other clustering algorithms HCAD does not require any prior knowledge on the number of clusters, min and max values in clusters, centroids etc., and therefore not prone to errors that are based on wrong choice of parameters. It can be applied to large volume of data sets of size in Tera bytes, since only two attributes need to be kept in memory for computation. This algorithm is quiet suitable for incremental data sets. Once the dendogram is formed, rules can be generated. It uses divide and conquer technique and hence can be implemented by parallel processing algorithms.
-
IV. I mplementation and R esults
-
4.1 ADHD Data Collection
-
4.2 Results and Discussions
The experimental results of HCAD are highly satisfactory with good computational response and cluster accuracy. We have tested and compared our algorithm with other clustering algorithms by taking various data sets of different dimensions. HCAD outperforms other clustering techniques. It is applied to a real world data set on ADHD and the details of data set are given in section 4.1. For comparative study, the zoo, soy bean (small) and diabetes data sets from UCI repository are used. The results and implications are discussed in the section 4.2.
A data set of size 150 records is collected from various schools in Vellore district of TamilNadu state of INDIA. The data include the children of age between 6 and 13 studying in classes from grade II to grade VII. Out of these data, 100 records are chosen for training and 50 records for testing. The data are of categorical type representing whether a child is having the characteristics of ADHD or not and are indicated by the values yes and no on all 13 attributes.
HCAD performs decomposition based on the dependencies of attributes. Correlation between each pair of attributes in the attribute list is computed and stored in a dependency matrix (D). Since the dependencies between any two attributes are symmetric we present the elements in the dependency matrix which are below the main diagonal only to avoid repetitions. The dependency matrix of size ( n x n )/2 is given in the figure 4.2.1 where n is the number of attributes in the attribute list.
C 5 LIOjIDXFBTBR C 3 02 2 05 06
I 04 020 3
О 0.1 009 0.401
^ 0.1 0.11 09 10.4
£ 03 08 0.4 02 0 508
JT 08 05 08 03 08 090.1
F 09 1 0.4 05 0.4 03 0.4 03
5 08 1 05 0 5 06 0 8 02 0.4 0108
7 05 08 0.4 01 03 02 08 0.4 08302
В 0.1 03 08 03 0.4 06 08 0.7 02 0805
7 04 02 0 8 09 0.7 07 OS 005 03 0.103 02
List of Attrib Tries
(with Nominal values {yes, no})
Age
Name
C - Careless Mistakes
S - Sustaining attention
L - Listening
I -FqUctvs instruction
О - Organising tasks
A - Loses attention
D - Distraction
X - Forgets activities
F - Fidgets
E - Engaging activities
T - Talks excessively
E - blurts answers
R - Interrupts
Fig. 4.2.1 Dependency Matrix and Attribute List
The maximum dependency value in the matrix is 1 and it is between the attributes (A, I) and (F, S). Either of these can be considered as splitting attribute. The partition is made on the data set based on the equivalence relation between Loses attention and Follows instruction (A, I). The pair of splitting attribute (A, I) has only two values {yes, no}, therefore we get four partitions {(yes, yes), (yes, no),(no, yes),(no, no)}. The attributes A and I are removed from the attribute list. This procedure is repeated for each of these four partitions until the attribute list is empty or no more correlation exists between the attributes. The partition tree obtained by the algorithm on ADHD data set is shown in figure 4.2.2. The result obtained through our algorithm on various data sets is given in table 4.2.1 (see Appendix - I).
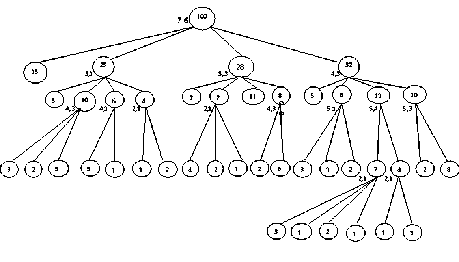
Fig. 4.2.2 Hierarchical Cluster formed by HCAD on ADHD data set
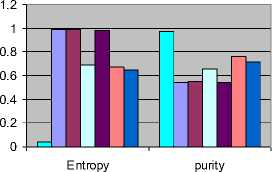
Our algorithm gives the best results on applying to various data sets. It gives 100% purity on Zoo and soybean (small) dataset, 97% purity on ADHD dataset, 98% purity on diabetes data set and with the maximum computational time of 0.2 seconds on zoo data set. A comparative study on performance analysis was carried out with respect to various clustering algorithms. The experimental results on ADHD data set are tabulated in 4.2.2. HCAD outperforms other clustering algorithms on all the above mentioned data sets. However, the response time is comparatively slightly higher but still much less than EM algorithm. We have used two measures, entropy and purity for evaluating the cluster validity. Figure 4.2.3 gives the comparative study on entropy and purity against algorithms like K means, Hierarchical clustering using single link, make density, filtered clustering, farthest clustering and Expected Maximization (EM) algorithms on ADHD data sets.
Table 4.2.2 Performance Analysis of clustering algorithms on ADHD Data set
|
Algorithms |
Time |
Entropy |
Purity |
|
HCAD |
0.172 sec |
0.04 |
0.97 |
|
K means |
0.03 sec |
0.99 |
0.54 |
|
Hierarchical clustering |
0.08 sec |
0.99 |
0.55 |
|
Make Density |
0.03 sec |
0.69 |
0.66 |
|
Filtered clustering |
0.05 sec |
0.98 |
0.54 |
|
Farthest first |
0.0001 sec |
0.67 |
0.76 |
|
EM |
5.05 |
0.65 |
0.71 |
Cluster Analysis for ADHD data set
□ HCBAD
□ K means
□ Hierarchical clustering
□ Make Density
■ Filtered clustering о Farthest first
□ EM measures
Fig. 4.2.3 Cluster analysis of various algorithms on ADHD data set.
The table 4.2.2 reveals that the existing algorithms have higher entropy than HCAD and the cluster validity of HCAD is superior to other algorithms with a value of 0.97. The computation time and purity are always a tradeoff. Any algorithm should compromise one to get the other. Computational time of HCAD is slightly higher than other algorithms but much lower than EM.
Different dimensional data set summarized in table 4.2.1 (see Appendix - I) is considered for performance analysis. The results obtained for entropy and purity are tabulated in 4.2.3 (see Appendix - I). These results reveal that HCAD performs on higher dimension data also with better cluster purity. HCAD has been applied to 1473 instance on CMC data set and Libra-movement data set with 90 attributes and has 15 class labels. HCAD could produce fine partitions on any data set but has to compromise on computational time.
The cluster validity is measured by various indices like RI, ARI, Jaccard and Chi-square test. Here, we present the comparative analysis of HCAD with other algorithms on these indices and shown as a graph in the figure 4.2.4, 4.2.5 and 4.2.6. Rand Index value is influenced by the number of clusters and ARI index overcomes the pitfall. This index takes the value from 0 to 1. Higher index value indicates better formation of clusters and lower values indicate poor clustering.
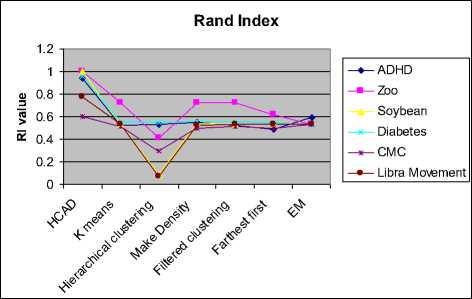
Fig. 4.2.4 Comparison of cluster validity using Rand Index
EM algorithm performs reasonably well with accuracy above 70%, but the computational time is much higher compared to other algorithms. The algorithms like K-means, Hierarchical clustering, filtered and farthest first clustering executes in a few milliseconds but, the clustering accuracy is very low. HCAD has the RI value above 0.6 irrespective of data dimensions. Similarly, EM algorithm is consistent in clustering and its RI value is nearly 0.6. Adjusted Rand Index in figure 4.2.5 shows that HCAD clusters are superior to that of other algorithms on all data sets. All the above seven algorithms perform well on zoo data set having better purity compared to other data sets.
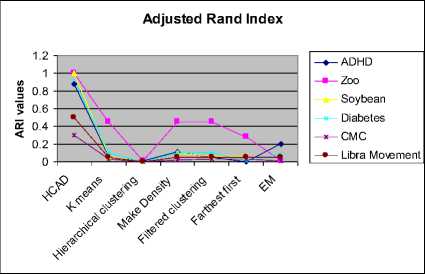
Fig. 4.2.5 Comparison of cluster validity using Adjusted Rand Index
Jaccard coefficient gives the asymmetric binary similarity between objects and is very popular in literature for finding the cluster validity. Here, the validity of the partitions formed by the algorithms is measured using this coefficient and represented graphically in figure 4.2.6. The graph clearly states that HCAD and EM perform good clustering as their coefficient values are high.
Jaccard Index
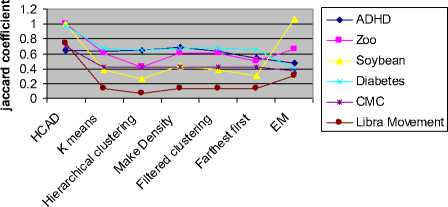
Fig. 4.2.6 Comparison of cluster validly using Jaccard
The comparison graphs and the tabulated results clearly show that HCAD out performs other algorithms. On zoo data set, HCAD is the only algorithm that gives a purity value of 1 where as other algorithms have lesser purity value as low as 0.40. EM gives the purity 1 on soy bean data set which is equal to HCAD. But, its computational time is much higher than HCAD and is above 5 seconds, where our algorithm could get executed in 0.074 seconds. Entropy analysis reveals that, HCAD has least entropy for ADHD and has no entropy for Zoo and Soy bean data sets. On diabetes data set HCAD gives highest purity of 0.98 where as EM purity is close by 0.85. On Libra movement data set of 90 attributes with 15 labels and CMC dataset of 1473 instances, HCAD could produce the better purity of 0.84 and 0.76 respectively. Once a partition tree is formed by splitting attributes, classification rules can be generated from the hierarchical tree cluster and hence can be applied to new instances for ADHD diagnosis. These rules can be used by the teachers to get conclusions on the level of ADHD in their students.
-
V. C onclusion and F uture W ork
In this paper, we proposed a new algorithm (HCAD), for which the experimental results based on attribute dependency outperforms the other algorithms. To the best of our knowledge, this is the first clustering algorithm which applied for ADHD decision making. The results are satisfactory and can be applied by teachers as the screening test to identify the nature of the students in their classes. The HCAD algorithm provides better response time and computation results compared to other clustering techniques like centroid method and Density methods. The dendogram tree levels formed by this method are small and therefore produce quick results. This algorithm has no constraint on cluster sizes so that it creates clusters of arbitrary sizes. It does not require any predetermined values like centroid, number of clusters etc. Incorrect choice of these parameters may lead to poor cluster accuracy. As HCAD does not require any such parameters the risk of getting incorrect decision is avoided. This algorithm can be further extended to handle data sets with multiple decision classes, similar to ADHD dataset and Learning Disability (LD) dataset, where each category of ADHD and LD influences the other types.
-
[1] Poushaneh K, Bonab B.G. and Namin F.H., Effect of training impulse control on increase attention of children with attention-deficit/hyperactivity disorder, Ptocedia Social and Behavioral Science, vol. 5, 2010, pp 983 - 987.
-
[2] Tan T.S, Cheung W.S, Effects of computer collaborative group work on peer acceptance of a junior pupil with Attention Deficit Hyperactive Disorder, Computer and Education, 2008, vol.50, pp 725 – 741.
-
[3] Seal S, Komarina S and Aluru S, An optimal hierarchical clustering algorithm for gene expression data, Information Processing Letters, vol. 93, 2005, pp 143-147.
-
[4] Grub, M. and Laryn, L.: Behavioral Characteristics of DSM-IV ADHD subtypes in a school – Based population, Journal of abnormal child Psychology, vol. 25, No. 2, 1997, pp 103 – 111.
-
[5] Lopez V, Lopez-Alderon J, Ortega R, Kreither R, Carrasco X, Rothhammer P, Rothhammer F, Rosas R and Aboitiz F, Attention-deficit hyperactive disorder involves
differerential cortical processing in a visual spatial attention paradigm, Clinical Neurophysiology, vol. 117, 2006, pp 2540 - 2548.
-
[6] Han J., Kamber, M. and Pei J: Data Mining: Concepts and Techniques, 3rd Edition, Morgan Kaufmann Publishers, 2012.
-
[7] Yu L, Gao L, Li K, Zhao Y and Chiu D.K.Y, A degreedistribution based hierarchical agglomerative clustering algorithm for protein complexes identification, Computational Biology and Chemistry, vol. 35, 2011, pp 298 - 307.
-
[8] Lee John W.T, Yeung D.S, Tasng E.C.C: Hierarchical clustering based on ordinal consistency, Pattern Recognition, vol. 38, 2005, pp 1913-1925.
-
[9] Wu J, Xiong H and Chen J, Towards understanding hierarchical clustering: A data distribution perspective, Neuro Computing, vol. 72, 2009, pp 2319 - 2330.
-
[10] Vijaya P.A, Narasimha Murty and Subramanian, Leaders-Subleaders: An efficient hierarchical clustering algorithm for large data sets, Pattern Recognition Letters, vol. 25, 2004, pp 505-513.
-
[11] Qiao S, Li Q, Li H, Peng J and Chen H, A new block modeling based hierarchical clustering algorithm for web social networks, Engineering Applications of Artificial Intelligence, vol. 25, 2012, pp 640 - 647.
-
[12] Tu Q, Lu J.F, Yuan B, Tang J.B and Yang J.Y, Density based Hierarchical Clustering for streaming data, Pattern Recognition Letters, vol. 33, 2012, pp 641 - 645.
-
[13] Vijaya P.A, Narasimha Murty and Subramanian D.K, Efficient bottom-up hybrid hierarchical clustering techniques for protein sequence classification, Pattern Recognition, vol. 39, 2006, pp 2344 - 2355.
-
[14] Ananthanarayana V.S., Narasimha Murty and M., Subramanian, D.K.: Efficient clustering of large data sets, Pattern Recognition, vol.34, 2001, pp 2561-2563.
-
[15] Zimek A, Thesis on Correlation clustering, University of Munchen, 2008.
-
[16] Bhattacharya A and De, Rajat K.: Average correlation clustering algorithm (ACCA) for grouping co-regulated genes with similar pattern of variation in their expression values, Journal of Biomedical Informatics, vol.43, 2010, pp560-568.
-
[17] Shji Hirano, Tsumoto S, Okuzari T, Hata Y, Clustering based on Rough set and Applications to knowledge
Discovery in Medical Diagnosis, MEDINFO, 2001, pp 206-210.
-
A. Eiflier 1 or 2
(l)six(or mote) of the following symptoms of inattention have persisted for at least 6 months to a degree that is maladaptive and incons ktent with developmental level:
Inattention:
-
a) Often fails to give close attention to details or makes careless mistakes in schoolwork, work or other activities.
-
b) Often has difficulty sustaining attention in tas ks or play activities.
-
c) Often does not seem to listen when spoken to directly.
-
d) Often does not fallow instructions and fails to finish schoolwork, chores or duties in the workplace(not due to oppositional behavior or failure to understand instructions).
-
e) Often has difficulty organizing tasks and activities.
-
f) Often avoids, dislikes or is reluctant to engage in tasks that require sustained mental effort(such as schoolwork or homework)
-
g) Often loses things necessary for tasks or activities (eg. toys, school assignments, pencils, bocks or took)
-
h) Is often easily distracted by extraneous stimuli).
-
i) Is often forgetful in daily activities.
-
(2) Six (or mote) of the following symptoms of hyperactivity- impukivity have persisted for at least 6 months to a degree that к maladaptive and incons istent with developmental level:
Hyperactivity
-
a) .Often fidgets with hands or feet or squirms in seat.
-
b) .Often leaves seat in class room or in other situations in which remaining seated is expected.
-
c) .Often runs or climbs excessively in situations in which it is inappropriate (in adolescents or adults, maybe limited to subjective feelings of restlessness).
d)ls often‘bn the go” or often acts as if “driven by a motor7’.
-
f) .Often talks excessively.
Impukivity
-
g) .Оftenblurts answers before questions have been completed.
-
h) Often has difficulty awaiting turns.
-
i) Often interrupts or intrudes on others (e.g. butts into conversations or games).
B. Some hyperactive-impulsive or inattentive symptoms that caused impairment were present before 7 years of age. C Some impairment from the symptoms is present in2 or more settings (eg. at school [or work] or at home).
IX There must be clear evidence of clinically significant impairment in social, academic or occupational functioning. E. The symptoms do not occur exclusively during the course of a pervasive development disorder, schizophrenia or other psychotic disorder and are not better accounted for by another mental dkorder (eg. mood disorder, anxiety dkorder, dissociative dkorder or personality disorder).
Fig. 1.1 DSM-IV diagnostic criteria for ADHD
Table 4.2.1 Result Analysis of HCAD
|
Data Set |
Instance |
Attributes |
Values |
Level |
Time |
Accuracy |
|
ADHD |
101 |
13 |
Bivariate |
4 |
172 ms |
97% |
|
Zoo |
101 |
15 |
Multivariate |
4 |
218 ms |
100% |
|
Soy bean small |
47 |
36 |
multivariate |
3 |
074ms |
100% |
|
Pima_Diabetes |
768 |
9 |
multivariate |
3 |
085ms |
98% |
|
Cancer |
700 |
9 |
multivariate |
3 |
094ms |
99% |
|
CMC |
1474 |
9 |
multivariate |
4 |
1500ms |
80% |
|
Libra movement |
361 |
90 |
multivariate |
4 |
1560ms |
84% |
Table 4.2.3 Performance Analysis of clustering algorithms on various Data set
|
Algorithm |
ADHD |
Zoo |
Soybean |
CMC |
Libra-movement |
Diabetes |
|
|
HCAD |
Time |
0.172 |
0.312 |
0.0714 |
1.5 |
1.9 |
0.212 |
|
Entropy |
0.04 |
0 |
0 |
0.498 |
0.352 |
0.02 |
|
|
Purity |
0.97 |
1 |
1 |
0.76 |
0.84 |
0.98 |
|
|
K means |
Time |
0.03 |
0.02 |
0.0001 |
0.39 |
0.61 |
0.06 |
|
Entropy |
0.99 |
0.41 |
1.25 |
1.49 |
1.66 |
0.98 |
|
|
Purity |
0.54 |
0.59 |
0.57 |
0.41 |
0.13 |
0.52 |
|
|
Hierarchical clustering |
Time |
0.08 |
0.13 |
0.03 |
16.13 |
0.81 |
4.47 |
|
Entropy |
0.99 |
2.60 |
0.98 |
1.54 |
3.9 |
0.76 |
|
|
Purity |
0.55 |
0.40 |
0.57 |
0.57 |
0.07 |
0.61 |
|
|
Make Density |
Time |
0.03 |
0.02 |
0.02 |
0.22 |
0.59 |
0.08 |
|
Entropy |
0.69 |
1.56 |
1.13 |
1.49 |
1.67 |
1.24 |
|
|
Purity |
0.66 |
0.53 |
0.57 |
0.42 |
0.13 |
0.59 |
|
|
Filtered clustering |
Time |
0.05 |
0.02 |
0.0001 |
0.27 |
0.8 |
0.06 |
|
Entropy |
0.98 |
2.03 |
1.24 |
1.49 |
1.66 |
0.89 |
|
|
Purity |
0.54 |
0.40 |
0.57 |
0.41 |
0.13 |
0.57 |
|
|
Farthest first |
Time |
0.02 |
0.02 |
0.001 |
0.03 |
0.11 |
0.02 |
|
Entropy |
2.69 |
2.69 |
1.26 |
1.51 |
1.9 |
1.5 |
|
|
Purity |
0.43 |
0.43 |
0.49 |
0.42 |
0.13 |
0.48 |
|
|
EM |
Time |
5.05 |
5.67 |
4.08 |
149.17 |
1417.3 |
264.11 |
|
Entropy |
0.65 |
0.317 |
0 |
1.38 |
1.26 |
0.04 |
|
|
Purity |
0.71 |
0.80 |
1.0 |
0.37 |
0.46 |
0.85 |
References Hierarchical Clustering Algorithm based on Attribute Dependency for Attention Deficit Hyperactive Disorder
- Poushaneh K, Bonab B.G. and Namin F.H., Effect of training impulse control on increase attention of children with attention-deficit/hyperactivity disorder, Ptocedia Social and Behavioral Science, vol. 5, 2010, pp 983 - 987.
- Tan T.S, Cheung W.S, Effects of computer collaborative group work on peer acceptance of a junior pupil with Attention Deficit Hyperactive Disorder, Computer and Education, 2008, vol.50, pp 725 – 741.
- Seal S, Komarina S and Aluru S, An optimal hierarchical clustering algorithm for gene expression data, Information Processing Letters, vol. 93, 2005, pp 143-147.
- Grub, M. and Laryn, L.: Behavioral Characteristics of DSM-IV ADHD subtypes in a school – Based population, Journal of abnormal child Psychology, vol. 25, No. 2, 1997, pp 103 – 111.
- Lopez V, Lopez-Alderon J, Ortega R, Kreither R, Carrasco X, Rothhammer P, Rothhammer F, Rosas R and Aboitiz F, Attention-deficit hyperactive disorder involves differerential cortical processing in a visual spatial attention paradigm, Clinical Neurophysiology, vol. 117, 2006, pp 2540 - 2548.
- Han J., Kamber, M. and Pei J: Data Mining: Concepts and Techniques, 3rd Edition, Morgan Kaufmann Publishers, 2012.
- Yu L, Gao L, Li K, Zhao Y and Chiu D.K.Y, A degree-distribution based hierarchical agglomerative clustering algorithm for protein complexes identification, Computational Biology and Chemistry, vol. 35, 2011, pp 298 - 307.
- Lee John W.T, Yeung D.S, Tasng E.C.C: Hierarchical clustering based on ordinal consistency, Pattern Recognition, vol. 38, 2005, pp 1913-1925.
- Wu J, Xiong H and Chen J, Towards understanding hierarchical clustering: A data distribution perspective, Neuro Computing, vol. 72, 2009, pp 2319 - 2330.
- Vijaya P.A, Narasimha Murty and Subramanian, Leaders-Subleaders: An efficient hierarchical clustering algorithm for large data sets, Pattern Recognition Letters, vol. 25, 2004, pp 505-513.
- Qiao S, Li Q, Li H, Peng J and Chen H, A new block modeling based hierarchical clustering algorithm for web social networks, Engineering Applications of Artificial Intelligence, vol. 25, 2012, pp 640 - 647.
- Tu Q, Lu J.F, Yuan B, Tang J.B and Yang J.Y, Density based Hierarchical Clustering for streaming data, Pattern Recognition Letters, vol. 33, 2012, pp 641 - 645.
- Vijaya P.A, Narasimha Murty and Subramanian D.K, Efficient bottom-up hybrid hierarchical clustering techniques for protein sequence classification, Pattern Recognition, vol. 39, 2006, pp 2344 - 2355.
- Ananthanarayana V.S., Narasimha Murty and M., Subramanian, D.K.: Efficient clustering of large data sets, Pattern Recognition, vol.34, 2001, pp 2561-2563.
- Zimek A, Thesis on Correlation clustering, University of Munchen, 2008.
- Bhattacharya A and De, Rajat K.: Average correlation clustering algorithm (ACCA) for grouping co-regulated genes with similar pattern of variation in their expression values, Journal of Biomedical Informatics, vol.43, 2010, pp560-568.
- Shji Hirano, Tsumoto S, Okuzari T, Hata Y, Clustering based on Rough set and Applications to knowledge Discovery in Medical Diagnosis, MEDINFO, 2001, pp 206-210.
