Human Action Recognition Based on The Skeletal Pairwise Dissimilarity

Author: Surkov E.E., Seredin O.S., Kopylov A.V.
Journal: Компьютерная оптика @computer-optics
Section: Численные методы и анализ данных
Article in issue: 3 т.49, 2025.
Free access
The main idea of the paper is to apply the principles of featureless pattern recognition to human activity recognition problem. The article presents the human figure representing approach based on pairwise dissimilarity function of skeletal models and a set of reference objects, also known as a basic assembly. The paper includes a basic assembly analysis and we propose the method for selecting the least-correlated basic objects. The video sequence proposed for analysis of human activity within frames is represented as an activity map. The activity map is a result of computing the pairwise dissimilarity function between skeletal models from the video sequence and the basic assembly of skeletons. The paper conducts frame-by-frame annotation of activities in the TST Fall Detection v2 database, such as standing, sitting, lying, walking, falling, post-fall lying, grasp, ungrasp. A convolutional neural network based on the ResNetV2 with the SE-block is proposed to solve the activity recognition problem. SE-block allows to detect inter-channel dependencies and selecting the most important features. Additionally, we prepare a data for training, determine an optimal hyperparameters of the neural network model. Experimental results of human activity recognition on the TST Fall Detection v2 database using the Leave-one-person-out procedure are provided. Furthermore, the paper presents a frame-by-frame assessment of the quality of human activity recognition, achieving an accuracy exceeding 83%.
Basic assembly, pairwise dissimilarity measure, activity map, human action recognition, CNN, inner-channel attention
Short address: https://sciup.org/140310491
IDR: 140310491 | DOI: 10.18287/2412-6179-CO-1522
Text of the scientific article Human Action Recognition Based on The Skeletal Pairwise Dissimilarity
Interest in training systems for human activity recognition (HAR) and understanding of human behaviour is increasing with the growth of computational power, advancements in neural network technologies, and training datasets. Human activity recognition in videos involves solving several issues, such as detection and segmentation of the human figure in the image, representing it in certain space, and applying machine learning methods and algorithms for activity classification. This article considers an activity classification method of human representing based on the skeletal models of his figure.
The skeletal model of human figure [1 –5] is a graph (Fig. 1). This graph is formed by the spatial coordinates of vertices which represent the position of joints (points or nodes of skeleton). The edges which correspond to human anatomy connects these vertices. That representation of human figure is simplified in opposite of work [6] where geometrically and anthropologically correct skeletal model was described. However this simplified representation of human figure is widely applicable in fields related to computer vision. This skeleton could be obtained directly by Microsoft Kinect (3D skeletal model), Asus Xtion and Intel RealSense (2D skeletal model extended to 3D by 3D point cloud). Nowadays advanced neural networks could also generate a 2D skeletal model from RGB image.
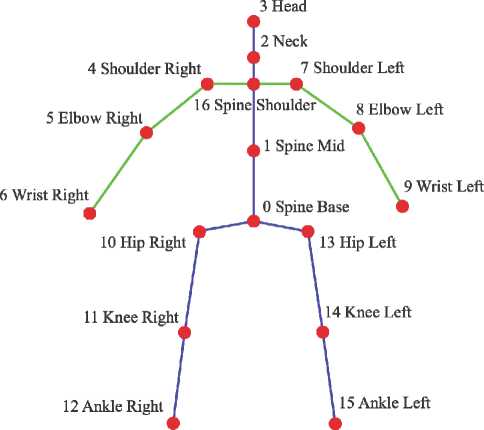
Fig. 1. The skeletal model of the human figure. Auxiliary distances for height estimation are highlighted in blue
The use of skeletal models to represent individuals has become somewhat standard for human activity recognition problems. There is plenty of recent research in HAR using various modern neural network architectures based on skeletal description. In work [7] Convolutional Neural Networks (CNN) are used to extract features from the skeletal data presented as coordinates, time-domain and space-domain differential information and SVM is used to classify actions. The authors of paper [8] implement different augmentation methods and provide experiments with CNN supplemented by Long-Short-Term-Memory. It allows them to obtain a more robust and accurate model in HAR issue.
There are also a lot of research which treat the skeletal data as a graph and suggest implementation of Graph Convolutional Networks [9– 12]. For instance, Kairen Chen et. all in [12] observe different neural network architectures and show desirable results obtained by skeleton-based methods. Xie, J. et all [9] divides a skeleton into segments and then forms an adjacency matrix to train a Dynamic-Semantic GCN. Mayank Lovanshi and Vivek Tiwari [11] describes a custom Spatial-Temporal GCN architecture applied to skeletal models and declares that outperforms the state-of-the-art (SOTA) on the most popular datasets such as NTU-RGB-D, Kinetics-Skeleton and Florence 3D. The autoencoder based on a GCN architecture was proposed in [10]. This architecture of neural network allows encoding the adjacency matrix formed by skeleton models into a latent space, then decoding it and classifying via a fully-connected layer. According this paper their approach outperformed most of the existing SOTA on the NTU-RGB+D datasets as well.
Recently, works based on transformer architecture have been gaining popularity and successfully surpass GCN, CNN, RNN based neural networks. The latest works in HAR using transformer architecture and utilizing temporal, spatial features or their combination are also based on the skeletal human description [13– 17]. Papers [13, 14, 15] even provide the results better than GCN obtained. For example, the Visual Transformer (ViT) trained on HAR issues [17] claimed that they outperformed previous results by 10% and besides that the model exhibits fast training speed and requires fewer calculation parameters. Thus, evolution of NN and works in HAR described above allows us to assert that the skeletal description is up-to-date a relevant and promising option for a human representation.
Indeed, there are numerous methods available for representing the human body based on skeletal models [3, 18–21]. These methods are categorised into two main groups: those that represent skeletal models in feature space (3D coordinates) and those that represent skeletal models based on the dissimilarity measure between two objects [20, 23–25], following the principles of featureless pattern recognition. Specifically, the study [22] proposes methods for representing the human body in a secondary feature space. Utilizing a pairwise comparison function of skeletal models instead of the skeletal models themselves offers the advantage of concealing the coordinate representation of skeleton nodes from external observers. Consequently, this approach enhances client confidentiality and mitigates apprehensions related to personal privacy. The security of such systems is a critical metric, given the extensive search in the field of action recognition problem [26–
-
28] . We aim to demonstrate that our skeletal representation is more secure compared to the skeletal model representation in the feature space.
In [22], a fall detection method based on a basic assembly of skeletal models using a featureless pattern recognition approach is outlined. Additionally, the basic assembly and pairwise dissimilarity function are introduced. This is allow to compare the skeletal model of a video frame with each skeletal model in the basic assembly and compute a vector of values. These vectors, obtained throughout the entire video sequence form an activity map. As the objects in the basic assembly belong to a metric space, and the structure of the activity map relies on the order of objects in the basic assembly, it is proposed to order a basic assembly using the shortest unclosed path search method between objects[29, 31]. The size of the activity map is determined by the number of objects in the basic assembly and the size of the sliding window [22]. This activity map can be interpreted as a grayscale image, with white denoting the highest distance value between objects and black the lowest (Fig. 2). This resulting image can be used to train convolutional neural networks. Training and testing of the ResNet50V2 convolutional neural network [31] are conducted on the TST Fall Detection v2 database [33]. The quality assessment of fall detection is computed for each actor separately using the leave-one-person-out method [1, 2], also named as leave-one-subject-out procedure in [33]. The averaged accuracy, defined as the ratio of correctly classified video sequences to the total number of video sequences in the database, is determined as 0.954.
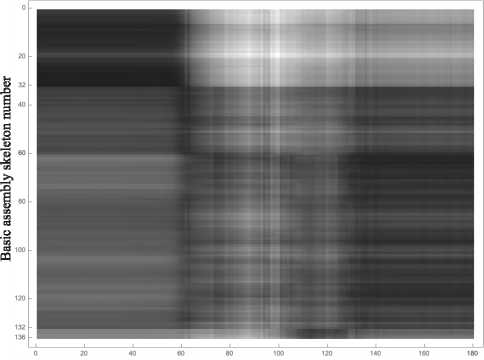
Frame number of the video sequence
Fig. 2. An activity map example computed for a video sequence from the TST Fall Detection v2 database
The high-quality performance of fall detection based on the basic assembly and human activity map encourages the application of such a method to address a more general problem - human activity recognition. In this work we propose a not described before frame-by-frame annotation of the TST Fall Detection v2 database. Moreover, a procedure for downsizing a basic assembly is proposed to exclude redundant objects. Recognizing an activity maps we suggest application of the convolutional neural network architecture with squeeze-and-excitations block and provide a neural network hyperparameters tuning.
The pairwise dissimilarity function between two skeletal models
The featureless approach involves selecting a set of reference objects (a basic assembly of skeletal models) [22, 24] and defining a set of secondary features for any object as its pairwise comparisons with objects from the basic assembly. We propose the real valued function of two arguments that defines this distance to measure the dissimilarity between two skeletal models.
The following factors should be considered for an accurate computation of the distance between two skeletal models:
-
• Different people have varying heights. For a correct comparison of two skeletal models for activity analysis using any dissimilarity measure, it is necessary to exclude the influence of anthropometric features of a person on the general lengths of segments forming the skeleton.
-
• When a person moves in the scene, the skeletal model shifts relative to the camera position (origin of coordinates), and skeletal joints constructed by RGB-D camera have coordinates relative to the room space. However, when comparing two skeletal models, the positioning of these models only relative to each other is of interest. Consequently, when conducting skeletal model comparisons, it becomes imperative to discount any displacement relative to the camera position.
Human heights estimation
When determining the distance between skeletal models, it is necessary to take into account the variation in people’s heights; therefore, it is necessary to normalize the skeletal model by dividing the coordinates of all skeletal model points by the height. In [22], for height estimation, the average geodesic distance between points 3 and 12 and between points 3 and 15 of the skeletal model is proposed, as demonstrated in Fig. 1. Additionally, to refine the height estimation, we proposed to compute the mean among ten peak values, which were obtained after a time of the person being in the sensor’s field of view.
Utilizing geodesic distances between points to compute height estimation is depicted on the histogram by an asymmetric unimodal distribution (Fig. 3). The actor’s height in the video sequence is measured as 170 cm.
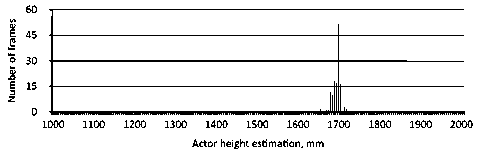
Fig. 3. Bar chart of height estimation per frame for the actor in the video with sitting and standing activities
Distance between two skeletal models
When comparing skeletal models in threedimensional space, it is necessary to account the displacement between them [22]. To eliminate the vertical misalignment of the skeletal models as depicted on Fig. 4 a , b we propose to determine the skeletal joint with the smallest ordinate (Y) and subtract the smallest ordinate (Y) from each skeletal joint.
Furthermore, it is necessary to move the skeletal models to the origin along the X and Z axes and align them at the skeleton joint 0 (SpineBase) (Fig. 4 c , d ).
After eliminating the displacement of skeletal models in the camera space, a measure of dissimilarity between skeletal models is computed. The measure of dissimilarity considers the average Euclidean distance between all corresponding points of two skeletons.
The distance between pairs of skeletons P and Q could be determined by the equation 7 in paper [22]:
N - 1
R ( R , Q )= 1 ∑∑ ( p k m - q k m )2, (1)
N k=0 m∈{x, y,z} where N – number of used joints of skeleton, pk – k-th joint of skeletal model P, qk – k-th joint of skeletal model Q.
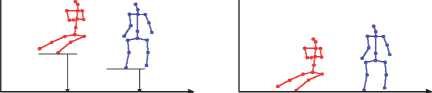
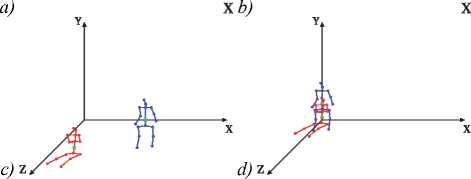
Fig. 4. The elimination of the vertical offset (a, b) and combining of the skeletal models along X and Z coordinates in SpineBase joint (c, d)
TST Fall Detection v2 database
The TST Fall Detection v2 [32] dataset was chosen as the database for train and inference of the activity recognition algorithm. The database contains 264 video recorded by Microsoft Kinect v2 of various activities performed by 11 actors. The dataset includes activities of daily living (ADL) of the following categories: sitting, grasp and picking up objects, walking, lying down, and activities related to falls (FALL): falling forward, falling backward, falling sideways, falling backward and remaining seated. The shortest recording lasts 2.5 seconds (75 frames), while the longest lasts 15.4 seconds (463 frames). The database includes depth maps, skeletal models, and data from two accelerometer sensors.
Basic assembly of skeletal models analysis
In [22], a set of N = 136 skeletal models recorded during laboratory experiments is proposed as the basis assembly. The objects are empirically selected. The basic assembly skeletons (basis skeletons) corresponds to different human poses: standing (32 frames); sit on the chair (28 frames); sit on the floor (72 frames); lying down(4 frames).
This work proposes an extension of the basic assembly by including an additional 26 objects representing various classes sourced from the TST Fall Detection v2 database. The extension aims to enrich the basic assembly with skeletal models depicted the "lying down" activity, enhance the diversity of "standing" variations, and introduce new skeletal models representing the "grasp" class. Consequently, the total number of objects in the basic assembly expands to N = 162 and distribution of skeleton activity was changed as: standing (41 frames); sit on the chair (28 frames); sit on the floor (72 frames); lying down(11 frames); grasp (10 frames).
To assess the informativeness of representing an arbitrary skeletal model relative to the basic assembly, we propose examining the correlation map between basis objects(Fig. 5). A correlation map is a visualized correlation matrix where white indicates a high correlation between features, while black suggests no correlation between features.

К 60
; ио m 140 ■__________—____ _
160-1--------JM—
0 50 100150
Basic assembly object number
Fig. 5. The correlation map of the basic assembly skeletal models
To construct the correlation map S(N×N) (Fig. 5), each basis skeleton is represented by vector a. The vector a contains the values of pairwise dissimilarity with skeletal models from all stacked video sequences of the TST Fall Detection v2 database. The N vectors a form the object-feature matrix A, where the object represents a frame, and the feature represents the distance value between the skeletal model in the frame and the basis object. For such a matrix A, we obtain the correlation matrix between the features:
S ( N X N ) = a T a j , (2)
where i , j = 1,…, N .
The selecting of the basic assembly
The correlation map reveals that many objects in the basic assembly are significantly correlated with each other. Thus the basic assembly is redundant. We propose reducing the basic assembly to exclude the most highly correlated objects. The similar issue was described in [24]. According to the keras recommendation we determine the number of objects, denoted as M , by the minimum acceptable image size required as input for the convolutional neural networks [35] and reduce the basic assembly size to M =32.
To select the least correlated skeletal model reference objects, it is proposed to find a submatrix S *( M × M ) in the correlation matrix (2), provide at least two objects of each class remaining and satisfy the condition:
M < N
S * ( M x M ) = min £ S i , j , (3)
where i , j = 1,…, M , j > i .
The optimal solution for problem (3) is to exhaustively search all possible submatrices S *. However, the number of such submatrices is equivalent to the number of combinations of M from N , which is Ci62 = 7.227 ■ 1033. The computational complexity of this problem does not allow to solve it directly. The function for computing combinations follows a normal distribution pattern, with its value decreasing as the argument deviates from the mean (Table 1).
Based on this observation, a greedy search procedure for looking for the submatrix S * is proposed, namely, gradually excluding two objects from the basic assembly by brute-force of all C UT - 2 subsets of basis objects in such a way that condition (3) is satisfied for them. As a result of performing this procedure, the normalized sum of elements above the main diagonal of the matrix S * decreases with each step of the procedure (Fig. 6). The time spent on executing the procedure for selecting basis objects is 2-3 minutes (Intel Core i7 12th).
Tab. 1. Dependency of the number of combinations from 162 objects by M
|
M |
32 |
48 |
64 |
80 |
96 |
112 |
128 |
144 |
160 |
|
M C 162 |
7.22-1033 |
3.89-1046 |
1.03-1047 |
3.61-1047 |
2.28-1046 |
2.05-1042 |
1.08-1035 |
3.46-1023 |
1.3-104 |
As a result of applying the selection procedure, M =32 objects remained in the basic assembly, which are minimally correlated with each other. Fig. 7 demonstrates the correlation map between the selected objects of the basic assembly. A comparison of the correlation maps in Fig. 5 and 7 shows that the basic assembly selection is necessary to eliminate redundant objects which are not contribute useful information to the activity map.
The structure of the activity map image depends on the arrangement of rows, namely, the order in which the skeletal models in the basic assembly are presented. Since each row represents a vector of distances to other objects from the basis skeletal model, we can put forward the following hypothesis: If each element of the basic assembly is an element of the metric space, then the shortest unclosed path will arrange the elements in such an order that the transition between the boundaries of neighbouring elements of the basic assembly going to be more seamless, the boundaries between individual activities going to be more evident and recognizable, and the image going to be smoother and more representative.
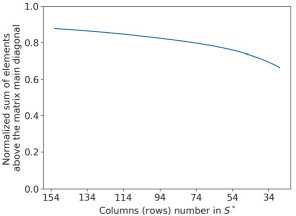
Fig. 6. The dependency of the normalized sum of elements above the main diagonal of the correlation matrix on the basic assembly objects number
The ordering of the basic assembly
Thus, in the work [22], it is proposed to find the shortest unclosed path (SUP) between the objects of the basic assembly using the SUP search algorithm [29, 30]. Then, the objects of the basic assembly are ordered according to the solution of the SUP search algorithm. Using this approach, the following order of the basic assembly was obtained: 6 "lying" objects, 7 "standing" objects, 6 "sitting" objects, 8 "grasp" objects, and 6 "lying" objects.
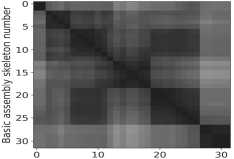
A visualization example of the distance matrix between elements of the basic assembly with and without ordering is presented in Fig. 8. The visualization demonstrates that the order of the basic assembly indeed affects the representativeness of the activity map and confirms the idea of the proximity of skeletal models from same class.
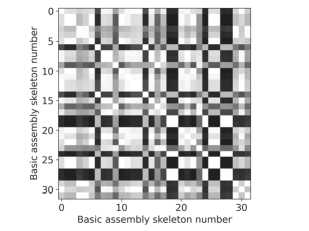
Fig. 7. Correlation map of the selected basic assembly skeletal models
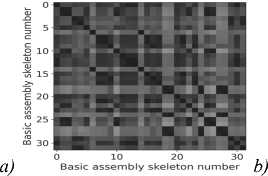
Fig. 8. Distance matrix visualization between basic assembly objects
Basic assembly skeleton number
TST fall detection v2 annotation for the human action recognition
In the TST Fall Detection database, each video is labeled with a class tag: sit, grasp, walk, lying, fall-back, fall-front, fall-sit, fall-side. However, each video sequence contains not just one class of human activity, but several. For example, a video sequence labeled "grasp" also contains activities such as "staying" and "walking" . Therefore, we propose a previously undescribed frame-by-frame annotation of the TST Fall Detection v2 database which was executed by three independent experts. Twelve activities performed by actors in the video sequences of the database are chosen as class labels: walking, standing, sitting, lying, grasp, ungrasp, post-fall-lying, falling, stand-to-sit, sit-to-stand, sit-to-lay, lay-to-sit.
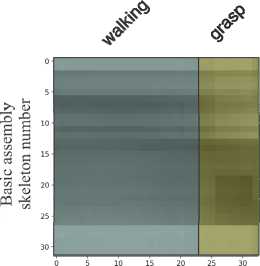
The completed frame-by-frame annotation easily transfers to the activity map. An example of a labeled video sequence containing examples of human activities such as "standing" , "walking" , "grasp" is presented in Fig. 9.
The following activities were identified in the video sequence: standing: frames 1 to 34 and 122 to 135;
walking: frames 35 to 74; grasp: frames 75 to 106; ungrasp: frames 107 to 121.
In this work, we limit ourselves to nine activities from the TST Fall Detection v2 database: walking, standing, sitting, lying, grasp, ungrasp, post-fall-lying, falling, and assign the label "no_class" to frames that do not fit into this classification.
Convolutional neural network with squeeze-and-excitation
Representing the sequence of skeletal models as an activity map (Fig. 9) allows the application of convolutional neural networks to the task at hand. These networks have been actively and successfully applied to a wide range of image-related tasks in recent years. Thus, the task of frame-by-frame activity classification in video sequences is reduced to recognizing images of activity maps.
The common practice requires square images as input to convolutional neural network and all images have to be of a strictly defined size, it is proposed to perform sliding window over the activity map and cut out images of size 32×32. In this work, we propose to explore various architectures of convolutional neural networks with the
ResNet50V2 skip connection mechanism [31], as well as to perform hyperparameter tuning. Convolutional neural networks are typically applied to classify RGB images with a resolution of 256×256, and networks from the ResNet family have proven successful in such tasks. However, in our work, the image is represented in grayscale (has 1 channel) and the size of such an image is only 32x32. Therefore, it is proposed to remain only the common structure of ResNetV2, keep 4 stages of convolution and identification, and also reduce the size of the kernels in the upper layers of the architecture, in the convolutional layers, and in the MaxPooling layers.
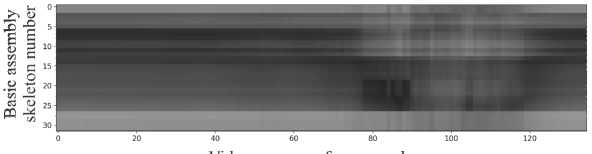
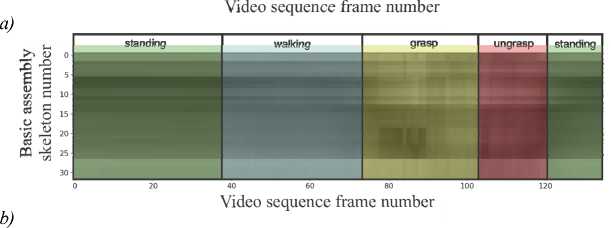
Fig. 9. An example of video sequence annotation
We propose to modify ResNetV2 by adding a Squeeze-and-Excitation (SE) mechanism after each convolutional block [36–38]. The SE block is applied to train the model to detect inter-channel dependencies in the tensors generated by the neural network and to select the most important features. The architecture of the SE-ResNetV2 convolutional network is presented in Fig. 10.
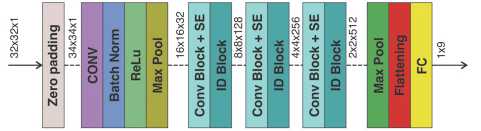
Fig. 10. Proposed architecture of the SE-ResNetV2
Dataset preparing
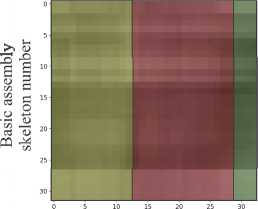
For training the model on activity maps, it is proposed to obtain 32×32 activity maps for each video sequence using a sliding window with a step of one frame. The size of the activity map is determined by the number of selected basis skeletal models and the size of the sliding window. Then, each window needs to be associated with a target vector y, which represents the activity map class encoded using the one-hot procedure. However, since frames of different classes may be present in one activity map, it is proposed to compute the proportional ratio of the number of frames belonging to one activity to the size of the sliding window (Fig. 11). Thus, the target vector will be y = {0, 0.687, 0, 0, 0.313, 0, 0, 0} corresponds to the activity map in Fig. 11a, and the target vector y = {0.125, 0, 0, 0, 0.375, 0.5, 0, 0, 0} is an activity map in Fig. 11b. When preparing the training sample, it is also proposed to use stratification of objects in batches so that each batch contains objects from all classes. Moreover, It is proposed to shuffle the batches every training epoch to ensure a more stable training process.
Frame number

Frame number
a)
b)
Fig. 11 Examples of annotated 32x32 activity maps with corresponding target vectors y = {0, 0.687, 0, 0, 0.313, 0, 0, 0} (a) and y = {0.125, 0, 0, 0, 0.375, 0.5, 0, 0, 0} (b)
The training algorithm is proposed to be estimated using the Leave-one-person-out procedure. It’s suggests to exclude one of the eleven actors from the training sample and used only for testing. This procedure is repeated for each of the actors.
Experimental results
Inference metrics
To provide a quality assessment in our research we propose to compute the confusion matrix for multiclass case (4) and then to estimate F-measures. The size of this matrix is K × K , where K – is a number of classes. Each column represents the class predicted by the model, which each row represents the actual class. The diagonal cells indicate the number (ratio or percentage) where the true and predicted classes coincide. The off-diagonal cells represent the instances where the model made errors in prediction. The row-wise sums display the true number of objects in each class, whereas the column-wise sums show the predicted number of objects in each class. The sum of all cells represents the total number of objects.
|
a i,i a 2,1 |
a 1,2 . a 2,2 . |
.. a 1, k . .. a 24 . |
. a 1, к .. a 2, K |
||
|
confusion _ matrix = |
... a 4,1 |
... . a k ,2 . |
.. ... . .. a k , k . |
.. ... .. a k , K |
.(4) |
|
... aK ,1 |
... . a K ,2 . |
.. ... . .. a K , k . |
.. ... .. aK , K |
||
|
- |
- |
Formulation of TP , FN , FP , and TN based on the confusion matrix requires the adoption of a strategy to reduce the multiclass problem to binary (one-vs-the-rest). Thus, confusion matrix allows to form TP , FN , FP , and TN in the following way:
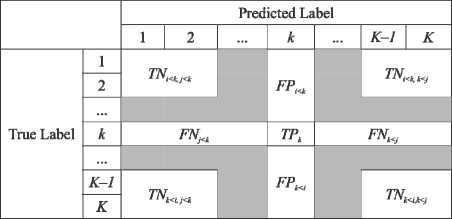
Fig. 12. TP, FN, FP, and TN from OVR confusion matrix
Thus, for k -th confusion matrix:
TP k = a k , k , FN k = FN j < k + FN k < j = £ a k , j , j =1, j * k
FP k = FP j < k + FP k < j = Zaitt , i =1, i * k (5)
TN k = TN i < k , j < k + TN i < k , k < j + TN k < i , j < k +
K
+ TN k < i , k < j = £ a i , j .
i , j =i; i, j * k
The F-measure estimation should be obtained K times for each class as:
F k =
2 TP k
, k =1
2TPk + FPk + FNk
K .
The commonly used in industrial application F macro measure is formed as an arithmetic mean of binary measures:
£Fk k=1 macro , K
F = 1 K 2 TP k (8)
macro K £ 2TPk + FP k + FN k '
This measure estimates the quality more accurate on imbalanced classes. We also assess the frequently used F micro to simplify a comparison with another works. In multiclass classification issues this measure gives the same value as Accuracy [39]:
F micro
1 K TP k
K £ TP k + TN + FP k + FN k '
SE-CNN model hyperparameters tuning
The proposed neural network model has a large number of hyperparameters. The following parameters were tuned in the study:
-
• learning-rate: a parameter of the Adam optimization algorithm [40], which determines the learning rate at each iteration.
-
• start-kn: a parameter in the model that defines the initial number of filters for the convolution operation.
-
• se: the presence or absence of the attention mechanism.
To evaluate the quality of the classification solution while hyperparameter tuning, data from one actor (Data11) were used. Initially, the parameters start-kn and se were tuned. The learning-rate parameter was set to the standard value of 0.001. Since each run of the model training procedure starts from a random initial point, i.e. all neural network weights are initialized randomly (using the Xavier uniform initializer [41]), and the training results may differ with the same parameters, it was proposed to perform training 5 times, then calculate the statistical characteristics (mean, median, and standard deviation) and based on them determine the values of the tuned hyperparameters. From the data in Table 2, it can be concluded that the set of parameters start-kn = 32 and se = True is the optimal choice, as it has the highest mean and the lowest standard deviation.
Thus, it can be assumed that the training process with these model parameters going to be more stable. Now, in the same way, let’s perform the tuning of the learning rate with the specified start-kn = 32 and se = True . From Table 3, it can be concluded that the optimal value of the hyperparameter learning-rate is 0.001.
The training time on 10 actors using two A100 GPUs takes 35 minutes. Thus, to tune the learning-rate on one actor, it requires 700 minutes, and for tuning start-kn and se, it requires 1400 minutes.
Tab. 2. Accuracy for different configuration of start-kn and se
|
8, True |
8, False |
16, True |
16, False |
32, True |
32, False |
64, True |
64, False |
|
|
mean |
0.8671 |
0.8532 |
0.8672 |
0.8743 |
0.8908 |
0.8869 |
0.8749 |
0.8880 |
|
std |
0.0050 |
0.0201 |
0.0124 |
0.0090 |
0.0035 |
0.0186 |
0.0235 |
0.0101 |
|
median |
0.8688 |
0.8403 |
0.8716 |
0.8794 |
0.8931 |
0.8934 |
0.8813 |
0.8925 |
Tab. 3. Accuracy estimation for different learning rates (lr)
|
lr = 0.1 |
lr = 0.01 |
lr = 0.001 |
lr = 0.0001 |
|
|
mean |
0.8595 |
0.8582 |
0.8975 |
0.8788 |
|
std |
0.0142 |
0.0290 |
0.0157 |
0.0178 |
|
median |
0.8592 |
0.8706 |
0.9042 |
0.8845 |
Training and inference of the model
The classification of human activities using the trained neural network model with optimal hyperparameters was conducted using the Leave-one-person-out procedure on the entire TST Fall Detection v2 database. The confusion matrix is presented in Table 4, with corresponding F macro = 0.747 and Accuracy = 0.825 scores. Table 4 contains similar activities such as standing and walking, grasp and ungrasp, as well as lying, falling, and post-fall-lying. This activities are close to each other in the video sequences (corresponding classes is highlighted in Table 4).
Results discussion and conclusion
The paper describes a method for representation of the skeletal model by a vector of pairwise dissimilarities with a basic assembly and pairwise dissimilarity function of two skeletal models. In this work we represent fragments of video sequences as activity maps with a goal to scale proposed in [22] approach to human action recognition problem. We also conduct the analysis of the basic assembly and propose reducing the basic assembly to exclude the most correlated reference objects. We perform our own frame-by-frame annotation for the TST Fall Detection database due to its absence. The classification of human activities was performed by the convolutional neural work with SE-block implementation adapted to one-channel small size images. We also apply proposed hyperparameters tuning. As a result of experiments, a frame-by-frame assessment of the quality of human activity classification on 9 classes estimates Accuracy = 0.825 and Fmacro = 0.747.
The results achieved in other works have higher quality scores. However, in the works of Alessandro Manzi [42] and Jun Yin [43], there was no frame-byframe annotation, and the classification objects were entire video sequences. In our work, by virtue of the frame-by-frame annotation of the database, we identify activities that most closely correspond to real human actions. That’s allow us to made a decisions for each frame separately and to more clearly recognize the activities performed by the actors in the database. It is also worth noting that the testing procedure is not described in [32, 42].
Future work involve the development of augmentation techniques at the skeletal representation level, experiments with the transfer learning by pre-trained model on a more extensive dataset such as NTU 120 dataset, PKUMMD, etc. And also we are planning to apply a machine learning model based on the Transformer architecture to our skeletal representation by activity map.
Acknowledgements
This research is funded by the Ministry of Science and Higher Education of the Russian Federation within the framework of the state task FSFS-2024-0012.
Tab. 4. Confusion matrix for by-frame classification of videos from the TST Fall Detection v2 dataset
|
standing |
walking |
grasp |
ungrasp |
sitting |
lying |
falling |
post-fall-lying |
no_class |
|
|
standing |
7429 |
496 |
0 |
60 |
0 |
0 |
284 |
10 |
81 |
|
walking |
711 |
8652 |
47 |
1 |
0 |
0 |
6 |
0 |
49 |
|
grasp |
40 |
54 |
637 |
44 |
0 |
0 |
52 |
0 |
178 |
|
ungrasp |
43 |
15 |
29 |
818 |
0 |
0 |
0 |
4 |
24 |
|
sitting |
0 |
0 |
0 |
0 |
1734 |
6 |
188 |
16 |
100 |
|
lying |
0 |
0 |
0 |
0 |
17 |
250 |
107 |
425 |
123 |
|
falling |
331 |
2 |
35 |
6 |
256 |
28 |
5548 |
373 |
298 |
|
post-fall-lying |
0 |
0 |
0 |
0 |
53 |
210 |
295 |
1731 |
213 |
|
no_class |
143 |
61 |
76 |
74 |
122 |
160 |
476 |
91 |
3931 |
Tab. 5. Comparison achieved results of HAR problem solving on the TST Fall Detection v2 dataset
