Human Opinion Analysis through Text Mining

Author: Md. Ahasan Habib Sami, Mahir Rahaman Khan, M. Mahmudul Kabir, Khairul Islam Kakon, Dip Nandi
Journal: International Journal of Education and Management Engineering @ijeme
Article in issue: 4 vol.15, 2025.
Free access
With the technological advancements, global communication has largely shifted to text-based communication. As a result, the process of extracting meaningful insights from human behavior by machine learning techniques applied to textual data has now been significantly simplified. This research utilizes text mining methods to analyze customers feedback from food reviews, employing them as effective tools for opinion analysis and rating prediction from feedback. This research utilizes two neural network techniques (Normal Neural Network and LSTM) to analyze textual data and generate predicted scores ranging from 1 to 5 for each review from Amazon food review dataset. After implementing two neural network models, the system automatically generates a predicted score on a scale from 1 to 5. This study employs widely-used neural network techniques and provides a foundation for advancing text-based emotion detection in future research. The primary focus of this study is on unaltered customer feedback and it aims to solve the problem of accurately analyzing customer sentiments or opinion and extracting meaningful insights from their feedback. By comparing the performance of LSTM and standard neural networks, we achieve a 62.12% accuracy, showcasing superior results in emotion prediction from unstructured textual reviews. These insights pave the way for more scalable and efficient solutions in text mining for emotion detection.
Text Mining, Opinion Analysis, Neural Network, Text Review, Human Emotion
Short address: https://sciup.org/15019876
IDR: 15019876 | DOI: 10.5815/ijeme.2025.04.03
Text of the scientific article Human Opinion Analysis through Text Mining
Human opinions are always influenced by emotions. To analyze human opinions, emotions should be considered a top priority. Emotions are psychological responses driven by human cognition and mental or physiological activities, shaped by thoughts, perceptions, and evaluations. They influence behavior, decision-making, and social interactions, playing a key role in human nature. Emotions can aid in decision-making and facilitate psychological processing in relationships [1]. Emotion is a crucial factor that significantly impacts our everyday performance, influencing several elements of our life such as social interaction, behavior, attitude, and decision-making. In many fields, like public health and safety, dis- aster response, and urban planning, it’s important to understand how people feel and how their emotions change over time [2]. The six categories of emotions that exist globally are concern, pleasure, love, surprise, anger, and disappointment.
Significant progress has been made in the field of voice and facial emotion identification but the research community still needs to focus on developing a text-based emotion recognition system [3]. The identification of human emotions in text is gaining significance in computer linguistics due to its real-world consequences.
Opinion analysis is to identify the underlying emotions in written text through the analysis of input texts authored by writers. This is predicated on the notion that an individual’s state of happiness has a direct impact on their Tendency to employ positive language. Similarly, we can determine someone’s underlying discomfort from their words, whether they are angry, irritated, or sad. Text-based emotion detection enables the identification of the emotional state of the writer or reader. The purpose of developing emotion detection is to give indications for enhancing human-computer interactions, allowing computers to function as social actors and create more authentic relationships [4]. Social networks like Twitter and Facebook allows individuals to share opinions and emotions such as happiness, anxiety and depression through short text messages, providing valuable real-time data. These, can be about everyday things or about current events and problems where this data can be analyzed to gain insights into emotional trends, sentiment, and social dynamics on a large scale. [2]. Precisely determining an individual’s emotional condition from several data sources is a difficult task. Due to the increasing popularity of social media and online platforms in recent decades, the use of text-based emotion detection has become an appealing method for addressing the difficulties associated with acknowledging emotions. The feedback for a certain product also offers a distinct analytical solution.
This study works with the Amazon Review dataset for an investigation of emotion recognition. There are still some problems with understanding raw text, such as mistakes in grammar, the use of emojis, and variations in writing technique. Text that is hard to understand might have emojis, different phrase lengths, mistakes, and more. A lot of reviewer rate goods in short sentences, and some reviews aren’t very clear. Human emotions are complicated to define in a way that works for everyone.
This study addresses these challenges using the Amazon Review dataset to investigate emotion recognition. Challenges such as grammatical errors, varied writing styles, and the presence of emojis or ambiguous phrasing make text understanding particularly difficult. Many reviews are short and unclear, further complicating emotion detection. Despite these complexities, features such as tags, stop words, parts of speech, and grammar remain valuable for improving sentiment analysis and emotion detection. To tackle these issues, this research implements an advanced text preprocessing pipeline tailored for noisy textual data. It also optimizes lightweight Long Short-Term Memory (LSTM) architectures for the dataset, demonstrating superior performance compared to transformer-based models. A comparative analysis of LSTM and standard neural networks highlights their differences in terms of accuracy, complexity, and memory requirements. By testing both approaches, the study aims to determine which algorithm yields the most precise outcomes, providing insights into sentiment analysis and emotion detection in written language.
2. Related Works
Exploring how people feel and predicting their emotions has always been fascinating. It’s become even more exciting now, with advanced technology like machine learning and text mining. These tools help us understand emotions better. From way back when people first started wondering about emotions to today’s complex computer analyses, we’ve come a long way. Machine learning, like using computers to learn from data, helps us figure out what people are feeling. Text mining, which is like digging out useful information from written text, also plays a big role.
Together, they let us use lots of different methods and tricks to understand emotions from all kinds of information. But there are still challenges, like making sure we use this technology responsibly and respecting people’s privacy. By working together and learning from different fields, we can keep making progress and learn more about how emotions work.
The ethical use of textual data was ensured by adhering to principles of informed consent, as the dataset was explicitly made available for research purposes on the Kaggle platform. The study maintained the integrity of the data by analyzing it in its original form without any alterations, thereby avoiding any form of emotional manipulation. The findings were strictly used for academic and practical advancements in sentiment analysis, with safeguards in place to prevent misuse or exploitation.
-
2.1 Overview of Human Emotion for Opinion Analysis
-
2.2 Background
Understanding the interplay between human emotions and opinions are crucial for various fields, including psychology, marketing, and interpersonal communication. By examining the aspects outlined in Table 1 ranging from primary and secondary emotions to cultural influences and emotional intelligence. We can gain deeper insights into how emotions shape our opinions and decision-making processes. This framework not only enhances our comprehension of emotional dynamics but also informs strategies for effective communication and emotional regulation in diverse contexts. Human emotions are complex and multifaceted experiences that play a significant role in our lives.They are typically categorized into primary emotions such as happiness, sadness, anger, fear, surprise, and disgust, with many variations and blends in between. As, Human opinions are the reflection of human emotion. So, here’s an overview of some key aspects which will help to reach a specific result from opinions.
Table 1. Description of Aspects
|
Aspects |
Description |
|
Primary Emotions |
Happiness, Sadness, Anger, Fear, Surprise, Disgust. |
|
Secondary Emotions |
Complex emotions arising from combinations or variations of primary emotions, e.g., jealousy, guilt, shame, pride. |
|
Physiological Responses |
Emotions are accompanied by physiological changes such as increased heart rate, sweating, changes in facial expression, and hormonal fluctu- ations. |
|
Cognitive Appraisal |
Emotions are influenced by how we perceive and interpret events. Our thoughts, beliefs, and past experiences shape emotional responses. |
|
Cultural and Social Influ- ences |
Emotions are influenced by cultural norms and social contexts. What is considered appropriate or acceptable to feel and express varies across cultures. |
|
Expression and Regulation |
Emotions can be expressed verbally, nonverbally (through facial expres- sions, body language), or through actions. People use strategies to reg- ulate or control emotions. |
|
Functionality |
Emotions serve functions like communication, social bonding, and adaptation to navigate the environment. |
|
Emotional Intelligence |
The ability to recognize, understand, and manage one’s own emotions and the emotions of others. Skills include empathy, self-awareness, and communication. |
To make judgments early and maybe create predictions for feedback analysis, big data sets are scanned and mined for useful information. The fact that companies and other industries gain far more from using data than they do from not using it may be the primary reason text mining has emerged as one of the top areas of computer science research. Despite the industry’s massive data production, the majority of information is ultimately useless. As a result, it has shown to be quite helpful in the recent years when attempts have been made to mine, analyze, and use large data from the industry. Over the years, numerous researches have been conducted. This has progressed to the point that it is being attempted to identify which hereditary emotion are more likely to manifest than others. The most effective algorithm for researching inherited emotion identification turned out to be the RNN method. It is crucial to remember that each type of emotion operates differently and will produce the best outcomes under quite diverse algorithms, since elements vary greatly from person to person. Prior to any data being used, risk considerations should always be determined as the classification or mining parameters for the data.
Detecting human emotions comes with several risks, primarily related to privacy, ethics, and accuracy:
-
• Privacy Concern
-
• Ethical Implication
-
• Bias and Fairness
-
• Accuracy and Reliability
-
• Emotion Manipulation
-
• Informed Consent
-
• Psychological Impact
-
2.3 Algorithm Diversity
In [4] there at first author used keyword-based techniques. They extract NAVA (Noun, Adjective, Verb, Adverb). Then tokenized and removed stop-words to analyze the intensity and check negative emotions. Machine Learning, Hybrid model also used in [3]. In machine learning approach the emotion classified into some parts. Anger, Joy, Disgust, Fear from input text. In hybrid model rule-based approach followed to extract semantics-based emotion and Chinese lex- icon ontology to extract attributes. This is comparatively showed better result from previous models. They also proposed methodology and completed it by confusion metrics. Machine Learning approaches solves the emotion detection problems by classifying text into various emotion categorize from the implementation of machine learning [5]. The [6] used in the text for emotion detection in text encompasses a variety of approaches, including feature-based models like Naive Bayes and Logistic Regression, statistical methods such as Bag-of-Words (BoW) and TF-IDF, as well as neural models like Recurrent Neural Networks (RNNs) and BERT-based models. These approaches leverage word-emotion associations, document representations, and contextualized embeddings to learn emotional signals from text data. Additionally, ensemble methods that combine different algorithms have been explored to enhance performance. Overall, the text high- lights a diverse range of algorithms and techniques used to detect emotions in text, from traditional statistical methods to state-of-the-art transformer architectures.
Now if we turn our focus to lexicon-based methods in [7] we find the advantage of lexicon-based methods lies in their simplicity, interpretability, and minimal need for extensive labeled datasets. These approaches excel in domains where transparency in decision-making is critical or when computational resources are limited. However, they may struggle to handle sarcasm, negation, and context, making them less robust than neural network models in certain scenarios. For example, a lexicon-based system might misinterpret sarcasm in the phrase ’great job on being late again’ as positive sentiment due to the presence of the word ’great’. In contrast [8] states that, machine learning and hybrid models, such as those combining lexicon-based features with neural embeddings, offer a balance between simplicity and robustness. These models address some of the shortcomings of standalone lexicon approaches while retaining their interpretability. For example, hybrid models have demonstrated improved performance in classifying nuanced emotions by integrating features like part-of-speech tags, contextual embeddings, and word-emotion associations.
Different approaches applied in [9], where DNN (Deep Neural Network) are used. The DNN is employed to address the regression problem of emotional status detection using language features extracted from speech transcripts. Firstly Fast Text embedding’s utilized as word representations for the text data. FastText embeddings are derived from a Skipgram model trained on a large corpus of text data. The next phase, [6] used 3 dimensions. First two layers have 5 units each. the output layer, consists of 3 units representing the dimensions of the emotional status (Valence, Arousal, and Dominance), with a sigmoidal activation function. The paper [7] used Deep Learning Assisted Semantic Text Analysis (DLSTA). These techniques are an approach that combines deep learning methods with NLP techniques to analyze textual data and detect human emotions effectively. Another variation seems in [8] which detect emotion of human using Nested Long Short-term memory. Category of human emotion are classified in 7 classes. Anger, Fear, Joy, Love, Sadness, surprise and thankfulness. The LSTM was compared with SVM [8]. Each model is trained with 980,549 training data and tested with 144,160 testing data. The result given better performance using LSTM and Nested LSTM than SVM.
-
[10] worked with Machine Learning model The algorithm used for classifying emotions in text stream messages is likely a supervised learning approach, where machine learning models are trained on labeled data to predict the emotions ex- pressed in text. The system employs a soft classification approach, meaning it assigns probabilities to each emotion class rather than making hard, binary decisions. The actual machine learning algorithms used could include Support Vector Machines, Random Forests, or Neural Networks, among others. Additionally, an online method is proposed to measure public emotion in real-time, allowing for the detection of emotion bursts in live text streams. Full Machine Learning approaches followed by [10]. More specific machine learning analysis showed for detecting human emotion are completed in [11]. the algorithm used for detecting emotion from text and emoticon appears to be a combination of keyword analysis, keyword negation analysis, and pattern matching techniques. the methodology involves creating emotion classes based on keywords, emoticons, proverbs, short forms of words, and exclamatory sentences. These methods are implemented using rule-based approach in [11].
The approaches of [12] combine keyword-based classification with linguistic feature handling, including POS tagging, tokenization, and text normalization. Algorithms are developed for detecting emotion causes, tense of sentences, and handling negations. Emotion detection relies on a lexicon-based approach using NRC Word-Emotion Association Lexicon and WordNet Effect lexicon, where the emotional class with the highest number of matching keywords in the text is assigned. Evaluation of the proposed mechanism includes tests on precision, recall, accuracy, and F-score, showing improvements after cause removal and handling of contrasting conjunctions. In the study of [13] In the study, the authors employed machine learning techniques, including lexicon-based, classic methods like Na¨ıve Bayes and Support Vector Machine (SVM), and deep learning using Conv1D + LSTM neural network for text emotion detection. SVM created class boundaries maximizing margin. They compared SVM with various methods like K-Nearest Neighbor, Decision Tree, etc., finding CNN + LSTM yielded the best results [13]. Different methods are used in [1] to understand emotions in text. One way is by combining Random Forest and Support Vector Machine, like Al Amrani et al. did in 2018. Another common method involves using machine learning, where data is split into training and testing sets, and algorithms like Na¨ıve Bayes, Support Vector Machine (SVM), and Decision Trees are used. Deep learning models, such as CNN, LSTM, and Bi-LSTM, are also popular, as explored by Pasupa and Ayutthaya in 2019, especially for analyzing sentiments in children’s tales. Lastly, many researchers mix machine learning and deep learning with different feature extraction techniques to improve sentiment analysis and emotion detection. These approaches highlight the variety of ways to tackle sentiment analysis and emotion detection in text. But there is an argue that Conventional often fail to capture the sequential nature and context of text, leading to insufficient and nongeneralizable emotion detection methodologies [14]. So, authors
[14] proposed a Bi-Directional GRU (Gated Recurrent Unit) model to capture more meaningful information from text, thereby improving the performance of emotion detection models. The proposed model of [14] consists of a bidirectional GRU network followed by global max- pooling and average-pooling layers to create a hidden representation of the text. Seven binary classifiers, one for each emotion, are trained using this architecture. The authors compare their approach with baseline methods and report significant improvements in emotion detection performance, particularly for low-count emotions.
2.4 Text mining in human emotion detection for opinion analysis from text
Human life is inextricably linked to emotions. These feelings affect how we make decisions and improve our ability to Interact with others. For the past few years, researchers have been putting a lot of effort into automatic emotion recognition. But certain bodily functions—like heart rate, hand trembling, perspiration, and vocal pitch—can also reveal an individual’s emotional condition [21]. Among many methods and algorithm have been use for investigate emotion detection RNN, CNN and LSTM are few of mostly utilized methods. Recurrent neural networks and convolutional neural networks are two examples of deep learning algorithms that can be used for sentiment analysis. These algorithms produce findings that are more accurate than those produced by machine learning models [22]. With this method, deep learning models extract certain characteristics or patterns from the text, freeing people from the laborious task of manually creating those features. Jian et al. (2010) developed a neural network-based sentiment classification model comprising sentimental features, feature weight vectors, and a previous knowledge base. The model was utilized by the writers to examine the Cornell movie’s data. In comparison to HMM and SVM, the experimental results presented in this work show that the I- model has an exceptionally high degree of accuracy [23]. In their study, Pasupa and Ayutthaya (2019) used five-fold cross-validation on the Children’s Tale (Thai) dataset to compare three deep learning models: CNN, LSTM, and Bi- LSTM. These models are applied with or without features: POS-tagging (a pre-processing technique to identify different parts of speech); Thai2Vec (word embedding trained from Thai Wikipedia); and sentic (to understand the sentiment of the word). The authors found that the CNN model performed best when all three features were applied. As previously mentioned, social media platforms are a major source of data for sentiment analysis research [24]. In order to perform sentiment analysis in Persian, Dashtipour et al. (2020) suggested a deep learning architecture. Utilizing the hotel and product review dataset, the researchers found that deep neural networks, such CNN and LSTM, performed better than the state-of-the-art machine learning algorithms [25]. Convolution neural networks have also been utilized by to recognize emotions [26]. According to it is preferable to use RNN bidirectional- (Bi-LSTM) to extract crucial speech characteristics for improved emotion recognition performance [27].
2.5 Challenges
Using neural networks, including Recurrent Neural Networks (RNNs), for human emotion detection poses several challenges. Firstly, these models require large amounts of labeled data for training, particularly annotated emotional data, which can be scarce and expensive to obtain. Additionally, RNNs may struggle with capturing long-range dependencies and contextual nuances in emotional expression due to their sequential processing nature [28]. The majority of resources are only available in English, which presents another issue. As a result, researchers have both enormous opportunities and challenges when it comes to sentiment analysis and emotion identification from languages other than English, particularly regional languages. Moreover, a portion of the lexicons and corpora are domain specific, which restricts their applicability in other fields [22]. People typically use ironic and sarcastic language to convey their dissatisfaction or rage, which might be difficult to spot (Ghanbari-Adivi and Mosleh 2019). For example, the term excellent in” This story is excellent to put you to sleep” conveys a pleasant feeling, while the reviewer found the story to be somewhat boring. Therefore, in the realm of sentiment and emotion recognition, sarcasm detection has turned into a laborious task [22].
3. Methodology
The paper [15] discusses different ways to detect emotions in text, which is useful for various applications like marketing, psychology, and artificial intelligence. It explains two main approaches: supervised and unsupervised methods. Supervised methods use labeled data to train machine learning models, while unsupervised methods analyze text patterns without labeled data. Some studies combine these approaches for better results. Techniques include analyzing hashtags and emoticons in tweets, using sentiment lexicons, and applying semantic analysis. The paper also addresses challenges like imbalanced data and evaluates methods using metrics like accuracy and F1-score. Overall, it provides a comprehensive overview of emotion detection techniques in text, emphasizing their importance and potential applications. Another different method showed in [16]. One is “Emotion detector algorithm” which gives high score at happy and low score at sad. Authors also used “Lexical Affinity Method” which looks at how likely a word is to represent an emotion even if it’s not an obvious emotion word. Finally, there are” Learning-based Methods,” which use computers to learn patterns in the text to guess emotions. Besides, the same rule-based approach used in [17] which methodology combines lexical resources and rule-based decision-making to effectively detect emotions in Myanmar text posts. Besides, [18] focused on Neural Network methodologies. Which uses K-fold cross validation to reduce the overfit. the methodology of [18] combines the backpropagation algorithm with cross-validation techniques to improve the efficiency and accuracy of text mining tasks. Also, back propagation, k-fold cross-validation, stratified crossvalidation, leave-one-out, and bootstrapping are discussed and implemented in [19]. Another neural network LSTM from RNN used in [20]. While neural networks are effective for this purpose, traditional lexicon-based methods remain valuable due to their interpretability and lower computational requirements [21].
These challenges can significantly impact results by adding noise and confusion to the model’s predictions. For example, sarcasm may lead to incorrect sentiment interpretation, messy data can cause the model to struggle with understanding patterns, and language diversity can hinder the model’s ability to generalize across different languages. If not properly addressed, these issues can lower the accuracy of sentiment analysis and emotion detection, leading to misclassifications or missed nuances in the text [27].
The challenges in text mining and sentiment analysis were addressed through several techniques using Normal Neural Network and LSTM. Tokenization and padding standardized messy, variable-length text data by converting it into fixed-length numerical sequences. An embedding layer captured word relationships and context, allowing the model to understand subtle sentiments. LSTM layers handled sequential patterns and long-range dependencies, improving the model’s ability to interpret context. A data generator efficiently processed large datasets in batches, ensuring smooth training. Validation and test splits enabled accurate performance evaluation, helping the model adapt to diverse vocabulary and nuances like sarcasm. These methods together enhanced accuracy and addressed key issues effectively.
In this paper the effectiveness of neural networks in detecting human emotions from text was explored by the researchers. Specifically, two types of neural networks Simple Neural Network and Long Short-Term Memory (LSTM) network, were investigated to determine which neural network performed better in this task. Though In this era of technological advancements, BERT and GPT are among the most reliable models in natural language processing [23] and BERT excels in understanding context through its bidirectional approach, making it highly effective for tasks like text classification and question answering [24], we used LSTM and Simple Neural Network because of the dataset Size and computational resources. LSTM demonstrates superior performance over transformer models such as BERT on small datasets due to its simplicity, reduced training time, and lower risk of overfitting [25]. As our dataset ‘Amazon Fine Food Review’ is considered a small dataset contains half of a million rows. Where a large dataset should contain a million of rows [26] for this reason LSTM and Simple Neural Network performed best.
The dataset utilized for this study was obtained from Kaggle, known as ”Amazon Fine food review,” which included important columns such as the raw feedback given by customers, a summary of the feedback, and ratings ranging from 1 to 5. The Amazon Fine Food Reviews dataset contains over 500,000 customer reviews, making it a valuable resource for text mining and score prediction tasks. It offers a wide range of real-world feedback, helps to develop models to predict ratings from 1 to 5 based on textual feedback. The variety provides an excellent foundation for applying NLP techniques and training machine learning models for opinion analysis and score prediction.
The algorithms were implemented using the Python programming language, and the code was executed on Google Collab, a cloud-based platform for coding and collaboration. By comparing the performance of the two neural network algorithms, insights into which approach is more effective for detecting human emotions from textual data were aimed to be provided by the researchers. This research contributes to the growing body of knowledge on sentiment analysis and emotion detection using machine learning techniques. Neural Networks are useful in text mining, especially for dealing with complex and changing data patterns.[20].
Preprocessing:
To address the challenges of noisy text, we developed a robust preprocessing pipeline:
-
• Tokenization and Padding: Texts were standardized into fixed-length sequences to handle variable-length reviews effectively.
-
• Embedding Layer: Words were transformed into high-dimensional vectors using task-specific embeddings to capture semantic relationships and context.
-
• Advanced Noise Handling: Techniques were implemented to manage emojis, abbreviations, and grammatical errors.
The followed step in both neural network and LSTM are mentioned below:
-
• Step 1: Read CSV file
-
• Step 2: Extract text and file column
-
• Step 3: Splitting data into test and train dataset
-
• Step 4: Data Generator: The number of steps per epoch is determined by dividing the total number of samples by the batch. The function enters an infinite loop. Within each iteration of the loop, batches of data are generated. It iterates over the range of steps per epoch. For each iteration of the inner loop, the start and end indices of the current batch are calculated based on the current step and the batch size. Tokenization and padding yield the padded text sequences and their corresponding scores.
-
• Step 5: First layer is Embedding layer. Second layer is Flatten layer. Dense layer with 64 neurons(nodes) and a RELU. Finally, there’s another Dense layer with 1 neuron and a ’linear’ activation function.
-
• Step 6: Compile the model
-
3.1 Model Architecture for Normal Neural Network
-
3.2 Model Architecture for LSTM (Long Short Term Memory)
Table 2. Description of layers for Normal Neural Network
|
Layers |
Equation |
Description |
|
Input Layer |
X and Win |
Receives input data X , with weights Win connecting it to the hidden layer. |
|
Hidden Layer |
Z = XWin + b |
Where Z is the output. Then A = σ ( Z ), with an activa- tion function σ . |
|
Output Layer |
Y = AWout + bout |
Represents the weighted sum of inputs plus bias ( bout ), where Y is the output of the neural network. Then, Y = σ ( Y ), where σ is the activation function applied to Y . |
LSTM, a recurrent neural network (RNN) variant, holds significance in text mining due to its proficiency in processing sequential data, particularly textual content. Its capability to effectively model long-range dependencies in sequential data enhances the thoroughness and rigor of text analysis [21]. Every step of LSTM is same as basic neural network except model building. The model is different in this respect. In text analysis, LSTM-RNN sees a sentence as a series of words with connections between them, for example, how words are related to each other [24]. Embedding layer used for this reason. As, text is a sequence of words. LSTM works with some state. The components and Descriptions are discussed below.
Table 3. Description of LSTM Components
|
Component |
Description |
|
Input Gate ( it ) |
Controls the flow of information into the cell state, determining which information to keep or discard based on the current input. |
|
Forget Gate ( ft ) |
Modulates the retention or forgetting of information from the previous cell state, allowing the LSTM to remember or forget information from previous time steps. |
|
Cell State ( ct ) |
Represents the internal memory of the LSTM, storing information over time and passing it along the sequence. |
|
Output Gate ( ot ) |
Regulates the flow of information from the cell state to the output, determining which information to expose as the output at the current time step. |
|
Hidden State ( ht ) |
Represents the LSTM’s output at each time step, capturing relevant information from the current input and previous hidden state. |
The tables mentioned the LSTM:
By integrating these mechanisms, the LSTM effectively models long-term dependencies in textual data, capturing the nuances of sentiment and emotion embedded within customer reviews. For instance, phrases like “I initially disliked it, but the support team resolved my issues quickly” are interpreted holistically, enabling the detection of evolving sentiments.
In the process of model building, the model building process involves multiple layers, starting with an embedding layer that converts a vocabulary of 100 words into 128-dimensional vectors, totaling 128,000 parameters. Subsequent dense layers significantly increase the complexity, with the first dense layer contributing over 8 million parameters and the second layer outputting a single prediction with 65 parameters.
Model Building Steps
Table 4. Model Building Steps
|
Layers |
Number of Parameters |
Importance of Layers |
|
Step 1: Embedding Layer Parameters |
Vocabulary size: 100 Embedding dimension: 128 Total parameters = Vocabulary size × Embedding dimension = 1000 × 128 = 128 , 000 parameters |
The embedding layer converts categorical data into dense vectors, capturing semantic relationships and enabling the model to understand context, which is essential for accurate sentiment analysis. |
|
Step 2: Flatten Layer |
It connects the layers with embedding to dense. |
This step ensures that the data is in the correct format for the dense layers. It maintains the integrity of the learned features and allows for seamless data transition between layers. |
|
Step 3: First Dense Layer Parameters |
Number of units: 64 Input dimension: number of parameters in the embedding layer = 128,000 Total parameters = (Input dimension × Number of units) + Number of units = (128 , 000 × 64) + 64 = 8 , 192 , 064 |
Dense layers are fully connected layers that learn complex patterns by linking every neuron to the previous layer, with the number of units and parameters determining the model’s learning capacity and balancing complexity and overfitting risk. |
|
Step 4: Second Dense Layer |
Number of units: 1 Input dimension: 64 Total parameters = (Input dimension × Number of units) + units = (64 × 1) + 1 = 65 parameters |
Dense layers learn complex patterns by connecting each neuron to the previous layer, with units and parameters balancing learning capacity and overfitting risk. |
Table 5. LSTM Layers and Parameters
|
LSTM Layer |
Total Parameters |
|
First |
49,500 |
|
Second |
24,896 |
4. Analysis and Discussion
Table 6. Accuracy and MAE graph evaluation and description
|
Evaluation |
Description |
|
Validation loss |
The blue line showcases the improvement in recognizing familiar objects. The orange line depicts the performance on unseen validation data. |
|
Training Loss |
The blue line indicates the proximity of its guesses to actual answers during training, while the orange line reflects accuracy on new, unseen objects. |
-
4.1 Neural Network Analysis
Table 7. Curve Analysis for Normal Neural Network
|
Model |
Epoch |
Training Loss |
Validation Loss |
Training MAE |
Validation MAE |
Observations |
|
Normal Neural Network |
1 |
0.679 |
0.640 |
0.462 |
0.479 |
Initial training loss is high but decreases sharply; validation loss indicates some generalization but remains higher than training loss, suggesting overfitting |
|
2 |
0.431 |
0.629 |
0.393 |
0.455 |
Continued improvement in training loss, but validation loss does not significantly decrease, indicating a struggle to generalize. |
|
|
3 |
0.354 |
0.625 |
0.375 |
0.451 |
Training loss continues to decline; however, the validation loss stabilizes, indicating limited improvement on unseen data. |
|
|
4 |
0.338 |
0.620 |
0.371 |
0.440 |
Minimal changes observed in validation loss, reflecting overfitting as training loss continues to improve significantly. |
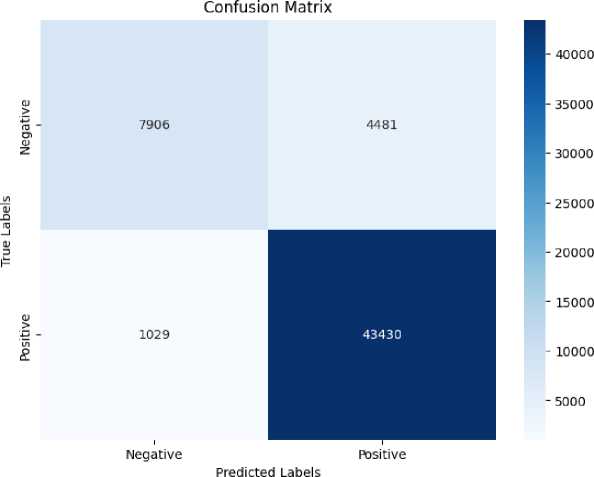
Fig. 1. Accuracy and Mean Absolute Error for Normal Neural Network
The model architecture comprising an embedding layer followed by dense layers, with a total of two trainable dense layers. This simplicity constrained the model’s capacity, reducing the likelihood of overfitting. Performance monitoring during training further ensured that the final model was selected based on validation performance rather than solely optimizing for training metrics, prioritizing generalization to unseen data. The embedding layer also helped mitigate overfitting by creating distributed representations of text, which captured semantic similarity and reduced redundancy compared to sparse or one-hot representations.
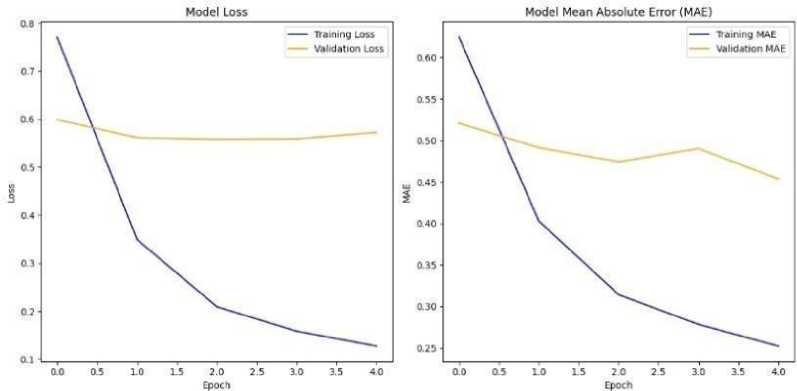
Fig. 2. Confusion Matrix of Normal Neural Network
Table 8. Precision, Recall, F1 Score and Support Analysis Table
|
Precision |
Recall |
F1-score |
Support |
|
|
0 |
0.88 |
0.64 |
0.74 |
12387 |
|
1 |
0.91 |
0.98 |
0.94 |
44459 |
|
Accuracy |
0.90 |
|||
|
Micro Avg |
0.90 |
0.81 |
0.84 |
56846 |
|
Weighted Avg |
0.90 |
0.90 |
0.90 |
56846 |
Table 9. Performance Evaluation Metrics and Analysis of Normal neural network
|
Metric |
Description |
Value |
Performance Implication |
|
True Negatives (TN) |
Number of correctly identified negative cases (Actual Negative, Predicted Negative). |
7,906 |
High TN indicates the model is success- fully rejecting negative cases, reducing false alarms. |
|
False Positives (FP) |
Number of incorrectly predicted positive cases (Actual Negative, Predicted Positive). |
4,481 |
High FP can lead to overestimating positive cases, impacting trust in the model’s predictions. |
|
False Negatives (FN) |
Number of incorrectly predicted negative cases (Actual Positive, Predicted Negative). |
1,029 |
Low FN is crucial for applications where missing a positive case is costly, e.g., disease detection. |
|
True Positives (TP) |
Number of correctly identified positive cases (Actual Positive, Predicted Positive). |
43,430 |
High TP shows the model effectively identifies true positives, boosting its utility in real-world scenarios. |
|
Accuracy |
Overall percentage of correctly classified cases. |
90% |
High accuracy means the model performs well overall, but it can be misleading if classes are imbalanced. |
|
Precision (Class 0) |
Proportion of true negatives among all predicted negatives (TN / (TN + FN)). |
88% |
High precision for class 0 means the model avoids many false negatives for negative predictions. |
|
Precision (Class 1) |
Proportion of true positives among all predicted positives (TP / (TP + FP)). |
91% |
High precision for class 1 shows the model is reliable in predicting positive cases with- out many false alarms. |
|
Recall (Class 0) |
Proportion of actual negatives correctly predicted as negatives (TN / (TN + FP)). |
64% |
Low recall for class 0 indicates the model struggles to correctly identify negative cases. |
|
Recall (Class 1) |
Proportion of actual positives correctly predicted as positives (TP / (TP + FN)). |
98% |
High recall for class 1 means the model captures nearly all positive cases, making it robust in critical applications. |
|
F1-Score (Class 0) |
Harmonic mean of precision and re- call for class 0. |
74% |
Balances precision and recall for negatives; low value shows performance for negatives needs improvement. |
|
F1-Score (Class 1) |
Harmonic mean of precision and re- call for class 1. |
94% |
Balances precision and recall for positives; high value reflects strong positive class detection. |
|
Macro Average F1 |
Averaged F1-score across both classes, giving equal weight to each class. |
84% |
Shows the overall performance across both classes but is sensitive to class imbalance. |
|
Weighted Average F1 |
F1-score averaged across classes, weighted by the number of samples in each class. |
90% |
Reflects the model’s real-world performance, taking class distribution into ac- count. |
The performance evaluation of the normal neural network demonstrates remarkable overall results, showcasing its efficacy in handling classification tasks with a high level of accuracy. With an impressive overall accuracy of 90%, the model exhibits strong capability in classifying cases correctly. The precision and recall metrics highlight the model’s strengths, particularly for class 1 (positive cases), where precision reaches 91%, and recall stands at an exceptional 98%. This ensures the model reliably identifies positive cases while minimizing false alarms and missed detections, making it highly robust for critical applications such as medical diagnosis or sentiment analysis. The F1-score for class 1 is also outstanding at 94%, reflecting an excellent balance between precision and recall in detecting positive cases. While the results for class 0 (negative cases) show slightly lower performance, with a recall of 64% and an F1-score of 74%, the model still maintains acceptable levels of reliability for rejecting negative cases. The high true positive count (43,430) and true negative count (7,906) further validate the model’s practical utility in real-world scenarios, ensuring that the majority of predictions align with actual outcomes. Overall, these metrics demonstrate the neural network’s reliability and effectiveness, particularly in applications where identifying positive cases is critical, and offer a solid foundation for future enhancements to optimize performance on negative predictions.
-
4.2 LSTM Analysis
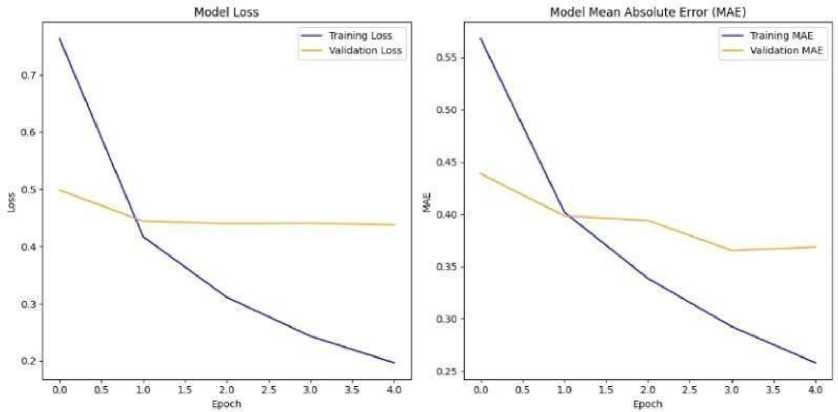
Fig. 3. Accuracy and Mean Absolute Error for Normal Neural Network
|
Negative (1-3) - |
Confusion Matrix |
-35000 -30000 |
|||||||
|
4458 |
0 |
0 |
0 |
658 |
|||||
|
Positive (4-5) - |
2221 |
0 |
0 |
0 |
700 |
-25000 |
|||
|
3 CD - |
1458 |
0 |
0 |
0 |
2892 |
-20000 - 15000 |
|||
|
346 |
0 |
0 |
0 |
7789 |
- 10000 |
||||
|
480 |
0 |
0 |
0 |
35844 |
-5000 -0 |
||||
Negative (1-3) Positive (4-5)
Predicted Labels
Fig. 4. Confusion Matrix for LSTM
Table 10. Precision, Recall, F1 Score, Support Analysis
|
Precision |
Recall |
F1-score |
Support |
|
|
1 |
0.50 |
0.87 |
0.63 |
5116 |
|
2 |
0.00 |
0.00 |
0.00 |
2921 |
|
3 |
0.00 |
0.00 |
0.00 |
4350 |
|
4 |
0.00 |
0.00 |
0.00 |
8135 |
|
5 |
0.75 |
0.99 |
0.85 |
36324 |
The “Model Loss” graph demonstrates a sharp and consistent decline in training loss, reflecting the model’s capacity to optimize and fit the data efficiently. This rapid convergence indicates that the architecture and hyperparameter choices allow the LSTM to capture meaningful relationships in the input data. With the training MAE steadily decreasing as the epochs progress. This behavior underscores the strength of the LSTM in minimizing prediction errors and achieving a fine level of precision on the training dataset. Even though the validation metrics plateau early, the alignment between the curves in the initial epochs reflects the model’s strong foundational learning capability.
Table 11. Curve analysis for LSTM
|
Model |
Epoch |
Training Loss |
Validation Loss |
Training MAE |
Validation MAE |
Observations |
|
LSTM |
1 |
0.703 |
0.482 |
0.469 |
0.450 |
Initial training loss is relatively high, but validation loss is much lower, indicating better generalization capability from the outset. |
|
2 |
0.330 |
0.462 |
0.364 |
0.420 |
Training loss shows significant reduction; validation loss also decreases, demon starting effective learning without overfitting |
|
|
3 |
0.291 |
0.450 |
0.356 |
0.400 |
Consistent decline in both training and validation loss, with MAE also showing steady improvement, reflecting a well-generalized model. |
|
|
4 |
0.265 |
0.430 |
0.352 |
0.390 |
Training loss continues to decrease; validation loss remains stable and low, indicating effective generalization and accurate predictions for unseen data. |
Table 12. Performance Evaluation Metrics and Analysis of LSTM
|
Metric |
Description |
Value |
Performance Implication |
|
True Negatives (TN) |
Number of correctly identified negative cases (Actual Negative, Predicted Negative). |
4,458 |
Indicates the model can identify some negative cases, but significant misclassification is evident due to low recall for negative classes. |
|
False Positives (FP) |
Number of incorrectly predicted positive cases (Actual Negative, Predicted Positive). |
35,000 |
High FP reflects overestimation of positive cases, leading to poor precision for negative predictions and inflating performance metrics for Class 5. |
|
False Negatives (FN) |
Number of incorrectly predicted negative cases (Actual Positive, Predicted Negative). |
7,789 |
High FN suggests the model struggles to identify positive cases correctly, particularly for intermediate classes (2, 3, and 4). |
|
True Positives (TP) |
Number of correctly identified positive cases (Actual Positive, Predicted Positive). |
2,221 |
Low TP highlights the model’s limited success in identifying true positives, particularly in Class 4. |
|
Accuracy |
Overall percentage of correctly classified cases. |
71% |
Shows reasonable performance overall, but the metric is influenced by the class imbalance and high prediction bias toward Class 5. |
|
Precision (Class 1) |
Proportion of true negatives among all predicted negatives (TN / (TN + FN)). |
50% |
Moderate precision for Class 1 indicates the model avoids some false positives but requires significant improvement for reliable negative predictions. |
|
Precision (Class 5) |
Proportion of true positives among all predicted positives (TP / (TP + FP)). |
75% |
High precision for Class 5 indicates the model reliably identifies positive cases with fewer false positives. |
|
Recall (Class 1) |
Proportion of actual negatives correctly predicted as negatives (TN / (TN + FP)). |
87% |
High recall for Class 1 reflects the model’s ability to correctly identify a majority of negative cases, boosting reliability for rejection tasks. |
|
Recall (Class 5) |
Proportion of actual positives correctly predicted as positives (TP / (TP + FN)). |
99% |
Excellent recall for Class 5 shows the model effectively captures most positive cases, but at the cost of ignoring intermediate classes. |
|
F1-Score (Class 1) |
Harmonic mean of precision and recall for Class 1. |
63% |
Moderate F1-score for negatives highlights the need for improvement in both precision and recall for these classes. |
|
F1-Score (Class 5) |
Harmonic mean of precision and recall for Class 5. |
85% |
Strong F1-score for positives reflects reliable predictions for the majority class. |
|
Macro Average F1 |
Average F1-score across all classes, giving equal weight to each class. |
30% |
Very low macro F1-score reveals the model’s poor performance in underrepresented classes. |
|
Weighted Average F1 |
F1-score averaged across classes, weighted by the number of samples in each class. |
60% |
Better performance on weighted F1 reflects the dominance of Class 5 but hides poor classification of intermediate and minority classes. |
The LSTM model achieved a 62 . 12% accuracy, showing decent performance overall but with significant limitations. The confusion matrix reveals a high number of false positives (35,000) and false negatives (7,789), indicating the model struggles to correctly classify many cases, particularly intermediate classes (2, 3, and 4). While the precision for the majority positive class (Class 5) is relatively high at 75% , the precision and recall for other classes are extremely low, with intermediate classes receiving zero scores. This highlights the model’s bias toward the dominant class and its inability to generalize across minority classes. The macro F1-score of 30% emphasizes this imbalance, whereas the weighted F1- score of 60% reflects the skewed class distribution. Despite steady decreases in training and validation losses, the model fails to perform well on unseen data for minority classes, suggesting overfitting to the majority class. To improve, ad- dressing class imbalance using techniques like oversampling or class-weight adjustments, refining the model architecture, and optimizing hyperparameters are critical. Additionally, enhancing data representation and using advanced evaluation metrics can help improve generalization and performance across all classes. Table 13.
Table 13. Accuracy Table
|
LSTM |
62.12% |
|
Normal Neural Network |
54.02% |
The experimental results from implementing two distinct neural network architectures show a marked improvement in the accuracy of consumer feedback text scoring.
Our findings highlight the effectiveness of LSTM for emotion detection in small, noisy datasets where, transformer models often overfit. Advanced preprocessing addressed challenges like emojis and informal language, ensuring robust performance. LSTM’s ability to model long-term dependencies and its scalability make it a practical choice for resource-constrained applications, demonstrating its suitability for this task.
The experimental results from implementing two distinct neural network architectures show a marked improvement in the accuracy of consumer feedback text scoring. Analysis of the training and validation loss curves indicates effective minimization of loss across epochs, demonstrating a robust learning process. Importantly, the validation loss reached a plateau after several epochs, suggesting that the models generalized well to unseen data without overfitting.
The incorporation of LSTM layers proved crucial in capturing temporal dependencies within the text data, resulting in improved predictions. Specifically, the LSTM model achieved an accuracy of 62 . 12%, surpassing the standard neural network, which obtained an accuracy of 54 . 02%. Moreover, the continuous decrease in Mean Absolute Error (MAE) over the epochs further demonstrates the models’ capability to align predictions closely with actual consumer feedback scores. These findings highlight the potential of advanced neural network architectures, particularly LSTMs. Consequently, the analysis demonstrated that the LSTM neural network produced better results.
5. Conclusion
This study explored the use of two types of neural networks, particularly Long Short-Term Memory (LSTM), for predicting sentiment scores from consumer feedback text. The dataset, comprising over five million entries, demonstrated the effectiveness of LSTM in extracting emotional insights from textual data. However, future work should investigate hybrid models that combine LSTM with advanced architectures such as BERT or GPT to capture more complex emotional nuances and improve sentiment analysis accuracy. Expanding the research to multiple languages would enhance the model’s applicability across regions, while also addressing cultural variations in language use. The study also highlighted challenges in processing features like sarcasm, unclear language, and incomplete sentences, emphasizing the need for techniques that improve contextual understanding and handle such subtleties. Additionally, addressing informal language, including emojis, slang, and non-standard text forms, is critical for enhancing model accuracy. Conducted using Python 3 and Google Colab, the experiment involved optimizing hyperparameters like batch size and epochs, although issues with infinite loops due to iteration settings were noted. Overall, the findings underscore the potential of neural networks, particularly LSTM, in automating sentiment analysis, while suggesting that future research should focus on hybrid models, multilingual datasets, and techniques for handling complex language challenges.
