Hybrid Intelligent Agent-Based Internal Analysis Architecture for CRM Strategy Planning

Author: Mosahar Tarimoradi, M. H. Fazel Zarandi, I. B. Türkşen
Journal: International Journal of Intelligent Systems and Applications(IJISA) @ijisa
Article in issue: 6 vol.6, 2014.
Free access
Nowadays attaining the general and comprehensive information about customers by means of traditional methods is difficult for CEO's because of the agility and complexity of organizations. So they spend a considerable time to gather and analyze the market data and consider it according to the organization's strategy. Presenting a useful architecture that capable to diagnose the organization's advantages and disadvantages, and identify the attainable competitive advantages are the main goals of this paper. The output of such architecture can be a general exhibition of company that prepares a clear and on time comprehensive view for CEO's.
Intelligent Agent, Customer Relationship Management, Internal Analysis, Competitive Advantage, Core Competency, Resource-Base View
Short address: https://sciup.org/15010564
IDR: 15010564
Text of the scientific article Hybrid Intelligent Agent-Based Internal Analysis Architecture for CRM Strategy Planning
Published Online May 2014 in MECS
As a part of the analysis process and organizational strengths and weaknesses identification, company's internal analysis plays an influential role in organizational strategy planning. Pursuing the market opportunities should not just solely be rest on their existence but it has to be based on core competencies within the organization [6] . Many authors recently have adopted new approaches so that organizations can use their internal resources more efficiently [7] . There are some vital elements for this strategy to play effective and efficient role in the performance of organization. First, it is consistency between competitive environment and special use of clear opportunities and minimizing the impact of the major threats. Second, it is that strategic plan should have a clear image from internal resources and capabilities according to the company's realistic needs [8] . What asserted in this paper is the second one:
"Realistic strategy analysis about organization's internal capabilities"
As a basis for strategy, internal analysis has to extract the organizational strengths and weaknesses by means of human and artificial intelligence using tools in statistics and computer science. Ignorance of well-defined mission and vision during attaining the company's strengths and weaknesses leads to a critical idleness in time and budget. The idea of company strategic consideration from the viewpoint of available resources and capabilities for competitive and key advantage achievement is the basis of many articles in the strategic planning context which at first was presented by Barney, Wright [9].A systematic approach for internal analysis and extracting useful knowledge for CRM strategy are the aim of this paper. The output of considered architecture can be scattered as a general picture of organization that such a sharp imagination can help CEO's separately to achieve a comprehensive understanding from the situation of their company in every moment. The goal of such a program is to prepare a system that can explain circumstances in the scale of Key Performance Indicator (KPi) [10].
The rest of this paper is organized as follows: In section II the CRM prevalent definitions and main 6 data-oriented models are considered separately. In section III an overview on intelligent agents and their roles in organizational internal analysis is discussed briefly. The main architecture, it's components and procedures, it's agents description, and message passing mechanism are explained according to a credible methodology in section IV. In section V the verification and validation of the proposed architecture are considered. In section VI a case study of the CRM strategy planning is considered according to the proposed architecture in an insurance company to illustrate how it is working approximately. Finally, some conclusions and guidelines for future study are provided in section VI.
-
II. Background
C ustomer R elationship M anagement (CRM) is based on the relational marketing principles and stems from creating a valuable connection between both parties, i.e. consumers and producers. What have changed recently are tendencies in creating opportunities in the customer services area by means of information systems [1] .
Traditional marketing strategies focused on 7 P concepts ( P rofiling, P ersistency, P rofitability, P erformance, P rospecting, P roduct, and P romotion) that are used for market share increment. Their primary attention is to increase the volume of transactions between sellers and buyers as their main criteria in marketing tactics and sales strategies.
Whilst CRM is a type of business strategy that goes beyond the trading volume and its aim is to increase profitability, revenue, and customer's satisfaction. For such a goal accomplishment, companies use a wide range of tools, procedures, methods and relationships with their customers [9] . Customer's satisfaction is definable in three levels:
-
• Customer's Satisfaction - The products / services
customers expect to achieve is satisfied.
-
• Customer's Impression - Customer's expectation is lower than satisfaction gained from the products/services.
-
• Customer's Dissatisfaction - The products / services customers expect to achieve is unsatisfied.
Good relationship with individual customers can eventually lead to improving customer's loyalty, survival, and profitability [1] . As presented in Fig. 1, company’s evolutionary growth pass in a transition through transactional marketing into relationship marketing during the time and its clear desires changed from attracting the customers with functional approaches to customer retention with the cross-functional approaches.
Emphasis on all market domains and customers retention
Emphasis on customers acquisition
Relationship
Marketing
Transactional Marketing
Functionalbased Marketing
CrossFunctionalbased Marketing
Fig. 1. Transformation of Traditional Marketing (Transaction) to a Relational Marketing (Relationship) [1]
SME1 s are welcomed for two reasons; the first reason is that such a new approach has to found restrictions in traditional marketing strategies and potential-driven process with concentrating on the customer's identification, and the second reason is that new technologies have cherished companies for the market segments/sub-segments selection [1] .
-
A. CRM Definitions and Competitive Advantage
Albeit the CRM has been almost identified as a business approach, but finding an accepted academic definition maybe somehow uphill. Among the offered definitions for the CRM, differentiation stems from the definer points of view. Somebody consider CRM as a strategy, some as a technology, some as a process, and even some consider it as a contextual information system. All in all, every presented CRM definition can be considered from the two points of view:
V Emphasizing on the Functional Approach to Marketing - This approach has focused on units rather than being focused on the market, since these units are looking for optimizing their inputs and setting the budget accordingly, rather than optimizing their output and focus on market share [1] .
V Emphasizing on the Maintaining Customers Profitable - This approach has focused on decisions that maximize the profit of CLV 2 [1] :
"Loyal customer is an invisible capital that makes company's balance sheet sound"
Some of noticeable definitions that can be referred to are [11] , [12] , [13] , [14] , [15] , & [16] . Proposed definitions by Barnett and Barr have more integrity in comparison with others:
V Barnett - CRM is a term for a set of methodologies, processes, softwares, and systems that helps institutions and companies for an effective management in organizational communication with their customers [12] .
V Swfit - CRM is an organizational approach to diagnose and influence on the customer's behavior by making meaningful connections to improve the customer's request, retention, loyalty, and profitability [2] .
More complete dimension of founded subject in these definitions mainly refers to the methods and methodologies that deal with the organizational policies about the customers on the one hand and leading to the side of the customer's behavior and company products related to these policies on the other hand.
Competitive Advantage that is asserted in both contexts of strategy planning and CRM is a human system that uses the well-organized technology under the effect of corporate culture to create an output that can lead to organizational supremacy [17] . Almost no concept of strategy like the competitive advantage which presented by Prahalad and Hamel is cited in the nineties [8] . Both authors have asserted on the strategic approaches that use SBU 3 to form competition-oriented administration. The combination of different competitive advantages enables company to produce core products that are based on final products in single business units [8] ,and advantage may contain four elements of technology, human resource, organization, and culture . The distinction between a special capability and competitive advantage is difficult and a competitive advantage has to satisfy three conditions principally:
V Value Creation for Customers - Should enables companies to create substantial value for customers.
This issue has no relation with knowing which advantage causes such a value [18] .
V Differentiation with the Competitors- That the company needs to be unique in the competitive environment i.e. dominant advantage in competition domain.
V Upgrade and Changeability- Competitive advantage need to an independent view that prevents focusing on products and leads to clear replaceable alternative.
Each person considers his duties as a competitive advantage for organization. Such a belief leads to a long list that has to be reduced and assayed by the three mentioned criteria. Generally, it will be needed to a competitive advantage list with limited members between 5 to15 [8]. By defining and evaluating the existing competitive advantages, it is time to create new ones. A traditional quadratic-field portfolio between market and competitive advantage can be considered as Fig. 2.
What has new competitive advantage needed to make our market position guarantied or even expand ?
How use the existing competitive advantages for market position improvement ?
Available
Which competitive advantages should be created to penetrate or for better position in the future markets ?
What new products or services could be defined in the result of competitive advantage combination ?
New
Market
Fig. 2. Portfolio of Competitive Advantage [19]
-
B. CRM Posed Models
For attaining the CRM strategic goals , the clearly documented procedures in terms of model will be needed . There exist seven major models for CRM formulation and implementation which described briefly in following:
-
1) ACURA
ACURA model is a framework for revision in profitable opportunities . Cyclic successive stages of ACURA including Acquire, Cross-sell, Upsell, Retain, and Advocacy presented in Fig. 3. Companies have to consider the customer's desires in their planning period that may they be looking to buy other products ( CrossSelling ) or more units of a product ( Upselling ), or even tend to buy from a range of suppliers.
As seems the basic steps for ACURA implementation framework are:
V Determining the main market segments with their specifications ( 2 to 4 segments with the potential of long-term profitability).
V Selecting ACURA specific strategies.
V Determining the Kpi4 for each segment and their potential in overall profitability.
V Determining the CSF 5 for required investment to implement CRM strategy [20] .
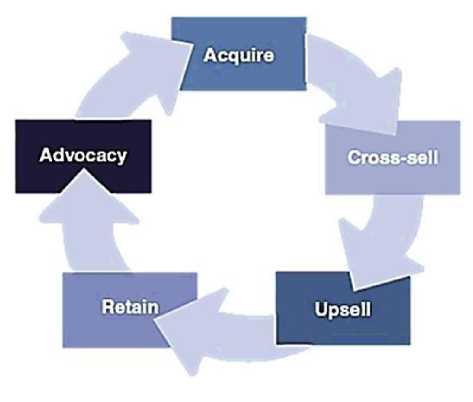
Fig. 3. The Customer Relationship Stages in the ACURA Model [1]
-
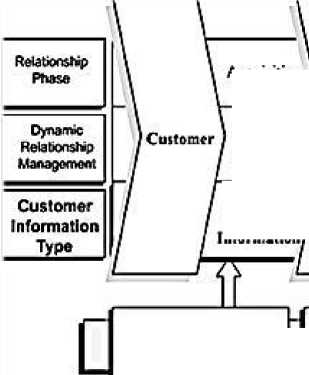
2) Dynamic CRM
In this model, three phases of beginning (acquisition), analysis (retention), and stable communication (consolidation) proposed as the basic stages of the CRM . Cause of types of interaction, customer's information could be divided into below [5] :
V Information from Customer's Buying Process6 -
Including customer's personal data and gathered data from their transactions with the organization.
V Prepared Information for the Customers 7 -Including information for their more rational decision.
V Gathered Information by the Customers 8 -
Including customer's feedback to the organization.
As exposed in Fig. 4 , organization collects and store information from their transactions with the customers at the first interaction. Next, they evaluate the communication value for more effective CRM (in two dimensions of customer's value from their own point of view and customer's marginal profit from organization's point of view). It has to be notified for a consolidated relation that if the customers sense the lack of balance in relation, he/she tries to somehow way out the trade-off, otherwise usually tries to break it. By stabling a proper relation, one could to manage the CLV in a way that organization fair in their communication strategies [1] :
" Maximizing customer's profitability for the organization to measure customer's value "
Transaction data Personal data
Acquisition
Retention
Expansion
Relationship / identified 1 Relationship ] Core \ Relationship Initiation Customer/ value Analysis Customer/ positioning
Of-the-Cuilomrr Information,
For-the-Cuitomcr Information
By-the-Customcr Information
Transactional Commitment
Non-transactional
Commitment j

Relationship data
Product data
Feedback data
Monitoring data
Fig. 4. Process Components of Dynamic CRM Model [5]
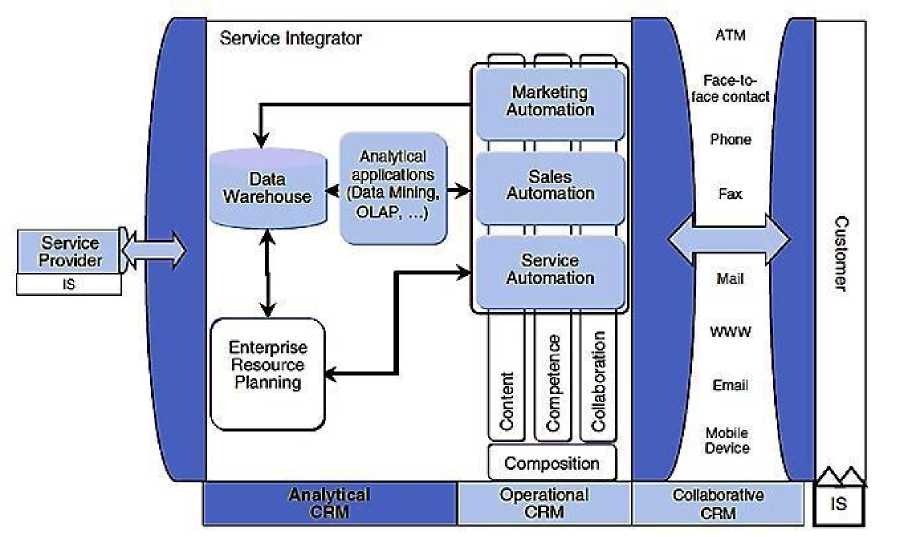
Fig. 5. CRM Closed Cycle [3]
-
3) CRM Data Circulation
In this model obtained data from various resources are used for the three aims of gathering, storage, and analysis. CRM makes a closed cycle up in the mentioned aims that primarily considers the current trends and technical aspects, but ignores the raised system processes that associated with the CRM implicit or explicit knowledge [1] .
As shown in Fig. 5, according to the emphasis of this model to have a data-oriented view to the CRM processes, the pivotal advantage of knowledge engineering in relation with customers should be considered. In this model, the importance of knowledge engineering is in guiding and managing the created knowledge in the phase of customer's relation [1] .
-
4) CRM Performance Evaluation (BSC-based)
For CRM performance evaluation a tool that is nondominated to the mentioned critiques will be needed. BSC 9 is a good way to evaluate CRM because the model of this approach:
^ Makes evaluation of management activities possible by considering both tangible and intangible aspects with a disinterested view [21] .
^ Includes an integrated domain of technology and business [22] .
^ Evaluates customer's satisfaction (in the E
C ommerce specially) [22] .
V Helps developer to do an integrated assessment about CRM performance by considering objective or subjective goals and thus could be considered as a goal-oriented system [23] .
V Is a pragmatic system for business performance monitoring and refinement [21] .
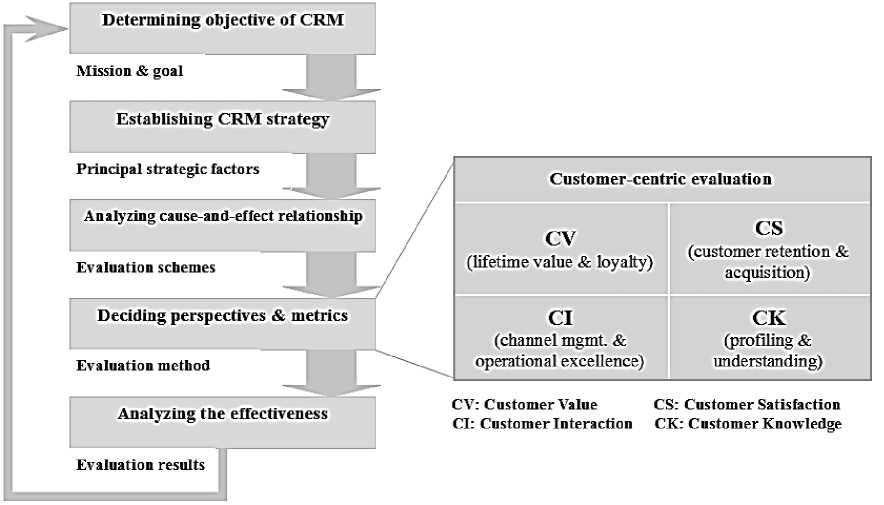
Fig. 6. CRM Evaluation Model Based on BSC [4]
As shown Fig. 6, the CRM evaluation is an iterative process with the efficiency orientation . Determining the CRM goals and targets is the first step, and CRM strategy development is the next step that aims to explore the strategic factors. After that, it is time to find the inner relationship between CRM activities and business goals for next step . Relationship analysis helps one to find out what should be done to give better output and what kind of targets are important for attaining the planned outputs. Such an evaluation prepares a deep understanding about the CRM strategy.
-
5) Swfit
As mentioned before, Swfit identifies CRM as a continuous learning process that data from each customer's convert for a relationship analysis [2] . Swfit CRM closed-loop cycle contains the following steps (Fig. 7):

Fig. 7. CRM Process Cycle in Swfit Model [2]
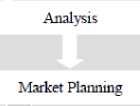
V Knowledge Discovery - Data storage that designed and implemented for customers and organization is the first needed issue for knowledge discovery [9] .
V Analysis - including the analysis and evaluation about interaction with customers [9] .
V Market Planning - Including the assessment and decision about how to pierce to the market segments. The major activities including market planning, production planning, marketing and communications planning should be considered for this step [2] .
V Interaction with the Customers - Active and efficient interaction with the customers absolutely depends on the culture of industry and especially customer's desires [9]
-
6) Payne
Five cross-functional CRM processes intended in this model. The result of a consideration including interviewing and discussion with executive managers from different level of industry, defines some of key processes [1] :
V Strategy Formulation Process - CRM evaluation strategy matrix used for assessment of such a process (Fig. 8).
V Value Creation Process - Containing basic tree elements of received value from the customers, created value for the customers by organization and promotion of customer's desired value through their CLV by an appropriate management.
-
V Multi-Channel Integration Process.
V Information Management Process - Collecting and comparing obtained information from the relationship with customers and use it to build the customer's profile.
V Performance Evaluation Process - This process has focused on the two issues: S takeholder's G aining (macro view to the CRM key performance) and P erformance M onitoring (including more detailed and describer view to CRM key performance). Four elements that have influence on the stakeholder's gaining are employee value creation, customer's value, shareholder value creation, and cost reduction. Fig. 9 shows the relationship between these four elements.
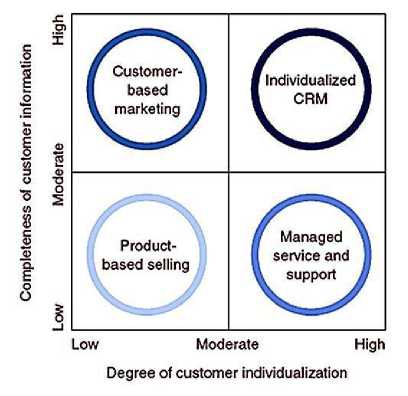
Fig. 8. Evaluation CRM Strategy Matrix [1]
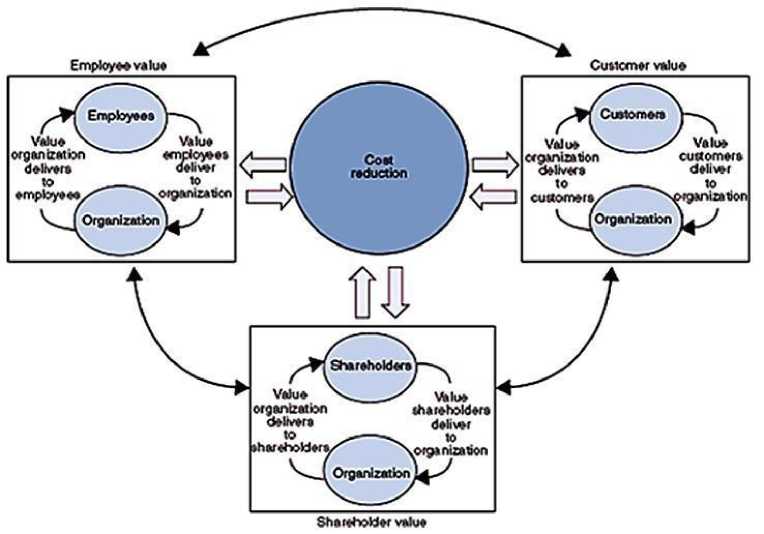
Fig. 9. Main Elements for Shareholders Gain Analysis [1]
CEO
|
Marketing and sales |
Finance |
Human resources |
Information technology |
Operations |
Strategy development process
Value creation process
Multi-channel integration process
Information management process
Performance assessment process
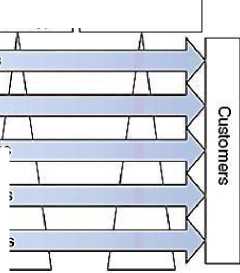
Fig. 10. Structured Units Between the Functional Approaches [1]
Strategy development process:
Sales force
Performance assessment process:
Value creation process:
Multi-channel integration process:
Business strategy
• Business vision
• Industry and competitive characteristics
Customer strategy
• Customer choice and customer characteristics
•Segment granularity
Shareholder results
Employee value Customer value Shareholder value
• Cost reduction
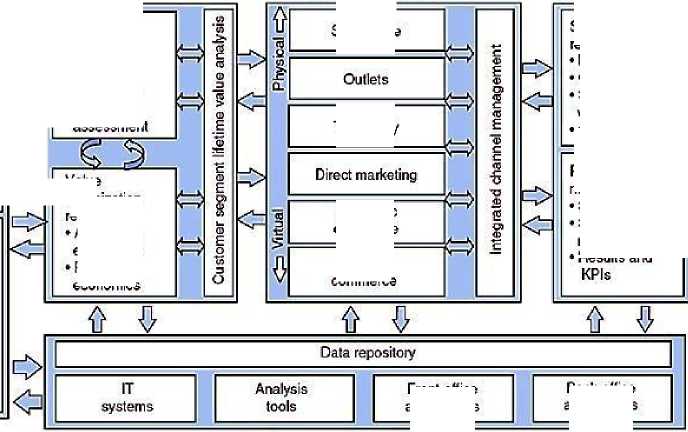
Information management process
Front-on ice applications
Back-olfice applications
Fig. 11. CRM Framework According to the Payne Model [1]
Value customer receives
-
• Value proposition
-
• Value assessment
Value organization receives
Acquisition economics Retention economics
Telephony
Electronic commerce
Mobile commerce
Performance monitoring
Standards Satisfaction measurement
• Results and
Other necessary elements of this process are standards, criteria, and KPi10 preparation. Some of standards such as CMAT 11 from QCi , and COPC12 which introduced by Dell , Microsoft , Novel and American Express are noteworthy [1] . Five mentioned processes shown in Fig. 10 and as noted for this approach they are obviously customer-based.
Strategic framework in the basis of five mentioned cross-functional process combination of this model exposed in Fig. 11.
The arrows represent the feedback interaction cycles between different processes and punctuate CRM dynamic nature.
-
III. Intelligent Agents
An agent is a computer system that situated in some environment, and that is capable of autonomous action in this environment in order to meet its designed objectives [24] . Agent Intelligence depends on the suitability of its response to environmental conditions, which led to the present four key properties as the criteria for their Intelligence, i.e. autonomy, social ability, reactive, and proactive [25] .
Agents tend to be used where the environment is challenging; more specifically, typical agent environments are dynamic, unpredictable and unreliable [26]. These environments are dynamic and change rapidly i.e. the agent cannot assume the environment to remain static while it is trying to achieve a goal. These environments are unpredictable that it is impossible to predict the future states of the environment; often this is because it is not possible for an agent to have perfect and complete information about their environment and because the environment is being modified in ways beyond the agent’s knowledge and influence [26]. Finally, these environments are unreliable in which the actions an agent can perform may fail for reasons that are out of an agent’s control.
-
A. Role in the Organizational Internal Analysis
As defined, datamining summarizes and analyzes the supervised data set (mainly huge) to find the missing relations in a useful and understandable way (knowledge) [27] . Relations and abstraction that extracted through datamining process often called models or patterns [28] . Examples of these patterns and models are linear equations, rules, clusters, graphs, tree structures, and recursive patterns in time series [29] . Datamining is closely associated with artificial intelligence and machine learning; thus, it could be said that database theory, artificial intelligence, machine learning are fused to provide an applied field in datamining [30] . In the literature of intelligent agents, a considerable part is concerned by the use of intelligent agents operating datamining techniques for inference and decision making processes relying on knowledge discovery [28] .
Main tasks of intelligent agents in an inter-organizational analysis are the understanding and finding the strengths and weaknesses of the organization's plan that guided in terms of mission and vision of strategy. In this way, the intelligent agent has to examine the organization's past and data-oriented approaches are powerful ways to extract the useful knowledge from past organizational data [26]. Finally, what is the measure of the intelligence operating in the internal analysis is detecting some output of dataminer module as a set of properties which is associated with the mission and vision [31] i.e. to identify what features within the organization is in line with the strategy and what is not [32].
-
IV. Proposed Architecture
As mentioned before, CRM is a cross-functional activity and its successful implementation seems to be very difficult or even impossible for one who seeks to focus on communication in the large organizations with millions of individual customers, without systematic and goal-oriented framework. Internal analysis that leads to a realistic understanding of issues that usually includes paradoxes, value assessments, abilities, and all of the factors that known as the organizational characteristics; so from this point of view it seems to be a difficult and controversial issue. Albeit to implement CRM , all of the organizational specific issues will be significantly different from other organizations; it is began with strategic planning and finally completed with the performance improvement [10] .
-
A. Components and Procedure
Some of the main component and procedure of the considered architecture are:
V Knowledge Generation - Main part of architecture evaluate the performance of the functional units and processes using the standards, KPi's and measures for a specified field of the strategy. The processing that carried this section out is a smart object since identifies selected strategy as main basis for considering the analysis with the strategic assessment synchronously. Results of this process may be appraised with user's feedback to specify which part of the gained knowledge is useful. Such a feedback is useful for a supervised learning excellence cycle. Analysis of gathered data within the organization leads to information that reflects the situation of organizational internal resources. Despite the embedding of this module in knowledge generation agent, what seems to be challenging about this agent is the aspect of intelligence that determines usability and importance of extracted knowledge.
V Goals and Indicators - For any goals ( G№ ), there are some substantial indicators which specify the company's situation in each of the defined goals .
V Weaknesses Extraction - Weaknesses report a series of adverse actions in strategy and in the format of a list of goals that are in their exigent condition for defined indicators.
V Extract the Effective and Efficient in Service Resource Strategies - Regarding to the assessment and selection of strategies, effective resources in each of these indicators are set . The criterion to determine the resources is a table that shows the percentage of resources to achieve the goals and previously developed by the senior managers and consultants/Experts.
V Goal and Resource Relationship and Influence of each Resource in the Goals - Effectiveness of each of the resources within the organization, subjects to the strategy goals reported as a table of goals and affective resources with their effectiveness for attaining the determined goal.
V Company's Features - Reviewing the quality of indicators shows which of them is in a good or even exigent condition. This could be exposed in a data processing summarized dashboard table. The output of this dashboard is the starting point for the process analysis [33] .
V Identifying Competitive Advantage - Competitive advantage directly related to the existing products/services; transferring this advantage to the other areas of business is a prevalent issue. By specifying the competitive advantage it needs to a merely view to prevent concentrating on the products and make possible alternative more clearly.
-
B. Hybrid Architecture
To propose a goal-oriented architecture there are various kinds of methodologies which help one to initialize his/her system step by step according to a logical procedure. One of these methodologies is Prometheus, which invoked for devising hybrid architecture that recognized as a credible methodology as discussed in continues. This methodology defines a detailed process for specifying, designing, implementing, and testing / debugging agent-based systems as follow:
-
1) Goals of the Architecture

Fig. 12. Architecture Goal Tree
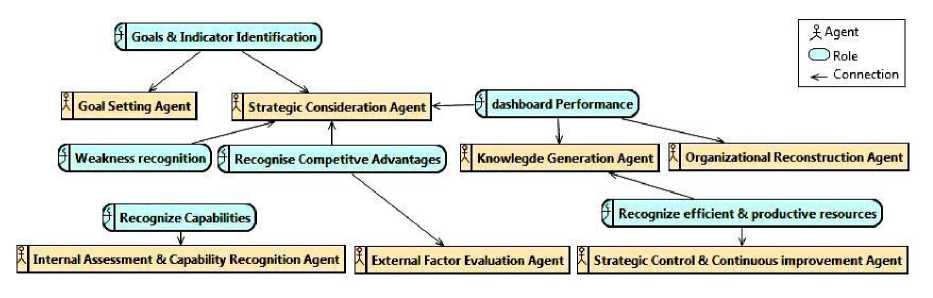
Fig. 13. Agent–Role Coupling Diagram
-
2) Roles of Architecture
-
3) Agents Description
The agents are coordinated cooperatively and execute the supervised tasks. Agents work together synchronically, apply mentioned roles, and strengthen the internal assessment by local decision making [8] . There are seven agent defined within the proposed architecture: "External Factor Evaluation", "Strategic Consideration", "Internal Assessment & Capability recognition", "Goal Setting", "Organizational reconstruction", "Knowledge Generation", and "Strategic Control & Continuous improvement". They are working in two embedded team means "Internal Analysis", and "Strategy Planning" (Fig. 14 and Fig. 15).
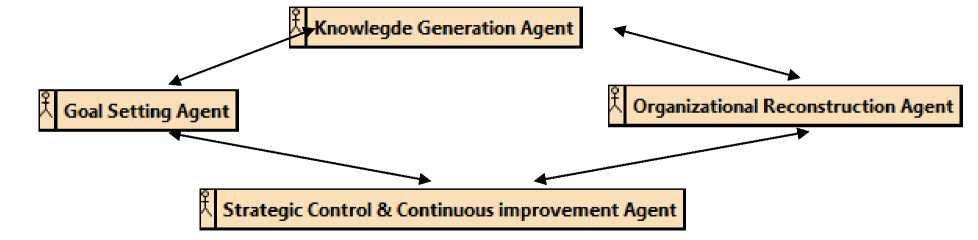
Fig. 14. Internal Analysis Team
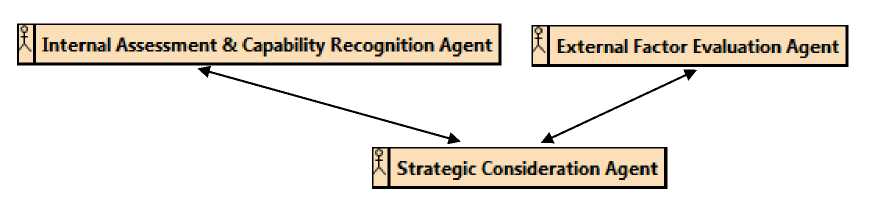
Fig. 15. Strategy Planning Team
-
a) External Factor Evaluation Agent (1)
It is responsible for the task of Environmental assessment. A host of external factors influences a firm’s choice of direction and action, and ultimately its organizational structure and internal processes [30]. The input information may be being complex for the architecture; it could be simplified by a quadric-layer data preprocessing architecture that hybridizes with the main architecture (Fig. 16). The first layer of this module is dedicated to define data structure (using expert knowledge to extract relevant data from external data sources and creating metadata and extracting intangibilities). The results of the first layer (Metadata) delivered to the second layer by the SendMD protocol. The second layer aimed to determine data structure (structured/semi-structured/non-structured) and store it in a Datamart. The results of this layer (Datamart) are delivered to the third layer by the SendDtM protocol. The third layer is aimed to overcome to the complexity roots and reduce it by SOM / FClustering (for structured data), Fuzzy Ontology (for semi-structured data), and Expert/Textmining tools (for non-structured data). The results of this layer (processed and simplified data) are delivered to the fourth layer by the SendPD protocol. The fourth layer makes prepared results integrated and provides a .cfg file that is usable for second agent.
-
b) Internal Assessment & Capability recognition Agent (2) This agent carries the task of internal analysis out.
Internal analysis has received increased attention in recent years as being a critical underpinning for effective strategic management [34] . Indeed many managers and writers have adopted a new perspective on understanding firm success based on how well the firm uses its internal resources of the firm base upon the RBV13 as mentioned before [35] . This intelligent agent concept examine the organizational internal resources according to the obtained data, interpreted past knowledge through datamining, and information borrowed from other intelligent agents especially "Strategic Control & Continuous improvement Agent" using RBV.
-
c) Strategic Consideration Agent (3)
It examines strategic analysis and choice in single – or dominant – product/service businesses by addressing on basic issues [30] :
-
1. What strategies are effective at building sustainable competitive advantages for single business units ?
-
2. What competitive strategy positions most a business effectively attain to in its industry ?
-
3. Should dominant diversified businesses
-
4. What grand strategies are the most appropriate ?
product / service to build value and competitive advantage ?
This agent deals with the internal variables and external forces to set standards and propose revised strategies. External environment could be divided into three interrelated subcategories for this agent:
"Factors in the remote environment, factors in the industry environment, and factors in the operating environment"
This intelligent agent exploits these factors and the complex necessities are involved in formulating strategies that optimize firm’s market opportunities.
-
d) Goal Setting Agent (4)
Organizational goals are set based on the analysis of stakeholders’ requirements, which considered in strategic plan. This agent is responsible for setting the goals and their assessment indicator.
-
e) Organizational Reconstruction Agent (5)
This agent is responsible for the triple tasks of restructuring, reengineering, and refocusing the organization. In fact, it distinguishes the necessary activities regarding to each of them [36] according to the delivered message from "Strategic Consideration Agent".
-
f) Knowledge Generation Agent (6)
In this way, a pool of KPi s forms and intelligent component of the architecture selects the high-related set to the strategy. Choosing such a set could be done by the means of artificial intelligence tools such as N eural N etwork, Feature Selection, Decision Tree, and other methods that are used to determine the relationship.
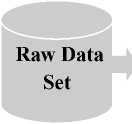
1 st Layer
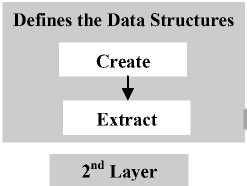
Data Structure
Data Type Determination

Create Structured
SendDtM Protocol
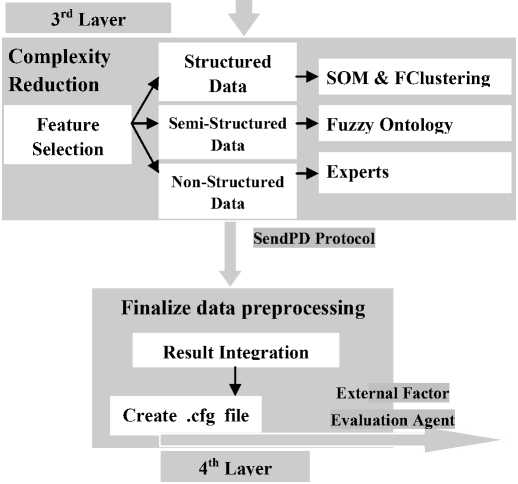
Fig. 16. Quadric-Layer Data Preprocessing Architecture
-
g) Strategic Control & Continuous Improvement Agent (7)
The rapid, accelerating change of the global marketplace has made continuous improvement another aspect of strategic control in many business organizations. Synonymous with the total quality movement, continuous improvement provides a way for the organizations to provide strategic control that allows the organization to respond more proactively and timely to rapid developments in hundreds. As considered in the architecture it is in a powerful relation with "Goal Setting
Agent". It is clear that strategies are forward looking, designed to accomplish several years into the future, and based on management assumptions about numerous events that have not occurred yet. Therefore, this intelligent agent performs strategy control and improves the situation continually for the sake of the organization uses agent-based CRM . This agent does the duty of control subject to the performance dashboard and adopted strategies.
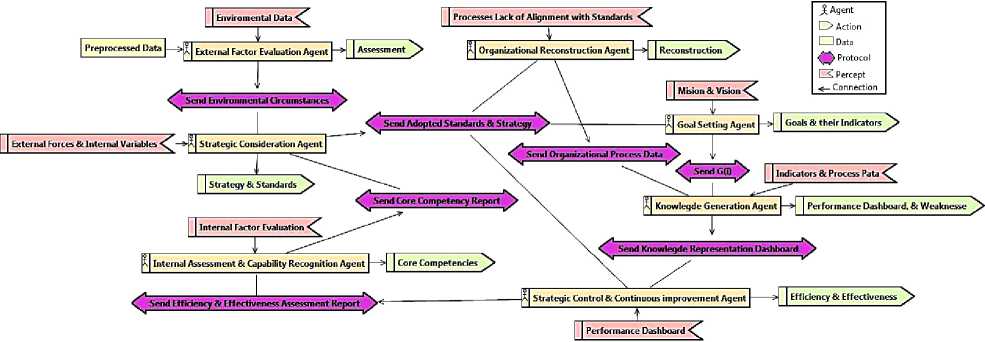
Fig. 17. Overview of Main Architecture
-
4) Agents Negotiation
Let's consider the described agents negotiation. Table 1 explains the message passing between agents. What is noteworthy here is that Sender and Receiver agents specified by the assigned number in last section.
Table I. Message Passing Between Agents
|
Sender |
Receiver |
Message Type |
Message task |
Content |
Deadline |
|
(1) |
(3) |
Announcement |
Receive Environmental State |
External Forces |
Time by which the (3) must respond with a bid |
|
(2) |
(3) |
Announcement |
Receive Internal Variables |
Core Competencies |
Time by which the (3) must respond with a bid |
|
(7) |
(2) |
Announcement |
Receive Efficiency and Effectiveness |
Efficiency and Effectiveness |
Time by which the (2) must respond with a bid |
|
(4) |
(6) |
Announcement |
Receive G (i) |
G (i) |
Time by which the (6) must respond with a bid |
|
(5) |
(6) |
Announcement |
Receive Process Data |
Process Data |
Time by which the (6) must respond with a bid |
|
(4) |
(7) |
Announcement |
Receive Dashboard Report |
Performance Dashboard |
Time by which the (7) must respond with a bid |
|
(3) |
(4) |
Bid |
Check Standards and Strategies |
Standards |
Time by which (4) must respond with either a contract or a review of the bid |
|
(3) |
(5) |
Bid |
Check Standards and Strategies |
Strategies |
Time by which the (5) must respond with either a contract or a review of the bid |
|
(3) |
(7) |
Bid |
Check Standards and Strategies |
Strategies |
Time by which the (7) must respond with either a contract or a review of the bid |
For clearing the considered protocol types and performance, a sample that based on Plan/Commit/Execute (PCE in abbreviation) negotiation protocol described that originally developed for agent cooperation system [37]. This protocol is suitable for systems that the commitment of resources and execution of a plan require separated communication phases. The extension of the protocol with reject proposal message is used for canceling unsatisfactory proposals is the most significant change [38]. The protocol of "Send Adopted
Standards & Strategies" which plays a key role in message passing between numerous agents has presented in Fig. 18.
External Factor Evaluation
Strategic Consideration
ADOPTION
Internal Variables
External Forces
Consideration
Adoption Results

Notation
Fig. 18. Protocol of Adopted Standards and Strategies
-
V. Case Study: CRM Strategy In Sina Insurance Co.
Sina insurance Co. as a company in a competitive market of Iran needs to have a special look into the customers. Company has taken capillary selling strategy. Now with more than 60,000 loyal customers in all over the country, and with more than 15 types of insurance services ( LOB14 ), procure the main insurance portfolio services. Their strategic vision in the CRM exposed in the below statement:
"Attaining the First Place in Customer's Satisfaction and Product Quality in the Iran Insurance Industry"
Company's aim is gaining the more market share of insurance services. This faces important challenges because of different customers in different market segments and geographic breadth of Iran. The organization has concentrated on current involving customers as a strategy to increase their value and loyalty. Now let to review the architecture components for case study:
-
A. Knowledge Generation
Data of the sale and marketing is stored in databases and is annually available. There is a structured process for data analysis and reporting, so one encountered with the predetermined CRM indicators (data management is not the well usual). In addition to the mentioned indicators, some others proposed by R&D administrator. Table 2 shows the list of the selected indicators. The output of knowledge generator set by these indicators, which presented in the form of a performance dashboard for senior managers.
Table II. Output of Selected Indicators for Knowledge Generator Section
Indicators
Annual quantity of customer's order
Average amount of returned insurance policy
Average amount of each insurance policy
Rate of customers who own more than 5 types of LOB
Annual Customers Lost of Rate
Rates of new customers attraction
CLV average
Distance between service presentation and branch office
Number of fully satisfied requests
Rate of returned insurance policy
Customer's marginal profit
Impact of Price Variation on Demand
Time interval between two customers
Percent of customers who buy more than 5 types services into whole
Finally, indicators presented as a performance efficiency dashboard to the CEO15's by processing on transactional data [17] .
Colors applied to present the quality circumstance (in shade format) in this way. Green, yellow, orange, and red are represent excellent/good, medium, weak, critical/exigent conditions respectively (Table 3).
14 Line Of Business
-
B. Goals Circumstance Analyst (Prosperity Analyzer)
23.4 Ratio of Loyal Customer into Whole
As it seems in the performance dashboard, fundamental goals of the selected strategy, means CRM, are categorized in four levels of customer's value, customer's retention, customer's loyalty, and customer's satisfaction. Their circumstances are abstracted in Table 4.
Table III. Performance Dashboard Module, Output of Knowledge Generator
|
Customer Relationship Management |
|||
|
Satisfaction |
Loyalty |
Retention |
Value |
|
Delivery Performances (by date) |
Customer's Rate of Lost |
Customers Lost of Rate |
Total Price of Customer's Order |
|
265 , Days Annually in Average |
16% , Annually in Average |
14% , Annually in Average |
230$ , Signed Insurance Policy Annually in Average per customer |
||||||||
|
Orders Fulfilled Perfect |
Impact of Price Variation on Demand |
Rate of New Customer |
Return Price |
||||||||
|
80% , Signed Insurance Policies Pay in Cash |
2% , Price Elasticity of Major Services |
13000 (21%) Annually |
34$ , Annually each Customer in average |
||||||||
|
Return Rate |
Rate of Customer Order |
Customer's Life Duration |
Factor Price |
||||||||
|
4.5% , Annually in Average |
Ordering each 210 Days |
3.45 Year, for each Customer in Average |
15$ , Price of each Insurance Policy in average |
||||||||
Marginal Profit Value of Loyal Customer
12% , Profit of each Customer in Average
Table IV. CRM Goals and Related Indicators with the Percent Importance Index
|
Goal |
Indicator |
Percent of Importance Index |
|
Annual quantity of customer's order |
30 |
|
|
Customer's |
Average amount of returned insurance policy |
25 |
|
Value |
Average amount of each insurance policy |
30 |
|
Ratio of customers who own more than 5 types of LOB |
15 |
|
|
Customer's Retention |
Annual Customers Rate of Lost Rates of new customers attraction |
30 35 |
|
CLV average |
35 |
|
|
Distance between service presentation and branch office |
30 |
|
|
Customer's Satisfaction |
Number of fully satisfied requests |
20 |
|
Rate of returned insurance policy |
20 |
|
|
Customer's marginal profit |
30 |
|
|
Impact of Price Variation on Demand |
30 |
|
|
Customer's Loyalty |
Time interval between two customers Percent of customers who buy more than 5 types services into whole |
35 35 |
Table V. Quality Intervals of Defined Indicators
|
Yields Indicator |
Exigent |
Weak |
Average |
Good |
Well |
1 |
||||||
|
Excellent |
||||||||||||
|
From |
to |
From |
to |
From |
to |
From |
To |
From |
to |
From |
to |
|
|
Distance between service presentation and branch office |
6 |
10 |
4 |
6 |
3 |
4 |
2 |
3 |
2 |
2 |
0 |
2 |
|
Annual Customers Rate of Lost |
10 |
30 |
7 |
10 |
4 |
6 |
2 |
4 |
1 |
2 |
0 |
1 |
|
Annual quantity of customer's order (services) |
0 |
2 |
3 |
4 |
5 |
7 |
8 |
11 |
12 |
13 |
14 |
15 |
|
Number of fully satisfied requests |
0 |
50 |
50 |
60 |
60 |
80 |
80 |
90 |
90 |
95 |
95 |
100 |
|
Impact of Price Variation on Demand |
-10 |
-100 |
-8 |
-10 |
-6 |
-8 |
-4 |
-6 |
-2 |
-4 |
0 |
-2 |
|
Rates of new customers attraction |
0 |
1 |
1 |
3 |
3 |
5 |
5 |
7 |
7 |
10 |
15 |
20 |
|
Rate of returned insurance policy |
20 |
100 |
10 |
20 |
5 |
10 |
3 |
5 |
1 |
3 |
0 |
1 |
|
Time interval between two customers |
50 |
100 |
35 |
50 |
30 |
35 |
23 |
30 |
21 |
23 |
19 |
21 |
|
Average amount of returned insurance policy |
100 |
100 |
70 |
100 |
50 |
70 |
20 |
50 |
10 |
20 |
0 |
10 |
|
CLV average |
0 |
1 |
1 |
3 |
3 |
7 |
7 |
10 |
10 |
20 |
20 |
50 |
|
Average amount of each insurance policy |
0 |
100 |
100 |
200 |
200 |
300 |
300 |
400 |
400 |
500 |
500 |
1000 |
|
Customer marginal profit |
0 |
8 |
8 |
12 |
12 |
15 |
15 |
17 |
17 |
20 |
20 |
25 |
|
Rate of customers who own more than 5 types of LOB |
0 |
2 |
2 |
10 |
10 |
20 |
20 |
50 |
50 |
70 |
70 |
100 |
|
Percent of customers who buy more than 5 types services into whole |
0 |
2 |
2 |
10 |
10 |
20 |
20 |
50 |
50 |
70 |
70 |
100 |
Table VI. Situation of Organization in each Indicator
|
Indicator |
|||||
|
Current Situation |
Qualitative State |
Dimension |
|||
|
Rates of new customers attraction |
17 |
Excellent |
Percent |
||
|
Time interval between two customer |
21 |
well |
Day |
||
|
Distance between service presentation and branch office |
2.3 |
Good |
|||
|
Rate of returned insurance policy |
3 |
Percent |
|||
|
Impact of Price Variation on Demand |
-2 |
||||
|
Annual Customers Rate of Lost |
10 |
||||
|
Percent of Customers who buy more than 5 types services into whole |
23.4 |
||||
|
Average amount of returned insurance policy |
34 |
$ |
|||
|
Number fully satisfied requests |
80 |
Average |
Percent |
||
|
CLV average |
3.45 |
Year |
|||
|
Customer marginal profit |
12 |
Weak |
Percent |
||
|
Ratio of customers who own more than 5 types of LOB |
4.3 |
||||
|
Average amount of each insurance policy |
165 |
$ |
|||
|
Annual quantity of customer's order |
2 |
Exigent |
|||
-
C. Quality Intervals for Defined Indicators
With the goals and related indicators, qualitative range of each indicator should be determined. What has shown in Table 5 is the range of quality circumstances expected by senior managers in each of the indicators.
According to the exposed tables, now prosperity analyzer section enables to determine the quality circumstances for each of the identified attained goal. Table 6 presents the quality status of each of the indicators in the company.
-
D. Weakness Extraction
Another task of the prosperity analyzer section is to extract weaknesses as the exigent or critical situations. Weaknesses are the benchmarking between current state of indicators and CEO's idea about favorable situation . These cases reported as a series of adverse actions on the implementation strategy. According to the Table 6 , critical and weakness indicators are:
V Ratio of customers who own more than 5 types of LOB .
V Customer's marginal profit.
V Annual quantity of Customer's order.
V Average amount of each insurance policy.
Finally, Table 7 could be achieved through the method that attained the quality of each specified goals. Quality circumstance for each goal is the accumulation of defined qualitative indicators for each of them .
Table VII. Quality Status in each of the Goals (output of 2nd agent)
Quality status

Weak
Customer's Value
Average
Customer's Satisfaction
Customer's Retention
Good
Customer's Loyalty
-
E. Efficiency and Effectiveness Assessment
Interactively the first three important parts of the table have chosen as main influential resources for determined indicators.
-
1) Efficiency and Productivity of each Resources
By clearing the affective resources subject to the indicators, now it is time to determine their productivity/efficiency. Productivity could be discussed from two points of view: means financial and time perspective. Productivity or financial performance and return on investment ( ROI ), consider the appropriate use of financial resources, and Time productivity argues minimizing the time taken for a process [8] . Such an activity needs to devise an analysis of the processes and resources efficiency strategy but unfortunately there is no integrated document in the Sina company and just experts' idea have been invoked for this. The most influential resources on the productivity have summarized in the Table 9.
-
2) Capability Extraction
Performed analysis according to the efficiency and effectiveness modules using fourth and seventh agents shows the intersection point of company resources that has been considered as capabilities by efficiency and effectiveness criteria. Asserting to the mentioned four main goals of CRM, those indicators, which are higher in quality, selected as effective indicators (Table 10).
By recognition of the evaluated criteria and regards to the Payne CRM model, effective resources in each of the indicators have to be determined. For attaining such an issue (most important influencing resources and its performance), there is a comprehensive list which has been developed by CEO's and their consultants. Table 11 presents a summary of procedures to attain the organization's capabilities (resources that are in the strategy services efficiently and effectively).
The selling process of the company because of its diversity across the country and its geographical coverage provides a noteworthy market share, which presents the puissance of Sales and Marketing deputy, include selling capillary networks with more than 60 thousand delegates.
Table VIII. Importance of Indicators of Resources in Goals Indicator Satisfaction
|
Mark Index |
о и > |
о 1 |
ч M я .S |
Д |
я 8 = = |
i-i |
u |
.8 |
|
|
Annual quantity of customer's order |
100 |
85 |
80 |
75 |
73 |
70 |
65 |
60 |
58 |
|
Average amount of returned insurance policy |
100 |
85 |
80 |
75 |
73 |
70 |
65 |
60 |
58 |
|
Average amount of each insurance policy |
100 |
85 |
80 |
75 |
73 |
70 |
65 |
60 |
58 |
|
Ratio of customers who own more than 5 types of LOB |
100 |
85 |
80 |
75 |
73 |
70 |
65 |
60 |
58 |
|
Annual customer loss rate |
50 |
80 |
85 |
70 |
50 |
65 |
70 |
65 |
73 |
|
Customer loss rate per year |
50 |
80 |
85 |
70 |
50 |
65 |
70 |
65 |
73 |
|
CLV Average |
50 |
80 |
85 |
70 |
50 |
65 |
70 |
65 |
73 |
|
Distance between service presentation and branch office |
40 |
50 |
80 |
75 |
73 |
70 |
85 |
65 |
50 |
|
Number of fully satisfied requests |
40 |
50 |
80 |
75 |
73 |
70 |
85 |
65 |
50 |
|
Rate of returned insurance policy |
40 |
50 |
80 |
75 |
73 |
70 |
85 |
65 |
50 |
|
Customer marginal profit |
40 |
50 |
80 |
75 |
73 |
70 |
85 |
65 |
50 |
|
Price variation impact on demand |
40 |
85 |
80 |
70 |
73 |
75 |
90 |
70 |
65 |
|
Time interval between two customer |
40 |
85 |
80 |
70 |
73 |
75 |
90 |
70 |
65 |
|
Percent of customers who buy more than 5 types services into whole |
40 |
85 |
80 |
70 |
73 |
75 |
90 |
70 |
65 |
Table IX. Important Resources According to Expert’s Idea
|
Name |
The Most Influential Resources (respectively from right to left) and Productivity (scores of 100) |
|||||
|
Name |
Mark |
Name |
Mark |
Name |
Mark |
|
|
Annual quantity of customer's order |
||||||
|
Average amount of Returned insurance policy |
Sales and |
73 |
Information |
70 |
Value |
51 |
|
Average amount of each insurance policy |
Marketing |
Management |
Creation |
|||
|
Ratio of customers who own more than 5 types of LOB |
||||||
|
Annual customer loss rate |
||||||
|
Rates of attract new customers |
Financial Resources |
49 |
Information Management |
70 |
Sales and Marketing |
73 |
|
CLV average |
||||||
|
Distance between service presentation and branch office |
||||||
|
Number of fully satisfied requests |
Strategy |
78 |
Sales and |
73 |
Communication |
62 |
|
Rate of returned insurance policy |
Development |
Marketing |
Integrity |
|||
|
Customer marginal profit |
||||||
|
Price variation impact on demand |
||||||
|
Time interval between two customer |
Sales and Marketing |
73 |
Information Management |
70 |
Communication Integrity |
62 |
|
Percent of customers who buy more than 5 types services into whole |
||||||
Table X. Effective Indicators and Processes in Goal Achievement
|
Index |
Quality Status |
|
|
Rates of attract new customers |
Excellent |
|
|
Time interval between two customer |
Well |
|
|
Distance between service presentation and branch office |
||
|
Rate of returned insurance policy |
||
|
Price variation impact on demand |
||
|
Good |
||
|
Annual customer loss rate |
||
|
Average amount of returned insurance policy |
||
|
Ratio of customers who own more than 5 types of LOB |
||
Table XI. Procedure to Attain the Effective and Efficient Resources (from left to right)
|
Held In Common |
The Most Important Resources |
Goals |
Indicator That Meets Effectiveness Criteria |
|
Customer's Loyalty |
Price variation impact on demand |
||
|
Distance between service presentation and branch office |
|||
|
■a и |
Sales and Marketing, Information Management |
Customer's Value |
Average amount of returned of insurance policy Rates of attract new customers |
|
Ratio of customers who own more than 5 types of LOB |
|||
|
Customer's Retention |
Annual customer loss rate |
||
|
strategy development, |
Customer's Satisfaction |
Rate of returned insurance policy |
|
|
Sales and Marketing |
Time interval between two customer |
-
F. Extract Competitive Advantage from Capabilities
Sales process satisfies indicator of the created value for the customers. Pollster result shows that one knows company with the features like stability, good services, and well-known brand. The conducted poll by the Sales and Marketing deputy shows that customers have a good satisfaction degree from selling network services with decades of experience in the insurance industry, known as the company's strengths. The market survey also reveals scant competitor among non-governmental insurance companies that provide services in Sina Co. quality level. Therefore, Sales and Marketing procedure could be described as a noteworthy option for new competitive advantage.
-
VI. Discussion
As mentioned before, invoked methodology for development of agent-based architecture is a credible one that makes verification guaranteed. A consideration on existing mythologies including comparison with used one, and assessing proposed architecture conceptually presented in continue:
-
A. About Methodology
In addition to the high-level steps such as "specify the system" or even "identify the system’s goals", a usable methodology will be needed to provide detailed guidelines explaining how these steps had carried out. These guidelines often expressed as a collection of heuristics and examples: it is difficult to give hard rules in a general-purpose methodology and the design decisions often concern trade-offs. Processes and heuristics can help designers identify the decision points and the reasons for making various choices, but cannot make choices for them. As the process followed, design artifacts are produced; these are used to capture information about the system and its design. For example, in UML, a class diagram captures the classes in a system and their relationships. Design artifacts vary in formality and size – from a weighty tome written in natural English, to diagrams on a white board, to fully formal specifications written in a precisely defined notation. The Prometheus methodology defines a detailed process for specifying, designing, implementing, and testing/debugging agent-oriented software systems. Numerous agent-oriented methodologies have proposed in recent years [39-59].
One would be interested by reading the publications describing the various methodologies and the comparisons between methodologies that are beginning to appear [56, 60, 61] .
Comparisons of the existing methodologies are limited but beginning to be appeared. MaSE , Prometheus , and Tropos compared using a feature-based approach in which the assessment of each methodology against the criteria validated using a survey of the developers of the methodology [60] . This work is extended to include MESSAGE and GAIA and also to provide a comparative analysis of the models and processes of each of the methodologies . Other comparisons between agent-oriented methodologies considered in [62] . Some other areas where Prometheus differs significantly from object-oriented methodologies include:
-
V The provision of a process for determining the types of agents in the system.
V Treating messages as components in their own right, not just as labels on arcs. This allows a message (or an event) to be handled by multiple plans, which is crucial to achieving flexibility and robustness.
V Distinguishing percepts and actions from messages, and looking explicitly at percept processing.
V Distinguishing passive components ( D ata, B eliefs) from active components ( A gents, C apabilities,
P lans): with object-oriented modeling, everything modeled as ( P assive) objects.
Table XII. Non-Parametric Analysis of Expert Responses
|
Question |
Hypothesis |
Hypothesis Testing |
Hypothesis Testing Result |
Significance Level |
|
1 |
H 0 |
Parsimony don't observed in the model |
Zero rejected with 95 % confidence interval |
0.035 0.02 0.007 , 0.035 , 0.007 , 0.035 Respectively for the knowledgegenerator agent, Qualitative analysis attaining the goals agent , use of resources, competitive advantage |
|
2 |
H 1 H 0 |
Parsimony observed in the model There is lack of components efficiency in the model |
82 % insist on the observance of the principle of parsimony. Non-performance identities rejected with 95 % confidence |
|
|
3 |
H 1 H 0 |
There is Efficient components in the model There is no need to the proposed identities |
82 % estimates performance high or very high Zero rejected with more than 95 % confidence interval |
|
|
H 1 |
identities of the proposed model are necessary |
The knowledge generator and productive use of resources with 91 %, Qualitative analysis attaining the goals and competitive advantage analysis with 82 % |
||
|
4 |
H 0 |
model identities are not defensible theoretically |
Zero rejected with more than 95 % confidence interval |
0.007 , 0.035 , 0.007 , 0.035 Respectively for the knowledgegenerator agent, Qualitative analysis attaining the goals agent , use of resources, competitive advantage |
|
H 1 |
model identities are defensible theoretically |
The knowledge generator and productive use of resources with 91 %, Qualitative analysis attaining the goals and competitive advantage analysis with 82 % |
-
B. Content Validity
Validation of presented architecture in this paper is relied on the expert's opinion. Expert comments have been analyzed using the nonparametric, chi-square statistic, and statistical hypothesis testing evaluated with a specified significance level (Table 12). Asked questions are:
-
1. Was the principle of parsimony (adequacy and minimum number of identities) met in the
-
2. How much is the architecture performance in analysis reporting fallible in your idea ?
-
3. Are the individual identities necessary for architecture ?
-
4. Are the designed model identities in a theoretical defensible context ?
Architecture ?
The fifes part of the questionnaire concentrated on the advantages and disadvantages of the proposed architecture. Transparency in business management and feasibility of implementing such architecture are some of the cited advantages, and ignoring the manpower creativity is cited as a disadvantage.
-
VII. Concluding Remarks And Future Works
In this innovative paper, the main issues of intelligent agent technology, multi agent architecture, and Customer Relationship Management were studied. Presented architecture characteristics could be outlined as follows:
V Using of intelligent agents embeds the property of autonomy. Obviously, such a feature facilitates the strategic management process, will precise analysis, and accelerates reaction.
V Using the concepts of information technology, competitive advantage, and process management [8] prepares a real and comprehensive perception from organization that is finally observable in the strengths and weaknesses reports.
V The case of strategic view to the organization (through the RBV) attains the strategic goals which have structurally and systematically guaranteed; hence, process analysis, SBU's, and all the endeavors for achieving the guided goals in the line of organizational strategic plan.
V Presented architecture is somehow generalized .i.e. not limited to a particular industry or business and has the capability to implement almost in any industry and business areas.
Conducted case study (Sina insurance Co. CRM strategy) led to Sales and Marketing deputy as a competitive advantage. The results matched with the CEO's idea that confirms presented architecture in this paper and could be scored as validation in another way. The effectiveness of resources and the importance of indicators in attaining the goals were two of the invoked issues according to the expert's opinions. The use of fuzzy logic for decision making in this case, is an issue that could be considered in future. Applying a software design methodologies such as RUP or SOA, could be useful in business environment if there is a need to implement the architecture.
Acknowledgments
The authors like to acknowledge and extend heartfelt gratitude to the indebted friends whom supports us in all the time study and analysis in pre and post research period. Also would like to thank Dr. Peykarjou, Sina Insurance Co. CEO for cooperation during the case study.
References Hybrid Intelligent Agent-Based Internal Analysis Architecture for CRM Strategy Planning
- Payne, A., Handbook of CRM: achieving excellence in customer management. 2006: Butterworth-Heinemann.
- Swift, R.S., Accelerating customer relationships: Using CRM and relationship technologies. 2001: Prentice Hall.
- Hettich, S., H. Hippner, and K.D. Wilde, Customer relationship management (CRM). Das Wirtschaftsstudium, 2000. 29(10): p. 1346-1366.
- Kim, J., E. Suh, and H. Hwang, A model for evaluating the effectiveness of CRM using the balanced scorecard. Journal of interactive Marketing, 2003. 17(2): p. 5-19.
- Park, C.-H. and Y.-G. Kim, Identifying key factors affecting consumer purchase behavior in an online shopping context. International Journal of Retail & Distribution Management, 2003. 31(1): p. 16-29.
- Pearce, J.A. and R.B. Robinson, Strategic management: Formulation, implementation, and control. 1997: Irwin.
- Zarandi, M., E. Hadavandi, and I. Turksen, A hybrid fuzzy intelligent agent‐based system for stock price prediction. International Journal of Intelligent Systems, 2012. 27(11): p. 947-969.
- Becker, J., M. Kugeler, and M. Rosemann, Process management: a guide for the design of business processes: with 83 figures and 34 tables. 2003: Springer.
- Barney, J., M. Wright, and D.J. Ketchen, The resource-based view of the firm: Ten years after 1991. Journal of management, 2001. 27(6): p. 625-641.
- Rummler, G.A. and A.P. Brache, Improving Performance: How to Manage the White Space on the Organization Chart. 1995.
- Wilde, K.D., D.-K.S. Hettich, and D.-W.I.H. Hippner, Customer Relationship Management—Informationstechnologien im Dienste der Kundeninteraktion, in Dienstleistungsmanagement Jahrbuch 2001. 2001, Springer. p. 167-201.
- Barnett, T. and S. Valentine, Issue contingencies and marketers' recognition of ethical issues, ethical judgments and behavioral intentions. Journal of Business Research, 2004. 57(4): p. 338-346.
- Ng-Kruelle, G., et al., The price of convenience: Privacy and mobile commerce. Quarterly Journal of Electronic Commerce, 2002. 3: p. 273-286.
- Kevork, E.K. and A.P. Vrechopoulos, CRM literature: conceptual and functional insights by keyword analysis. Marketing Intelligence & Planning, 2009. 27(1): p. 48-85.
- Stein, A. and M. Smith, CRM systems and organizational learning: An exploration of the relationship between CRM effectiveness and the customer information orientation of the firm in industrial markets. Industrial Marketing Management, 2009. 38(2): p. 198-206.
- Ngai, E., Customer relationship management research (1992-2002): An academic literature review and classification. Marketing Intelligence & Planning, 2005. 23(6): p. 582-605.
- Drejer, A., Strategic management and core competencies: Theory and application. 2002: Greenwood Publishing Group.
- Normann, R. and R. Ramirez, From value chain to value constellation: designing interactive strategy. Harvard business review, 1993. 71: p. 65-65.
- Hamel, G. and C. Prahalad, Competing for the Future. HARVARD BUSINESS REVIEW, 1994.
- Mankoff, S., Ten critical success factors for CRM: Lessons learned from successful implementations. Siebel System, White Paper, 2001.
- Martinsons, M., R. Davison, and D. Tse, The balanced scorecard: a foundation for the strategic management of information systems. Decision support systems, 1999. 25(1): p. 71-88.
- Van Grembergen, W. and I. Amelinckx. Measuring and managing e-business projects through the balanced scorecard. in System Sciences, 2002. HICSS. Proceedings of the 35th Annual Hawaii International Conference on. 2002. IEEE.
- Olve, N.-G., J. Roy, and M. Wetter, Performance drivers: A practical guide to using the balanced scorecard. 1999: J. Wiley.
- Jennings, N.R. and M.J. Wooldridge, Agent technology: foundations, applications, and markets. 2002: Springer.
- Russell, S.J., et al., Artificial intelligence: a modern approach. Vol. 74. 1995: Prentice hall Englewood Cliffs.
- Bramer, M.A. and V. Devedzic, Artificial Intelligence Applications and Innovations: IFIP 18th World Computer Congress: TC12 First International Conference on Artificial Intelligence Applications and Innovations (AIAI-2004), 22-27 August 2004, Toulouse, France. Vol. 154. 2004: Kluwer Academic Pub.
- Alex, B., S. Stephen, and T. Kurt, Building data mining applications for CRM. New York (etc.): McGraw-Hill, 2000.
- Pyle, D., Business modeling and data mining. 2003: Morgan Kaufmann.
- Larose, D.T., Discovering knowledge in data: an introduction to data mining. 2005: Wiley-Interscience.
- David, F.R., Strategic management, 1989, Merrill Pub. Co.(Columbus).
- Keogh, E., et al., Compression-based data mining of sequential data. Data Mining and Knowledge Discovery, 2007. 14(1): p. 99-129.
- Blum, A.L. and P. Langley, Selection of relevant features and examples in machine learning. Artificial intelligence, 1997. 97(1): p. 245-271.
- Amit, R. and P.J. Schoemaker, Strategic assets and organizational rent. Strategic management journal, 1993. 14(1): p. 33-46.
- Lesser, V.R., Cooperative multiagent systems: A personal view of the state of the art. Knowledge and Data Engineering, IEEE Transactions on, 1999. 11(1): p. 133-142.
- Rivard, S., L. Raymond, and D. Verreault, Resource-based view and competitive strategy: An integrated model of the contribution of information technology to firm performance. The Journal of Strategic Information Systems, 2006. 15(1): p. 29-50.
- Hammer, M. and J. Champy, Reengineering the corporation: a manifesto for business evolution. Nicholas Brealey, London, 1993.
- Finin, T., Y. Labrou, and J. Mayfield, KQML as an agent communication language. 1995.
- Maturana, F.P., et al., Distributed multi-agent architecture for automation systems. Expert Systems with Applications, 2004. 26(1): p. 49-56.
- Matsatsinis, N., et al., An agent-based system for products penetration strategy selection. Applied Artificial Intelligence, 2003. 17(10): p. 901-925.
- Odell, J., H.V.D. Parunak, and B. Bauer, Extending UML for agents. Ann Arbor, 2000. 1001: p. 48103.
- Kinny, D., M. Georgeff, and A. Rao, A methodology and modelling technique for systems of BDI agents, in Agents breaking away. 1996, Springer. p. 56-71.
- Kendall, E.A., M.T. Malkoun, and C. Jiang, A methodology for developing agent based systems for enterprise integration, in Modelling and Methodologies for Enterprise Integration. 1996, Springer. p. 333-344.
- Iglesias, C.A., M. Garijo, and J.C. González, A survey of agent-oriented methodologies. framework, 1999. 2: p. 34.
- DeLoach, S.A., E.T. Matson, and Y. Li. Applying Agent Oriented Software Engineering to Cooperative Robotics. in FLAIRS Conference. 2002.
- Collinot, A., A. Drogoul, and P. Benhamou. Agent oriented design of a soccer robot team. in Proceedings of the Second International Conference on Multi-Agent Systems (ICMAS-96). 1996.
- Burmeister, B., A. Haddadi, and G. Matylis. Application of multi-agent systems in traffic and transportation. in Software Engineering. IEE Proceedings-[see also Software, IEE Proceedings]. 1997. IET.
- Bresciani, P., et al., Modeling early requirements in Tropos: a transformation based approach, in Agent-Oriented Software Engineering II. 2002, Springer. p. 151-168.
- Burrafato, P. and M. Cossentino. Designing a multi-agent solution for a bookstore with the PASSI methodology. in AOIS@ CAiSE. 2002.
- Purvis, M., et al., A multi-agent system for the integration of distributed environmental information. Environmental Modelling & Software, 2003. 18(6): p. 565-572.
- Caire, G., et al., Agent oriented analysis using MESSAGE/UML, in Agent-oriented software engineering II. 2002, Springer. p. 119-135.
- Elammari, M. and W. Lalonde. An agent-oriented methodology: High-level and intermediate models. in Proc. of the 1st Int. Workshop. on Agent-Oriented Information Systems. 1999.
- Cossentino, M. and C. Potts. A CASE tool supported methodology for the design of multi-agent systems. in International Conference on Software Engineering Research and Practice (SERP'02). 2002.
- Debenham, J. and B. Henderson-Sellers, Designing agent-based process systems-extending the OPEN Process Framework. Intelligent agent software engineering, 2003: p. 160-190.
- Glaser, N., The CoMoMAS methodology and environment for multi-agent system development, in Multi-Agent Systems Methodologies and Applications. 1997, Springer. p. 1-16.
- Lind, J., Iterative software engineering for multiagent systems: the MASSIVE method. 2001: Springer-Verlag.
- Shehory, O. and A. Sturm. Evaluation of modeling techniques for agent-based systems. in Agents. 2001.
- Varga, A. The OMNeT++ discrete event simulation system. in Proceedings of the European Simulation Multiconference (ESM’2001). 2001. sn.
- Wagner, G., The Agent–Object-Relationship metamodel: towards a unified view of state and behavior. Information Systems, 2003. 28(5): p. 475-504.
- Wooldridge, M. and P. Ciancarini, Agent-oriented software engineering: the state of the art. Lecture notes in computer science, 2001: p. 1-28.
- Dam, K.H. and M. Winikoff. Comparing agent-oriented methodologies. in Agent-Oriented Information Systems. 2004. Springer.
- O’malley, S.A. and S.A. DeLoach, Determining when to use an agent-oriented software engineering paradigm. 2002: Springer.
- Cernuzzi, L., G. Rossi, and L. Plata. On the evaluation of agent oriented modeling methods. in Proceedings of Agent Oriented Methodology Workshop, Seattle. 2002.
