Hypervisors’ Guest Isolation Capacity Evaluation in the Private Cloud Using SIAGR Framework

Author: P. Vijaya Vardhan Reddy, Lakshmi Rajamani
Journal: International Journal of Information Technology and Computer Science(IJITCS) @ijitcs
Article in issue: 4 Vol. 7, 2015.
Free access
Hypervisor vendors do claim that they have negated virtualization overhead compared to a native system. They also state that complete guest isolation is achieved while running multiple guest operating systems (OSs) on their hypervisors. But in a virtualization environment which is a combination of hardware, hypervisor and virtual machines (VMs) with guest operating systems, there bound to be an impact on each guest operating system while other guest operating systems are fully utilizing their allotted system resources. It is interesting to study hypervisor’s guest isolation capacity while several guest operating systems running on it. This paper selected three hypervisors, namely ESXi 4.1, XenServer 6.0 and KVM (Ubuntu 12.04 Server) for the experimentation. The three hypervisors are prudently preferred as they represent three different categories (full virtualized, para-virtualized, and hybrid virtualized). Focus being on hypervisors’ guest isolation capacity evaluation, therefore, private cloud is chosen over public cloud as it has fewer security concerns. Private Cloud is created using apache’s CloudStack. Windows 7 OS is deployed as a guest VM on each hypervisor and their guest isolation capacity is evaluated for CPU and Network performances.
Hypervisor, CloudStack, Virtualization, Para Virtualization, Full Virtualization, Hybrid Virtualization
Short address: https://sciup.org/15012272
IDR: 15012272
Text of the scientific article Hypervisors’ Guest Isolation Capacity Evaluation in the Private Cloud Using SIAGR Framework
Published Online March 2015 in MECS
Hypervisors with the help of virtualization technology [1] enable multiple operating systems to run above it. They act as a thin software layer between physical hardware and virtual machines which are running with different guest operating systems. Hypervisors share physical hardware resources to guest operating systems. Hypervisors are categorized into three models as full virtualized hypervisor, para-virtualized hypervisor and hybrid model hypervisor based on virtualization techniques that are used in their development.
VMware ESXi hypervisor uses full virtualization [2] technique in which each virtual machine owns a virtual BIOS and a replicated PC infrastructure. All emulated hardware for the virtual machines is emulated by the ESXi kernel to give near native performance. Citrix XenServer uses Para-virtualization [2] technique which involves explicitly modifying the guest operating system. KVM (Kernel-based Virtual Machine) depicted as a hybrid model as it uses both hardware-assisted virtualization and full virtualization. Now it is interesting to study which hypervisor gives better guest isolation capacity when multiple guest operating systems running on it and utilizing maximum of their allotted system resources.
Cloud Computing [3] model enables on-demand access to computing resources and encourages availability. Cloud computing recommends four deployment models which are Private, Public, Community and Hybrid models. Private Clouds are more secure as they deployed behind the firewall of an organization and their computing infrastructure exclusively operated for the same organization. Cloud computing model benefits small and medium businesses with less infrastructure and maintenance cost and they can be assured of proper delivery because of SLA (Service Level Agreement) between service providers and customers [4].
The experiment in the paper creates a Private Cloud using apache’s CloudStack [5]. Five instances of Windows 7 guest operating system (OS) are installed on each hypervisor namely ESXi 4.1, XenServer 6.0 and KVM (Ubuntu 12.04 Server). CPU and Network performances are measured on guest OS by making other guest OSs to utilize maximum of their allotted system resources. Vital system information is gathered using SIGAR (System Information Gatherer and Reporter) [6] framework. Hypervisors’ guest isolation capacity is evaluated for windows guest VM by interpreting results which are collected using SIGAR.
The remainder of this paper is organized as follows: Section 2 gives an insight into related work which had happened in the selected research area. Section 3 describes the design of experiments. Section 4 and 5 describes the test architecture for CPU Utilization and Network performance for guest isolation capacity evaluation. Section 6 presents the results of the experiments and evaluation. Conclusion and future work are given in the final section.
-
II. Related Work
The following papers are reviewed as part of related work.
Two papers, ‘A Performance Comparison of Hypervisors’ [7] by VMware and ‘A Performance Comparison of Commercial Hypervisors’ [8] paper by XenSource, conduct standard performance tests to evaluate the performance of Xen and ESX hypervisors. Both papers have used standard benchmarks from SPEC (Standard Performance Evaluation Corporation) [9] and Passmark [10]. CPU and Memory performance of hypervisors’ have been evaluated using SPECcpu2000 and Passmark. SPECjbb2005 is used in evaluating hypervisors’ application server’s workload and SPECcpu2000 INT used in development workloads. All the experiments were run in a context with native and virtualization overhead was measured. From the results, both hypervisors gave near native performance except full virtualized hypervisor ESX exhibited slightly better performance over para-virtualized hypervisor Xen.
‘Benchmark Overview – vServCon’ paper by Fujitsu PRIMERGY Servers [11] created a benchmark called ‘vServCon’, which is not a new benchmark, but a framework created using already established standard benchmarks. This ‘vServCon’ framework generates consolidated workloads using standard benchmarks on a virtualized server. Three applications database, application server, web server are deployed in each virtual machine on a virtualized server and all these applications are stressed with load generators through standard established benchmarks. All individual results are summarized into one result and they named it as a score for the performance capability of a virtualized server.
Different toolkits have been used to evaluate the performances of three hypervisors such as XEN, KVM and VMware ESX [12-15] in the context of virtualization overhead. In the similar lines of Oprofile for Linux, Menon [13] had used Xenoprof, a system-wide statistical profiling toolkit for Xen, to evaluate the performance overhead of network I/O devices. Menon had claimed from his research that domain0 performance is close to native, but guest operating system performance degrades considerably. To test processing efficiency on floating point Jianhua [14] had used LINPACK benchmark tool. Jianhua had found that on Xen hypervisor, windows XP operating system gives better performance as compared to fedora 8. Jianhua explains it as Xen owns better enhancement packages for windows XP as compared to fedora. To evaluate memory virtualization of Xen and KVM, Jianhua had used LMbench. From the experiments, Jianhua had noticed that Xen’s performance is better than that of KVM. To evaluate file system performance among Xen and KVM, Jianhua had used IOzone. Jianhua had noticed that performance of Xen and KVM is significantly slower than that of native. But among two hypervisors, Xen performance is better than that of KVM.
In the paper, ‘Virtual Machine Benchmarking’, by Kim Thomas Moller [16] creates a new benchmarking suite called VMbench. The benchmark evaluates the performance of virtual machine environments in three stages. In the first stage with micro and nano-benchmarks the performance of virtualization-specific functional primitives is measured on a virtual machine. Second stage uses a linear model for realistic applications under optimal conditions. In the third stage, the performance is measured for non-optimal conditions for concurrent VMs. VMbench follows a latency-oriented approach than data throughput.
‘Performance Comparison of Hypervisors in the Private Cloud’, paper by P.V.V.Reddy [17] had conducted experiments in the private cloud with CloudStack for three hypervisors for system workloads using Passmark benchmark. The paper evaluated three hypervisors’ performance for CPU utilization, Memory management, Disk activity using Passmark and Network communication performance using Netperf [18]. From the results, with single virtual machine, for system workloads ESXi hypervisor’s performance in CPU utilization is better than that of XenServer and KVM. In Memory and Disk activity performances XenServer scores marginally better over other two hypervisors. In Network communication both XenServer and ESXi scores equal to native without any virtualization overhead.
In the paper, ‘Evaluation of Different Hypervisors Performance in the Private Cloud with SIGAR Framework’ by P.V.V.Reddy [19] had evaluated the performance of three hypervisors’ in the private cloud with single virtual machine. CPU utilization and Memory details are captured using SIGAR framework as absolute values. Disk activity is captured using Passmark and network performance using Netperf. In CPU utilization, ESXi scores low CPU utilization hence gives better performance compared to other two hypervisors. In available memory test, XenServer’s performance is noticeably better among three hypervisors.
After analyzing the relevant work on hypervisors’ performance, we have decided to evaluate guest isolation capacity of each hypervisor in the private cloud. Private Cloud is chosen as it poses fewer security concerns compared to a public cloud and it creates proprietary computing architecture for an organization behind the firewall. Five virtual machines with windows 7 as operating system are deployed on each hypervisor host. CPU utilization and Network performance have been evaluated on guest VM while other guest virtual machines are utilizing their allotted system resources to the maximum. We have preferred SIGAR framework to collect the system resource information from the test OS under different load conditions. SIGAR is selected because it provides minute system level information very accurately. The collected data is used while evaluating guest isolation capacity of hypervisors. The experiment and evaluation technique is unique compared to the work done previously.
-
III. Design of experiment – Hypervisors with Guest VMs in the Private Cloud
We have simulated a private cloud using CloudStack. CloudStack is a cloud based open source software which builds private cloud environments. CloudStack supports multiple hypervisors like Oracle VM, Bare Metal, Hyper-V, KVM, XenServer and VMware ESXi. CloudStack has the ability to provide web interface for users. CloudStack is implemented in java language that is designed to deploy and manage large networks of virtual machines. CloudStack builds a highly available and scalable private cloud. CloudStack also offers a command line to manage the cloud environment.
Two machines are required to create a private cloud using CloudStack. One machine is a Management Server, which runs on a dedicated server or a VM. It controls allocation of virtual machines to hosts and assigns storage and IP addresses to the virtual machine instances. The Management Server runs in a Tomcat container and uses a MySQL database for persistence. In the experiment, Management Server (a Virtual Machine with hardware configuration of 4GB RAM and 100GB hard disk) is installed on Ubuntu (12.04 64-bit) operating system.
Second machine is a host machine where hypervisors are installed on a bare metal with hardware configuration of AMD FX 8150 – 8 Core 3.6 GHz processor, 32 GB RAM, 1 TB hard disk and 2 NICs for the test environment. Front end will be any base machine to launch CloudStack UI using web interface (with any browser software IE, Google Chrome) to provision the cloud infrastructure by creating a zone, pod, cluster and host in the sequential order.
In our test environment XenServer 6.0, ESXi 4.1 and KVM (Ubuntu 12.04) hypervisors are deployed as hosts independently in the CloudStack. Five virtual machines (VM1, VM2, VM3, VM4 and VM5) with guest operating system as Windows 7 are installed on each hypervisor independently in the private cloud as depicted in Fig.1.
Below are the stages, which illustrate how the load is increased on the testing OS by making other guest operating systems to utilize their allotted resources to maximum.
Stage 1: The guest Operating System performance is captured when other four guest operating systems are in the idle condition
Stage 2: The guest Operating System performance is captured when other one guest operating system utilizing maximum System resources
Stage 3: The guest Operating System performance is captured when other two guest operating systems utilizing maximum System resources
Stage 4: The guest Operating System performance is captured when other three guest operating systems utilizing maximum System resources
Stage 5: The guest Operating System performance is captured when other four guest operating systems utilizing maximum System resources
The above steps are repeated on all three hypervisors to evaluate their guest isolation capacity. The metrics are gathered using SIGAR API.
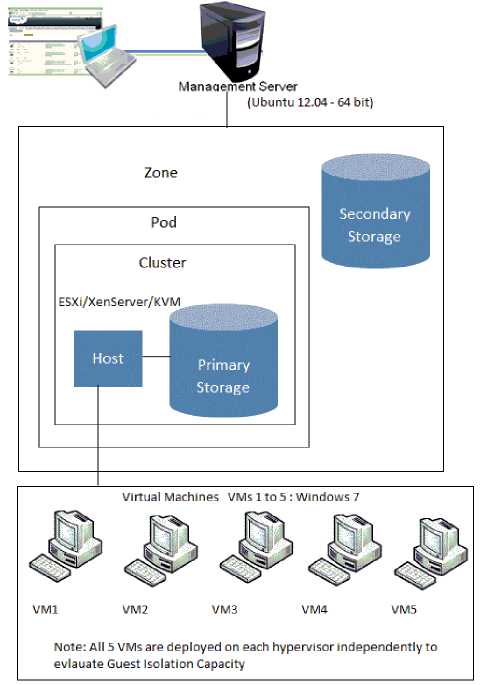
Fig. 1. Hypervisors with guest virtual machines in the private cloud
-
IV. Guest Isolation Capacity Evaluation for CPU Utilization
CPU utilization is captured on the testing guest operating system when other four guest OSs are in the idle condition. Variation on the testing OS’s CPU utilization is captured with java program using SIGAR API when other one guest OS CPU utilization is stretched to maximum i.e., making it utilize 100%. This variation indicates guest isolation capacity of a hypervisor. Less variation indicates the better guest isolation capacity of the hypervisor. Variation on the testing OS’s CPU utilization is captured when other two guests OSs stretched to 100% CPU. The testing pattern continued till all four OSs stretched to 100% CPU and CPU utilization is captured on the testing OS. The test architecture is illustrated in the below Fig.2.
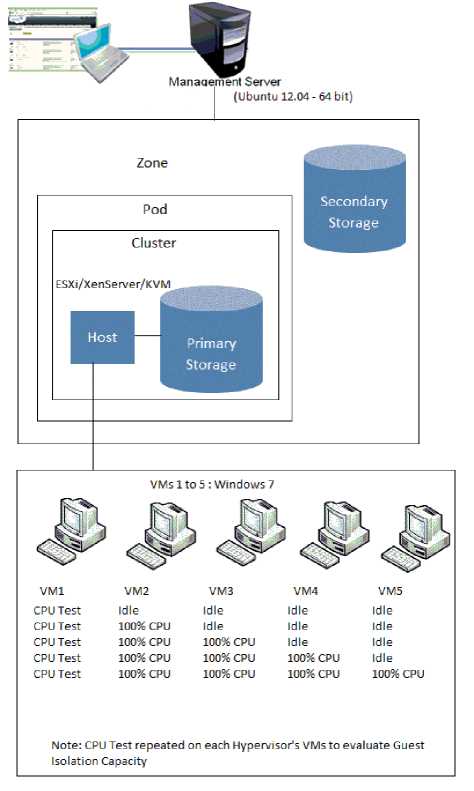
Fig. 2. Guest Isolation Capacity Evaluation for CPU Utilization
performance test, high transfer rate and less variation (for high workloads) indicates the better guest isolation capacity of a hypervisor.
Cluster
Idle
Network Test Network Test Network Test Network Test Network Test
100% Network 100% Network 100% Network Idle
100% Network 100% Network 100% Network 100% Network
100% Network Idle
100% Network 100% Network Idle
Secondary Storage
Primary
Storage
Note: Network Test repeated on each Hypervisor's VMs to evaluate Guest Isolation Capacity
-
V. Guest Isolation Capacity Evaluation for Network Performance
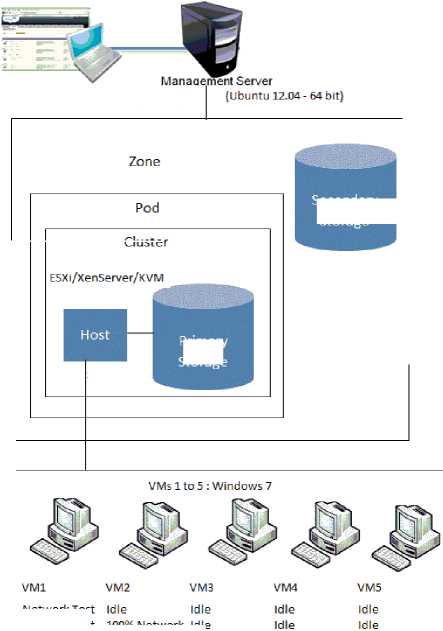
Network performance is captured on the testing guest operating system when other four guest OSs are in the idle condition. Variation on the testing OS’s Network performance is captured with sample java program using SIGAR API when other one guest OS using maximum Network i.e., flooding it with packets to utilize 100% network. This variation indicates guest isolation capacity of a hypervisor. Less variation indicates the better guest isolation capacity of the hypervisor. Variation on the testing OS’s Network performance is captured when other two guest OSs stretched to 100% Network utilization. The testing pattern continued till all four OSs stretched to 100% Network utilization and Network performance is captured on the testing OS. The test architecture is illustrated in the below Fig.3.
This section provides the results of CPU utilization and Network performance tests which are executed on three hypervisors’ guest operating systems. Important system information is gathered using SIGAR API. In CPU utilization test, lower CPU consumption and less variation (in case of high workloads) exhibits better guest isolation capacity for a hypervisor. In Network
Fig. 3. Guest Isolation Capacity Evaluation for Network Performance
-
VI. Results
-
A. Guest Isolation Capacity Evaluation for CPU Utilization
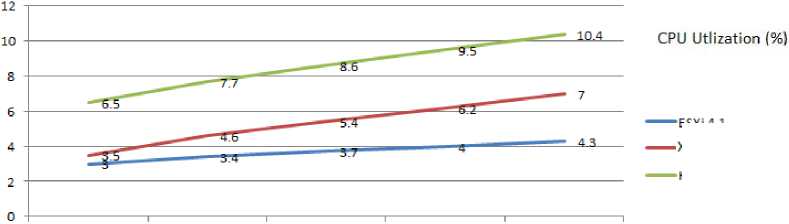
Even though, hypervisor vendors do claim that they have achieved 100% guest isolation still there is an impact as all the virtual machines are sharing same physical hardware through hypervisor. When operating systems are running on a hypervisor, their CPU utilization gets impacted as and when other operating systems utilize maximum of their CPU. Less variation in CPU utilization in case of high workloads indicates better guest isolation capacity of a hypervisor. Here ESXi hypervisor scores better than other two hypervisors which are used in the experiment. When four other OSs are in idle condition (low workload), test on one OS records certain CPU utilization, once one of the other OSs starts using maximum CPU utilization, the respective OS CPU utilization increases and when other two, three, four OSs start using maximum CPU utilization (high workload), the respective test OS CPU utilization increases further. CPU utilization details are captured through java program using SIGAR API on respective guest OS for each scenario.
From the results as shown in Fig.4, with ESXi hypervisor, windows 7 guest OS after recording CPU utilization at 3% for idle condition (low workload), shows 0.4% variation and records 3.4% CPU utilization from the moment next OS starts utilizing maximum CPU. Test OS exhibits 0.7% variation and records 3.7% CPU utilization from the moment next two OSs start utilizing maximum CPU. Test OS exhibits 1% variation and records 4% CPU utilization from the moment next three OSs start utilizing maximum CPU. Test OS exhibits 1.3% variation and records 4.3% CPU utilization from the moment next four OSs start utilizing maximum CPU (high workload).
From the results as shown in Fig. 4, with XenServer hypervisor, windows 7 guest OS after recording CPU utilization at 3.5% for idle condition (low workload), shows 1.1% variation and records 4.6% CPU utilization from the moment next OS starts utilizing maximum CPU.
Test OS exhibits 1.9% variation and records 5.4% CPU utilization from the moment next two OSs start utilizing maximum CPU. Test OS exhibits 2.7% variation and records 6.2% CPU utilization from the moment next three
OSs start utilizing maximum CPU. Test OS exhibits 3.5% variation and records 7% CPU utilization from the moment next four OSs start utilizing maximum CPU (high workload).
From the results as shown in Fig. 4, with KVM hypervisor, windows 7 guest OS after recording CPU utilization at 6.5% for idle condition (low workload), shows 1.2% variation and records 7.7% CPU utilization from the moment next OS starts utilizing maximum CPU. Test OS exhibits 2.1% variation and records 8.6% CPU utilization from the moment next two OSs start utilizing maximum CPU. Test OS exhibits 3% variation and records 9.5% CPU utilization from the moment next three OSs start utilizing maximum CPU. Test OS exhibits 3.9% variation and records 10.4% CPU utilization from the moment next four OSs start utilizing maximum CPU (high workload).
ESXi 4.1
Xen Server 6.0
KVM (Ubuntu 12.04)
CPU Utilization on CPU Utilization on CPU Utilization on CPU Utilization on CPU Utilization on VM1 when all other VM1 when other VM1 when other VM1 when other VM1 when other
VMsareinldle one VM Utilizing two VMsUtilizing three VMs Utilizing four VMs Utilizing condition Maximum CPU Maximum CPU Maximum CPU Maximum CPU
Fig. 4. Guest Isolation Capacity Evaluation for CPU utilization (Lower value and less variation is better)
Even though, CPU utilization variations are very small in percentages, but significant fluctuation has been seen on windows 7 guest for KVM hypervisor. Windows 7 guest on XenServer also shows slightly high CPU utilization and considerable variations for medium to high workloads as compared to ESXi hypervisor. Low CPU utilization and a very slender variation are observed with windows 7 guest OS on ESXi hypervisor. Hence, ESXi exhibits better guest isolation capacity for CPU utilization.
-
B. Guest Isolation Capacity Evaluation for Network
Performance
When operating systems are running on a hypervisor, their Network performance gets impacted as and when other operating systems utilize maximum of their Network capacity. Less variation in Network performance in case of high workloads indicates better guest isolation capacity of a hypervisor. Here ESXi hypervisor scores better than other two hypervisors which are used in the experiment. When four other OSs are in idle condition (low workload), test on one OS records certain Network throughput, once one of the other OSs starts using maximum Network capacity (flooding the network with packets), the respective OS Network throughput decreases and when other two, three, and four OSs start using maximum Network capacity (high workload), the respective test OS Network throughput decreases further. Network throughput details are captured through java program using SIGAR API on respective guest OS for each scenario.
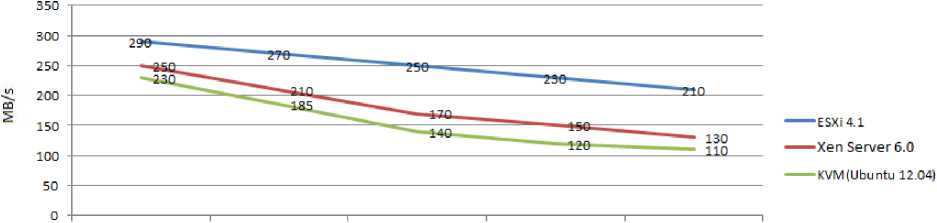
From the results as shown in Fig. 5, with ESXi hypervisor, windows 7 guest OS after recording Network throughput at 290 Mb/s for idle condition (low workload), shows 20 Mb/s variation and records 270 Mb/s Network throughput from the moment next OS starts utilizing maximum Network. Test OS exhibits 40 Mb/s variation and records 250 Mb/s Network throughput from the moment next two OSs start utilizing maximum Network capacity. Test OS exhibits 60 Mb/s variation and records 230 Mb/s Network throughput from the moment next three OSs start utilizing maximum Network capacity. Test OS exhibits 80 Mb/s variation and records 210 Mb/s Network throughput from the moment next four OSs start utilizing maximum Network capacity (high workload).
From the results as shown in Fig. 5, with XenServer hypervisor, windows 7 guest OS after recording Network throughput at 250 Mb/s for idle condition (low workload), shows 40 Mb/s variation and records 210 Mb/s Network throughput from the moment next OS starts utilizing maximum Network. Test OS exhibits 80 Mb/s variation and records 170 Mb/s Network throughput from the moment next two OSs start utilizing maximum Network capacity. Test OS exhibits 100 Mb/s variation and records 150 Mb/s Network throughput from the moment next three OSs start utilizing maximum Network capacity. Test OS exhibits 120 Mb/s variation and records 130 Mb/s Network throughput from the moment next four OSs start utilizing maximum Network capacity (high workload).
From the results as shown in Fig.5, with KVM hypervisor, windows 7 guest OS after recording Network throughput at 230 Mb/s for idle condition (low workload), shows 45 Mb/s variation and records 185 Mb/s Network throughput from the moment next OS starts utilizing maximum Network. Test OS exhibits 90 Mb/s variation and records 140 Mb/s Network throughput from the moment next two OSs start utilizing maximum Network capacity. Test OS exhibits 110 Mb/s variation and records 120 Mb/s Network throughput from the moment next three OSs start utilizing maximum Network capacity. Test OS exhibits 120 Mb/s variation and records 110 Mb/s Network throughput from the moment next four OSs start utilizing maximum Network capacity (high workload).
Network Performance Network Performance on VM1 when all other on VM1 when other
VMsare in Idle one VM utilizing condition maximum network
Network Performance Network Performance
Network Performance on VM1 when other on VM1 when other on VM1 when other two VMs utilizing three VMs utilizing four VMs utilizing maximum network maximum network maximum network
Fig. 5. Guest Isolation Capacity Evaluation for Network throughput (Higher value and less variation is better)
Even though, Network performance variations are very small in Mb/s, but significant fluctuation has been seen on windows 7 guest for KVM hypervisor. Windows 7 guest on XenServer also shows slightly low Network throughput and considerable variations for medium to high workloads as compared to ESXi hypervisor. High Network performance and a very slender variation are observed with windows 7 guest OS on ESXi hypervisor even for high workloads. Hence, ESXi exhibits better guest isolation capacity for Network performance.
-
VII. Conclusion
The intent of the paper is to evaluate and compare the guest isolation capacity of three hypervisors VMWare ESXi Server, XenServer and KVM, which represent pragmatically three different virtualization categories full virtualization, para-virtualization and hybrid virtualization. CloudStack is used to create a private cloud. For Network performance and CPU utilization, test environment is architected to create low, medium and high workloads and the performance information is gathered using SIGAR API on the windows 7 guest operating system.
Among three hypervisors with windows 7 as guest operating system VMWare’s ESXi shows better guest isolation capacity compared to other hypervisors. Here guest OS ‘windows’ is important because which uses hardware virtualization technique hence it is more compatible with full virtualized hypervisor ESXi. Environment and hardware configuration is same for all hypervisors hence other hypervisors, para-virtualized XenServer and hybrid virtualized KVM, need to improve on guest isolation performance perspective by getting more compatible with windows guest OS.
KVM is developed using hybrid virtualization technique as it uses both full virtualization technique and hardware assisted virtualization technique. It is implemented as loadable kernel module which converts Linux kernel into bare metal hypervisor. It uses all advantages of standard Linux. But for windows OS, KVM still need better enhancement packages i.e., better virtual drivers to improve the guest isolation capacity. XenServer uses para-virtualization technique where its guest isolation capacity may be good for para-virtualized guests. But windows being closed guest XenServer also need better enhancement packages for the closed guest.
Experimentation setup was interesting and collecting minute system information through SIGAR API was a firsthand idea. From the results ESXi hypervisor, which uses full virtualization technique exhibits better guest isolation capacity. XenServer is close to ESXi but still needs an improvement to be more compatible with windows guest OS. On the other hand KVM hypervisor needs to improve from guest isolation point of view compared to other two hypervisors. Overall, three hypervisors perform better guest isolation capacity in CPU Utilization and Network performance tests, except ESXi scoring marginally over other two hypervisors.
With windows in the server pool end users and IT decision makers can use ESXi as hypervisor for their datacenters without any hesitation. Hypervisor developers may concentrate on the guest interference exhibited in respective performance tests and may improve their products to mitigate guest involvement, which is revealed as minute system information. This system information indicates how small is the guest interference to another guest on the respective hypervisors and what exactly the minute gap which should be filled. From the test results, ESXi exhibits better guest isolation performance compared to other hypervisors hence it can be recommended as the best-suited hypervisor with windows as guest OS in the private cloud.
Cloud computing is evolving at quick pace more research is required in this area and as a future work more hypervisors can be evaluated from the guest isolation capacity perspective in the cloud environment.
References Hypervisors’ Guest Isolation Capacity Evaluation in the Private Cloud Using SIAGR Framework
- Nanda, S., T. Chiueh, ― A Survey on Virtualization Technologies, Technical report, Department of Computer Science, SUNY at Stony Brook, New York, 11794-4400, 2005.
- VMware (2007) Understanding Full Virtualization, Para virtualization, and Hardware Assist. VMware, white paper Nov 10, 2007.
- Mell, P. & Grance, T. (2009) The NIST Definition of Cloud Computing. Version 15, 10-7-09. National Institute of Standards and Technology, Information Technology Laboratory.
- Buyya, R., Yeo, C.S., Venugopal, S., Broberg, J., Brandic, I. (2009) “Cloud computing and emerging IT platforms: Vision, hype, and reality for delivering computing as the 5th utility”. In: Future Generation Computer Systems, Elsevier B. V.
- CloudStack – OpenSource Cloud Computing platform Apache Organization [Online] http://cloudstack.apache.org
- Hyperic's System Information Gatherer (SIGAR) [Online] https://support.hyperic.com/display/SIGAR/Home
- VMware (2007) A Performance Comparison of Hypervisors VMware. White paper Feb 1, 2007.
- XenSource (2007) A Performance Comparison of Commercial Hypervisors. XenEnterprise vs. ESX Benchmark Results. 2007 XenSource.
- Standard Performance Evaluation Corporation (SPEC). [Online] http://www.spec.org/
- Passmark [Online] http://www.passmark.com
- FUJITSU, Benchmark Overview-vServCon, white paper, March 2010.
- Apparao, P. & Makineni, S. & Newell, D.Virtualization (2006) Characterization of network processing overheads in Xen. Technology in Distributed Computing, 2006. VTDC 2006
- Menon, A. et Al. (2005) Diagnosing Performance Overheads in the Xen Virtual Machine Environment. Conference on Virtual Execution Environments (VEE'05).
- Jianhua, C. & Qinming, H. & Qinghua, G. & Dawei, H. (2008) Performance Measuring and Comparing of Virtual Machine Monitors. Embedded and Ubiquitous Computing, 2008. EUC '08.
- Shan, Z. & Qinfen, H. (2009) Network I/O Path Analysis in the Kernel-based Virtual Machine Environment through Tracing. Information Science and Engineering (ICISE).
- Moller, K.T., ―Virtual Machine Benchmarking, Diploma Thesis, Karlsruhe Institute of Technology, 2007.
- P. V.V.Reddy, L. Rajamani, "Performance Comparison of Hypervisors in the Private Cloud", Advanced Computing, Networking and Informatics,vol.2,2014.DOI:10.1007/978-3-319-07350-7_44 http://link.springer.com/chapter/10.1007%2F978-3-319-07350-7_44
- [Online] Netperf. http://www.netperf.org/netperf/
- P. V.V.Reddy and L. Rajamani "Evaluation of Different Hypervisors Performance in the Private Cloud with SIGAR Framework", International Journal of Advanced Computer Science and Applications, Vol.5, No.2, 2014. http://thesai.org/Downloads/Volume5No2/Paper_10-Evaluation_of_Different_Hypervisors_Performance_in_the_Private_Cloud_with_SIGAR_Framework.pdf
- P. V.V.Reddy, L. Rajamani ‘Performance Evaluation of Hypervisors in the Private Cloud based on System Information using SIGAR Framework and for System Workloads using Passmark’, International Journal of Advanced Science and Technology, Vol 70 (2014), pp.17-32. http://www.sersc.org/journals/IJAST/vol70/3.pdf.
