
IBSMFO-Optimized UPQC-DG Control for Harmonic Mitigation in Hybrid Renewable Microgrids

Журнал: International Journal of Engineering and Manufacturing @ijem
Статья в выпуске: 5 vol.16, 2026 года.
Бесплатный доступ
Distributed generation (DG) systems are increasingly integrated into modern power networks through power-electronic interfaces. However, the presence of nonlinear loads and power-electronic converters introduces harmonic distortion, which can significantly degrade power quality, particularly in three-wire systems. This study investigates harmonic mitigation in a hybrid renewable DG system incorporating solar, wind, fuel-cell-based generation, and grid-connected operation using a Unified Power Quality Conditioner (UPQC). An Improved Bat Search–Moth Flame Optimization (IBSMFO) based control strategy is proposed for optimizing the proportional-integral (PI) controller parameters of the UPQC. The IBSMFO algorithm combines the search characteristics of the Improved Bat Search Algorithm (IBSA) with the Moth Flame Optimization Algorithm (MFOA) to minimize the selected error-based objective function and enhance the dynamic performance of the compensation system. The proposed UPQC is evaluated under ideal and non-ideal source-voltage conditions with nonlinear loads. Simulation results demonstrate effective mitigation of voltage and current harmonics and improved power quality. In particular, the source-current THD is reduced to 4.03% under the operating conditions considered, while a minimum THD of 1.01% is achieved under the corresponding compensation condition. The results confirm that the proposed IBSMFO-optimized UPQC provides effective harmonic compensation and improved power quality performance in hybrid renewable DG systems.
Короткий адрес: https://sciup.org/15020732
IDS: 15020732 | DOI: 10.5815/ijem.2026.05.22
Текст научной статьи IBSMFO-Optimized UPQC-DG Control for Harmonic Mitigation in Hybrid Renewable Microgrids
The electrical power system cannot function without the essential power electronics equipment. Major pieces of household and commercial machinery are delivered first in the three-part distribution system. Second, problems develop; third, options for resolving those problems become available. The most common applications of modern semiconductor switching technology are in household and industrial loads.
Distributed Generation (DG) systems based on renewable energy have been increasingly integrated into contemporary power networks due to rising electrical energy consumption, environmental concerns, and the diminishing supply of fossil fuels. The sustainability, decreased emissions of greenhouse gases, and capacity for localized power production of renewable energy sources including fuel cells, photovoltaic (PV) systems, and wind energy conversion systems have made them attractive alternatives to traditional centralized power generation. Electrical power systems have been greatly altered in both structure and function due to the incorporation of these renewable sources into utility grids. Given the limitations of passive filters, custom power devices are being employed to address distribution-side power quality concerns. [1].
Power electronic converters and non-linear loads are becoming more common in the distribution network, which poses a few power quality issues, despite the many benefits of distributed generation. Integrating renewable energy sources with the grid isn't possible without power electronic interfaces, but these interfaces also cause disturbances like reactive power imbalance, voltage flicker, voltage sag, voltage swell, and poor power factor. Among these issues, harmonic distortion caused by non-linear loads and switching devices is one of the most significant concerns because it adversely affects system efficiency, equipment lifespan, and overall grid reliability.
Because of the prevalence of non-linear loads in industry, variable speed motors, and renewable energy systems that rely on converters, three-phase three-wire distribution systems are especially susceptible to harmonic propagation.
This work is open access and licensed under the Creative Commons CC BY 4.0 License.
Recent research has increasingly investigated intelligent, adaptive, predictive, and optimization-based control techniques for UPQC systems. Recent review studies have summarized different UPQC configurations and control strategies, highlighting the growing use of advanced control approaches for voltage and current power-quality compensation. Optimization-based approaches have also been applied to UPQC controller and filter-parameter selection, including multi-objective and hybrid metaheuristic methods for reducing harmonic distortion and improving overall power-quality performance. Recent AI-based UPQC control studies further demonstrate the increasing application of intelligent techniques to nonlinear and dynamic power-quality problems. These recent developments indicate a transition from conventional fixed-parameter controllers toward adaptive, predictive, and hybrid optimization-based UPQC control. However, further investigation is required into hybrid metaheuristic strategies that effectively balance global exploration and local exploitation for reliable controller-parameter optimization. This research gap motivates the proposed IBSMFO-based UPQC control strategy.
Table 1. Literature review and research gap
|
Existing approach |
Main advantage |
Identified limitation |
Motivation for proposed work |
|
Conventional PI control |
Simple structure and easy implementation |
Fixed gains may provide limited adaptability under rapid load/source variations |
Adaptive/optimized controller required |
|
Fuzzy-logic-based UPQC control |
Better handling of nonlinear operating conditions |
Requires suitable membership functions and rule-base design |
Optimization-assisted control can reduce parameter-selection dependency |
|
ANN/ANFIS-based control |
Strong nonlinear approximation capability |
Requires training data and increased computational complexity |
Metaheuristic optimization offers an alternative tuning mechanism |
|
Conventional MFO- based optimization |
Effective global search capability |
May suffer from premature convergence or inadequate exploration–exploitation balance |
Improved hybrid optimization strategy |
|
Bat-inspired optimization |
Good exploration and parameter-search capability |
Performance depends on algorithm parameters and search strategy |
Integration with MFO can improve search behavior |
|
Existing optimized PI controllers |
Improved steady-state and transient performance |
Controller performance remains dependent on optimal parameter selection and objectivefunction formulation |
IBSMFO-based PI optimization for UPQC |
|
UPQC for renewable DG systems |
Simultaneous voltage/current compensation |
Performance can deteriorate under nonlinear loads and non-ideal grid conditions |
Robust UPQC control under practical operating conditions |
The UPQC-DG, or Unified Power Quality Conditioner with Distributed Generation, is a comprehensive and efficient system that addresses all these issues. The UPQC-DG tackles many power quality concerns simultaneously by combining the capabilities of series and shunt active power filters. The voltage sag, swell, and imbalance that occur on the supply side can be eliminated by injecting voltage components through the series compensator. Conversely, the shunt compensator evens out current imbalance, reactive power consumption, and harmonics in the load current. Energy usage and the power distribution system's dynamic performance are both improved by integrating dispersed generating sources with UPQC.
In this work, a hybrid renewable distributed generation system consisting of solar photovoltaic generation, wind energy conversion systems, fuel cell sources, and the utility grid is considered for performance analysis under various operating conditions. The power contribution of each renewable source is analyzed with respect to power quality improvement and system stability. UPQC-DG control performance can be improved with the help of an intelligent optimization algorithm called the Improved Bat Search Moth Flame Optimization (IBSMFO). To find the best solution with the least amount of error in the objective function, the suggested approach combines IBSA’s exploration capabilities with the MFOA's exploitation features.
The proposed IBSMFO-based controller provides improved convergence characteristics and enhanced compensation capability compared to conventional optimization techniques. Power quality and system stability are both improved by dramatically reducing harmonic distortion in source current and load voltage via efficient management of the UPQC-DG system. Extensive simulation studies are conducted under different operating situations to assess the efficacy of the suggested strategy.
Simulation results demonstrate that the proposed IBSMFO-controlled UPQC-DG successfully mitigates harmonics and maintains voltage and current waveforms within acceptable limits. Both the voltage and current Total Harmonic Distortion (THD) values are significantly decreased, confirming compliance with international power quality standards. Comparative analysis further reveals that the proposed approach offers superior performance in terms of harmonic reduction, dynamic response, and stability enhancement when compared with existing control methods. Hence, for distributed generation systems that rely on renewable energy sources, the suggested UPQC-DG architecture is an effective and dependable way to enhance power quality.
According to the review of prior research, UPQC has been used more for PQ enhancement in environments with good sources and less for applications with non-ideal grid impedance conditions. When analyzing PQ problems, this study considers both ideal and non-ideal source circumstances. UPQCs were created utilizing SRF and MSRF methods to increase the PQ of DG systems operating in grid-linked mode. On the other hand, research on UPQC has paid less attention to the standalone mode-operated DG system that was built using the MSRF technique [7]. The authors of the current study felt obliged to investigate power quality concerns with the existing island DG system because UPQC was already in operation, employing MSRF technology to supply standard current and a PI controller to manage DC voltage. This study also examines the controller's performance under less-than-ideal source conditions, which earlier investigations usually disregarded.
Although several control techniques have been reported for improving the performance of UPQC systems, important limitations remain. Conventional PI controllers are simple and computationally efficient; however, their fixed controller gains may not provide an adequate dynamic response under variations in source voltage, load conditions, and nonlinear loads. Intelligent controllers such as fuzzy logic, ANN, and ANFIS can improve adaptability, but their performance depends strongly on controller structure, training data, membership-function selection, and parameter tuning. Similarly, conventional metaheuristic optimization algorithms can improve PI parameter selection, but their effectiveness is influenced by the balance between exploration and exploitation and may deteriorate under complex and rapidly varying operating conditions.
Therefore, a research gap exists in developing an optimization-based UPQC control strategy that provides effective PI parameter tuning while maintaining rapid dynamic response and harmonic compensation under nonlinear-load and non-ideal grid conditions. To address this gap, this study proposes an Improved Bat Search–Moth Flame Optimization (IBSMFO) based UPQC control strategy. The proposed method combines the search characteristics of the Improved Bat Search Algorithm (IBSA) and Moth Flame Optimization Algorithm (MFOA) to optimize the PI controller parameters using an error-based objective function. Its effectiveness is evaluated in a hybrid renewable DG system under different source and load operating conditions.
The main contributions of this study are summarized as follows:
a) . A fuel-cell-based distributed generation (DG) system incorporating renewable energy sources, including solar and wind energy, is developed to emulate the operation of an independently operating DG system.
b) . The proposed UPQC model is evaluated under two source-voltage conditions, namely ideal and non-ideal (harmonic) conditions, to assess its effectiveness in mitigating voltage sag and source-voltage harmonics.
2. System Description
2.1. Distributed Generation System
Based on these configurations, the performance of the proposed adaptive controller and IBSMFO optimization method is evaluated. The results demonstrate faster and more effective compensation under both operating conditions. The source-current THD is reduced to 2.54% under ideal source conditions and to 2.15% under non-ideal source conditions, confirming the effectiveness of the proposed approach in improving power quality.
The fuel cell, solar, and wind components of the suggested DG system are shown in Figure 1. Before being transferred to the DC bus, the DC power from the DG system is converted into AC electricity using a power inverter. The AC bus receives energy from the UPQC and transmits it to the load, which may be linear or nonlinear. A range of management solutions are required to govern power quality for nonlinear loads and DG.
Voltage management, system stability, environmental concerns, and economic generation are some of the advantages of DGs that are based on solar and wind energy. They have also been keeping an eye on the electrical markets lately.
Numerous topics, such as managing inverters and converters to provide the maximum power, stability issues, examining the impacts of the power system, and others, have been examined in current research on distributed generation (DG) systems based on solar and wind energy.
Increasingly, power utilities are adopting power-electronic switching technologies in distributed generation (DG) systems to prevent reverse power flow from the distribution network. However, the switching operation of these devices can introduce harmonic distortions, thereby increasing the total harmonic distortion (THD) throughout the distribution system. One major issue with power usage is the harmonic distortion that DG introduces. Power electronics equipment is necessary to connect most DGs to power grids. Among them are wind turbines, fuel cells, and photovoltaic cells.
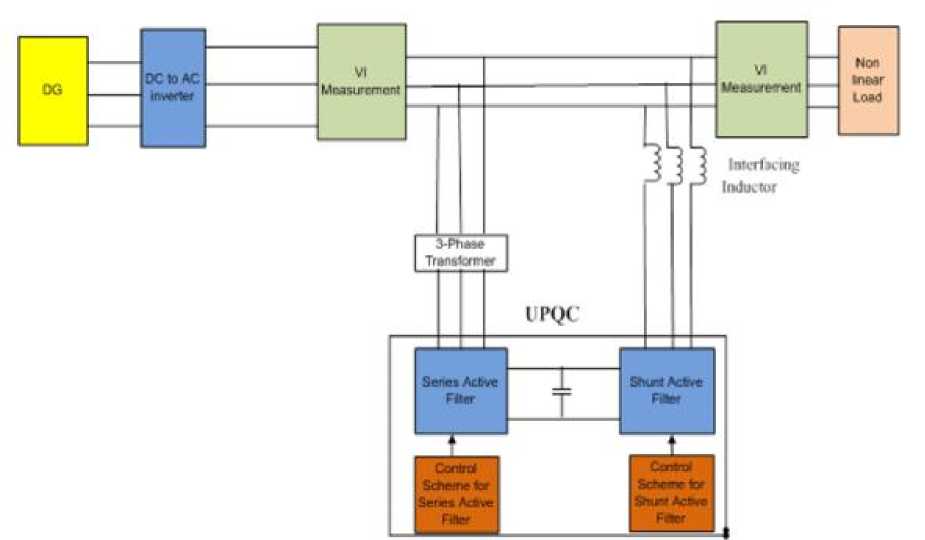
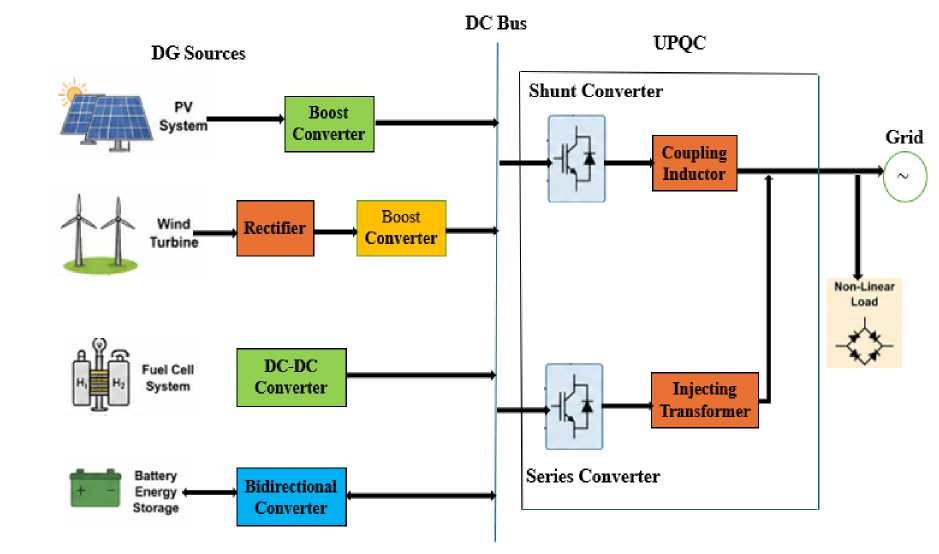
Fig. 1. Diagram of DG with UPQC blocks
Consumers' and utility equipment's power flow and voltage conditions might be drastically altered by deploying DG on distribution networks. Three primary factors are now driving the expansion of dispersed resources to produce electricity. First, a variety of sources, including co-generation (CHP) and renewable sources, might be utilized. A second component is associated with the fact that new transmission and distribution infrastructure presents more difficulties than before, and that certain critical sections of the grid already have very high levels of electricity flows.
The last component is associated with the increasing number of activities that demand high-power quality standards. Levels like these are not achievable with the current distribution systems.
Different kinds of DG systems include:
Solar PV
The use of solar PV systems has become more popular in recent years. Solar PV panels harness solar energy and transform it into electricity that may be used to power buildings. When exposed to sunlight, photovoltaic solar systems produce dc electricity, which is then sent to the utility grid through inverters. The inverters in these systems can only function when connected to the grid, making them incapable of operating independently.
Wind turbines
The power produced by wind turbines is another sort of DG system. To generate power, wind turbines use the rotation of the blades to operate a generator. Power from large farms is sent between each other rather than distributed to individual customers. There have been proposals for smaller farms, between 6 and 8 MW, to be linked directly to distribution feeders for use like those at ski resorts. Voltage control is the most significant power quality concern when using wind power. Wind power plants are often sited in rural locations with limited population densities and inadequate infrastructure to provide large-scale electricity demand. Voltage fluctuations because of this are difficult to control. Because of this, it might be difficult to service loads from the same feeder as a wind farm.
Fuel cells
An electrochemical process may be powered by hydrogen in a fuel cell, which is essentially a battery. It generates dc voltage, therefore connecting it to the standard ac grid necessitates an inverter. Additionally, fuel cell technology operates quietly, produces few if any harmful emissions, and takes up a tiny footprint. To obtain one of the highest potential energy-conversion efficiencies, fuel cells may be used in combined heat and power applications in addition to their role as efficient electricity generators.
2.2. The factor of harmonic production
Power quality is significantly impacted by harmonics, which are a natural byproduct of every electrical system. Harmonic distortion and imbalance impact not only the voltage and current neutral points but also the phase components and electrical power of the system.
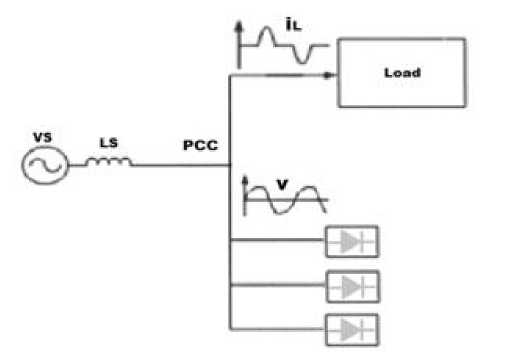
Fig. 2. Block diagram of voltage harmonics
There are several ways in which the electrical network has been affected by the increasing number of power electronic devices and the requirement for nonlinear loads with high capacities, such as an increase in the harmonics injected into the power system. The system is damaged due to the high THD of the nonlinear loads. The generation of harmonics is greatly impacted by small groups of nonlinear loads, such as electric arc furnaces, inverters, DC converters, electric drives, and others. Due to the growing deployment of induction generators in the consumer zone, new grid providers, such as wind farms, now face the challenge of harmonic generation and injection. In induction generators, electrical converters are the primary cause of harmonic aberrations. Figure 2 depicts an example of voltage harmonics.
2.3. Unified Power Quality Conditioner (UPQC)
UPQC is a well-known example of a custom power device that can deal with current and voltage problems at the same time. When the UPQC is connected before the load, distortion in the load voltage may be eliminated and the sourceside reactive current can be balanced with the supply voltage.
When both voltage and current correction are required simultaneously, the UPQC employs a shunt active filter and a series active filter. The distribution and sub-distribution are meant to be separated from the harmonic by the series component. The opportunity to adjust the filter equalization voltage, harmonic voltage, and unbalanced voltage is also presented at the network connection point. The shunt component's principal functions in reducing consumer issues are to rectify reactive power, change the DC link voltage, absorb harmonic currents, and compensate for the negative sequence.
Both the shunt and the series components may influence UPQC's efficiency.
The UPQC consists of a pair of voltage source inverters wired in series through a common DC connection. Installing the UPQC shunt converter as near to the non-linear load as possible, instead of on the network side, is necessary when a series inverter is linked between the source and PCC via a transformer. The UPQC requires two distinct DC-link voltages, one for the series active filters and the other for the shunt active filters. A common DC-link is necessary for effective shunt and series compensation, but designing one is difficult. The DC link voltage required for correction is lower with the series active filter compared to the shunt active filter. Only one DC-link voltage can be used by researchers to compensate for the shunt and series active filters.
To meet this need, it was proposed to increase the DC-link voltage using a UPQC design. Voltage source inverters (VSIs) become bigger as DC-link capacitors get larger and as more powerful switches are needed to handle increased voltage and current. Both the overall cost and size of the VSI are affected by this. The DC-link voltage storage capacity has been the subject of numerous published methods for reduction. All three phases and all four wires are addressed by the neutral clamped topology. Even though capacitor voltage balancing is still necessary, this design enables each leg to independently control the series and shunt inverters. In a four-legged VSI design, the shunt active filter was introduced for three-phase, four-wire systems. Capacitor voltage balancing is not allowed, but independent control of the multiple inverter legs is possible with this design. The authors suggested a new three-phase VSC-based DSTATCOM and T-connected transformer to fix the problems with the four-legged topology. However, the UPQC becomes larger and more expensive with this setup because a second transformer is needed [7].
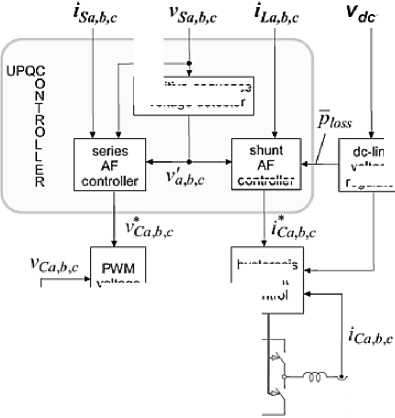
Figure 3 shows the main components of positive voltage sequences as V'a, b, c, iS a,b c, and the input parameters of the series part controller are VSa,b,c. The voltage across the DC link is denoted by Vdc, while the current through the stabilizer is VC a, b, and c. By using Clark's matrix conversion, we may get V'α,β and i'α,β.
controller
positive-sequence voltage detector
hysteresis current control
voltage regulator
voltage control
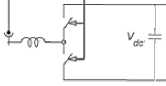
Fig. 3. The controller's block diagram
[VV’’αβ] = √ 2 3
[ii’’αβ] = √ 2 3
-1
-1
-1
-
-
-
V’a [V’b] V’c
[iiibac]
The results may be used to determine the real and imaginary components of power using equations (3) to (6).
A = V’α “I α + V’ β I β(3)
b = V’β I α – V’α(4)
A = A̅ + Â(5)
b= b̅ + b̂(6)
The constant components of power, A̅and b̅, can be analyzed using equations (7) and (8) in the given relationships:
A = E"=i 3V+p I+p cos(Ф+p-8+p) + Sp=i 3V-p I-p cos(Ф-p-8-p)(7)
b = £"=i 3V+p I+p sin(Ф+p-8+p) + £"=i 3V—p I-p cos(Ф-p-8-p)(8)
Subsequent equations determine  and b̂ as the power-swinging mechanisms:
A = {l”=i+[Zp=i 3V+q I+P cos((mq — mp)t + Ф+q — 8+p)] +EQ=i[E"=i 3V-q I-p cosUoq - d^P rnp)t + (Ф-q - 8-p)] + {l“=1+[Ip=1 -3V+q I-p cos((raq + cop)t + Ф+q + 8-p)] +
{Z”=i+[Zp=i -3V-q I+p cos((mq + rnp)t + Ф-q + 8+p) ]}} b = {£"=1 +[ E"=i 3V+p I+q siniinq - rnp)t + Ф+q - 8+p)] +£"=i[ E"=i - 3V-q I-p siiiiioq -
Q^P cop)t + (Ф-q - 8-p)] + {E"=i + [E"=i -3V+q I-p sin((rnq + rnp)t + Ф+q + 8-p)] +
{z "=i +[ Z "=i -3V-q I+p siniinq + rnp)t + Ф-q + 8+p) ]}
The signal of p ̅loss is controlled by the DC voltage regulator, which should be mentioned. The active filter will respond to the signal of p ̅loss by absorbing or injecting positive sequence power to avoid voltage fluctuations. To rephrase, to maintain a constant DC voltage, the shunt active filter must take in the same amount of power from the source in the positive cycle as it generates in the negative series. To maintain energy equilibrium in the active filter, the p-loss signal is critical.
3. Control Methodology
3.1. A Grid-connected PQE Control Strategy Using Active and Reactive Mechanisms
The suggested IBSMFO control scheme of RES, shown in Figure 4, can enhance the MG system's Power Quality (PQ). To address this, we offer a control strategy that combines the IBSA and MFOA methods. The renewable energy sources (RES) described in the proposal consist of batteries, fuel cells (FCs), wind turbines (WTs), and solar photovoltaics (PV). This is the process of transferring electricity to the DC bus. In addition to optimizing electrical energy research and load parameters, this framework also optimizes grid-side parameters for dynamic optimal power quality. The design also specifies a RES unit that is based on a VSI and Power Quality Enhancement (PQE) control module. In this instance, the proper power control mode is implemented via VSI. The grid and RES must modify their power balance in response to variations in load demands. Harmony is required between the "fuel cell, main grid, and Solar PV array." Both active and reactive power are controlled by the grid-connected working mode regulation, which will be discussed in more depth later.
Coordination of grid, fuel cell, and solar photovoltaic power generation with load demand is essential.
P hREsW = ^ ^ WT (f) + ^ PV(t) + ^ FC^ ) + ^ Bat^ ) (11)
I
"The overall power production from the renewable energy sources accessible at that moment is represented as follows. PHRES(t) " The power demand of the system, which controls both active and reactive power, is utilized to determine
(Fcrid^ and ^Load1^ in both grid-connected and load-connected modes.
^Grid^) = ^Load^ — ^HRES^
^Load^ = ^HRES^ + ^Grid^)
QGrid(t) = QLoad(t) — QHRES(t)(14)
QLoad^ = QhRES(V + QGrid(V
When the system operates "in the grid-connected mode" by controlling the voltage and frequency, the active and reactive power management strategy is implemented. Furthermore, solar irradiance controls the PV, and the battery powers the WT sections.
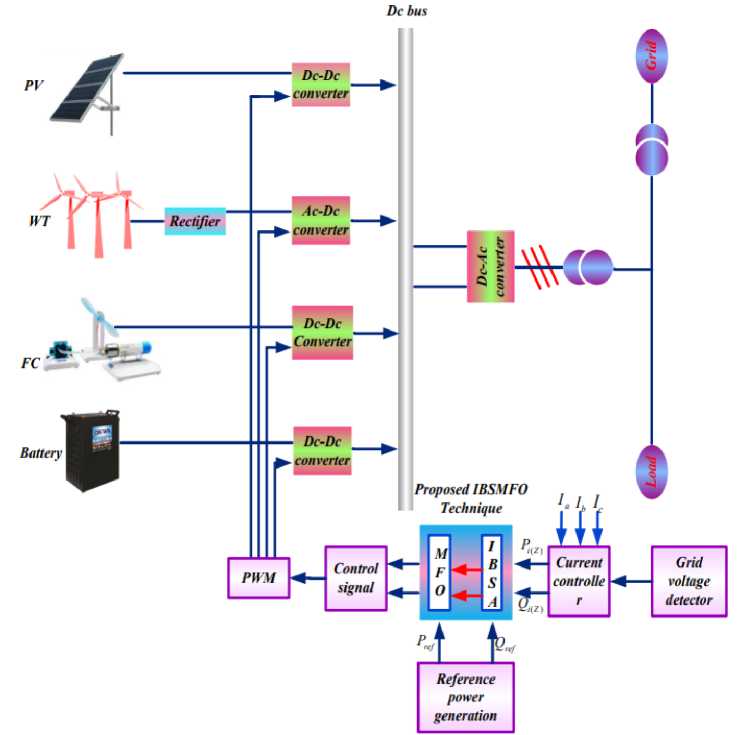
Fig. 4. Control Structure Featuring the Suggested Controller
3.2. Power and current management plan
In addition to supplying active and reactive electricity to the load, this method manages power quality problems between the utility and the grid. The ideal controller design for restoring PQ "in the Micro Grid system, which is based on the combination of the two PI regulators" is depicted in Figure 5. This is further ensured by the slight but steady changes of the reference current trajectory. Additionally demonstrated are a PQ control method and an IBSMFO-based DG unit. This IBSMFO offers the best control settings in addition to effectively releasing qualified reference current vectors. When a distributed generating "unit joins the grid or sees a change in demand," the grid must supply both its reactive and active electricity. Based on the corresponding reference values, the equation enables the controller to control the inverter's active and reactive power outputs, ( re f^ and Qre f (t) ), and it also achieves decoupling between the two types of power effectively. The reference vectors DQ are used to state the current here.
№ = (P ref (t) - P 1 (t) *
(<4)
IqO) = (Q reftt ) - Q 1O ) *
M)
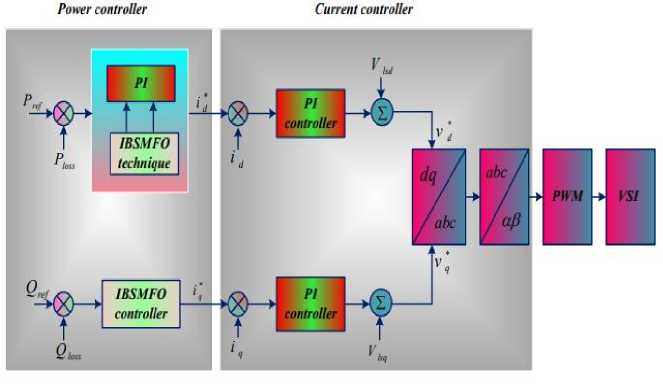
Fig. 5. Suggested Controller for Raising PQ
The proposed controller aims to suppress inverter output current transients and achieve accurate tracking. While the grid voltage feed forward loop generates steady-state and inverter current loops as well as dynamic performance, two PI regulators reduce the current error. Hence, the controller's output signal is the reference voltage signals from the DQ frame.
-
3.3. PQE Based on IBSMFO
Improving PQ was the goal of the presented study, which used both the IBSA and the MFO" methods [8]. Together, the IBSA and the MFO algorithm improve the PQ by determining the ideal "gain parameters" and improving the IBSA's searching behaviour. The Bat algorithm is a kind of meta heuristic that draws extensively on natural phenomena. Idealizing bat echolocation activity which encompasses microbat behaviour and echolocation acoustics is the first step in building bat algorithms. This study found that to increase PQ while decreasing the error function, improved BA is used [9]. Minimizing system errors and optimizing PQ improvement were both achieved through careful adjustment of the PI environments. To find the objective function, the next part examines the bat method step-by-step.
To improve the reproducibility of the proposed optimization-based controller, the implementation details of the improved binary search moth-flame optimization (IBSMFO) algorithm are presented in this section. The IBSMFO algorithm combines the global exploration capability of the improved binary search algorithm (IBSA) with the exploitation capability of the moth-flame optimization algorithm (MFOA). The two search mechanisms are not applied independently; instead, IBSA is used to generate diversified candidate solutions and guide the population toward promising regions, while MFOA subsequently performs local exploitation around the best candidate solutions.
The complete implementation of the proposed IBSMFO algorithm consists of the following sequential operations. First, the objective function, population size, decision-space dimension, lower and upper search boundaries, and maximum number of iterations are defined. An initial population of candidate solutions is then randomly generated within the prescribed search boundaries, and the objective function is evaluated for all candidate solutions. The candidate with the best objective-function value is selected as the initial global best solution, and the iteration counter is initialized. During each iteration, the IBSA control coefficient is first updated according to the predefined adaptive rule. The IBSA exploration mechanism is then applied to each population member to generate new candidate solutions. The generated solutions are checked against the corresponding lower and upper limits to ensure that all decision variables remain within the feasible search region. The objective function of each new candidate is subsequently evaluated, and a greedy selection strategy is applied by comparing the newly generated solution with its corresponding previous solution; the solution providing the better objective-function value is retained. After completion of the IBSA exploration stage, the resulting population is sorted according to the objective-function values, and the corresponding flame population is established for the MFOA stage. The number of active flames is determined according to the predefined flame-reduction strategy. Subsequently, the MFOA spiral-search mechanism is applied, in which each moth updates its position with respect to its corresponding flame using the prescribed spiral function and randomly generated spiral parameter. The newly generated moth positions are again checked against the specified search boundaries, and their objective-function values are evaluated. A second greedy-selection operation is then performed between the previous solutions and the newly generated MFOA solutions, retaining the solutions with superior objective-function values. The global best solution is updated after the completion of both the IBSA exploration and MFOA exploitation stages. The iteration counter is then increased, and the same sequence of operations is repeated until the maximum number of iterations is reached. At termination, the final global best candidate solution and its corresponding objective-function value are returned as the optimized result. Therefore, the proposed IBSMFO algorithm employs a sequential hybrid search strategy in which IBSA performs global exploration and maintains population diversity, while MFOA subsequently performs exploitation around the promising solutions identified by IBSA. This implementation establishes a direct interaction between the two optimization mechanisms and provides a clear and reproducible search process for determining the optimal controller parameters.
The above procedure explicitly defines the order of the two optimization operators and therefore avoids ambiguity regarding whether IBSA and MFOA are alternated, weighted, or nested. In the proposed implementation, IBSA is followed by MFOA within every optimization iteration, and greedy selection is applied after each search stage.
Optimisation of PQE Gain Parameters using IBSMFO
Step 1: Initializing the Algorithm The reactive and real powers are provided as starting values. The values of the gain parameters Kp and Ki are first decided by creating an equation at random, as seen below.
к^1 к^к?...
Xt = к^к^ к™к?2...
I к р1 к р1 к^к ^ 2...
к^к^ ■ к2пк^ крик?™
I
Step 2: Assessment of Fitness: In order to minimize the system's error, the goal function evaluates fitness and is expressed as,
Obj^ = Min Е(х) (19)
Where E(x) is the system's error function. After the objective function is evaluated, optimization is performed by making appropriate modifications to Kp and Ki.
Step 3: In this stage, known as "Solution Generation," a new solution is created by changing the pulse frequency while maintaining a constant wavelength. Optimization requires the definition and updating of the bat's location (xi) and velocity (vi).
Fi Fmin + (Fmax Fmin) X 77 (20)
When η is "represented as the range of [0, 1] randomly drawn, the optimal spot is X^*."
Step 4: "MFOA-guided local search: The transverse condition that moths use to navigate their natural surroundings is the primary motivation for the MFOA, a new optimization paradigm [10-13]. To construct the IBSA's search behaviors, MFOA will be used in this study. A moth's natural habitat is near a flame, and in MFOA, it acts as a search agent. In this situation, we choose one of the solutions given by the following equation from among the ones that are already in existence.
Xnew = (-1) + Xold * (- ^
Step 5: To get the most up-to-date location of the moth on the map, use the following equation:
XlJ = S(Xl,Fj)(22)
In this case, F j represents the jth flame, Xi the ith moth, and S the spiral function. The following is a summary of the most up-to-date optimum location determination using the number of flames:
/ N — 1\
U = round (N — 1 * —-—)(23)
where "l" denotes the current iteration count, "T" denotes the maximum iteration count, and "N" denotes the maximum flame count.
Step 6: Termination: The computation is complete if and only if all iterations have reached the stopping condition; otherwise, Steps 2 and 4 must be restarted. The following is a result of an error reduction process that was carried out to enhance PQ:
|
Г E 11 Ie 21 L E m1 |
E12 ... |
E 1n] |
G^G^1 |
G^G? ... |
G - n G 1 n |
|
|
E22. |
E2n 1 -- |
G^G j 1 |
G22Gj ... |
G^G j GmnGmn\ |
(24) |
|
|
Em ... |
EmnJ |
[ G^G ^ 1 |
G^G^... |
|||
Once the preceding steps of the algorithm are completed, the system achieves its purpose of enhancing the PQ of the proposed system by finding the optimal gain factors while taking limit faults into consideration.
Signal-Flow Description of the Proposed Control Structure
The signal flow of the proposed IBSMFO-based control system consists of four principal stages: measurement, reference-frame transformation and power calculation, optimization-based PI tuning, and converter control.
First, the three-phase voltages and currents are measured from the electrical system. These signals are supplied to the Clarke transformation block, where the (abc)-frame variables are converted into the stationary (\alpha\beta) reference frame. The transformed voltage and current components are then used to calculate the instantaneous active and reactive powers.
Second, the calculated electrical quantities are compared with their corresponding reference values. The resulting tracking errors are supplied to the PI-control structure. The PI gains and, where applicable, the pulse-frequency-related control parameter are optimized by the IBSMFO algorithm.
Third, the IBSMFO controller evaluates candidate parameter combinations using the defined objective function. The IBSA stage performs global exploration, followed by the MFOA spiral-search stage for exploitation. The best parameter vector obtained from the optimization process is supplied to the PI controller.
Finally, the PI-controller output is converted into the required modulation or switching commands for the power-electronic converter. The converter generates the required switching states, which modify the electrical variables of the controlled system. The resulting voltage and current are measured again, closing the feedback loop.
Recent studies have demonstrated the increasing application of advanced optimization and intelligent control techniques for improving UPQC performance. Heenkenda et al. [14] presented a comprehensive review of different UPQC structural configurations and control approaches, highlighting the importance of advanced control strategies for achieving effective power-quality compensation. Srilakshmi et al. [15] proposed a multiobjective neuro-fuzzy controller combined with Predator-Prey Firefly and Enhanced Harmony Search optimization for UPQC controller design and filterparameter selection, demonstrating the potential of hybrid optimization techniques for improving harmonic mitigation and overall system performance. Palanisamy and Thangamuthu [16] investigated an optimized UPQC strategy for powerquality improvement in distribution systems, emphasizing the effectiveness of optimization-based controller tuning. Similarly, Venkatesan et al. [17] developed an optimized fractional-order PID-based UPQC for grid-connected hybrid renewable-energy systems and demonstrated improved power-quality performance under renewable-energy operating conditions. These studies confirm the growing trend toward optimization-assisted, intelligent, and hybrid control techniques for UPQC applications, while also motivating the development of more efficient hybrid metaheuristic strategies such as the proposed IBSMFO.
-
4. Simulation Results
The simulations for this inquiry are undertaken in MATLAB/Simulink software, which incorporates the recommended technology. In this made-up process, we improve the reactive and real power quality using the IBSMFO approach. The proposed approach then generates the switching signals, which are used to construct the pulses required for the DC/DC converters. The proposed technique is used to correct severe PQ issues in the converter.
We analyzed two cases in this section: (i) a balanced power supply under unbalanced load conditions, and (ii) an unbalanced supply under the load condition listed below. In the first case, we considered a variety of factors, including wind turbine, fuel cell, battery, grid, solar PV irradiance and power, and solar PV power. There are two distinct approaches to dealing with the second case; we'll go over both approaches (modes A and B) below.
To ensure a fair and reproducible evaluation of the proposed IBSMFO-based control strategy, all simulation and experimental tests are performed under identical operating conditions. The complete system configuration and simulation parameters are summarized in Table X. The table includes the rated system voltage, rated power, DC-link voltage, filter inductance and capacitance, switching frequency, sampling frequency, simulation time, solver type, solver step size, and controller implementation parameters. The optimization parameters, including population size, maximum number of iterations, decision-variable boundaries, and objective-function definition, are also specified. For all stochastic optimization algorithms, the same population size, iteration limit, search boundaries, objective function, and stopping criteria are employed to ensure a fair comparison. A fixed random seed is used for the optimization experiments so that the reported results can be reproduced under the same computational conditions. In addition, the MATLAB/Simulink model and the corresponding algorithm implementation are organized using the same initialization and evaluation procedures for all compared methods. The computational hardware and software environment used for the simulations are also reported to eliminate ambiguity associated with the implementation environment.
The performance of the proposed IBSMFO algorithm is evaluated against both conventional and recent optimization-based approaches. The original comparison includes artificial bee colony (ABC), gravitational search algorithm (GSA), and firefly algorithm (FA). To provide a more meaningful evaluation, additional recent optimization methods reported in the recent literature are considered where their optimization structure and application objectives are compatible with the proposed controller. All algorithms are evaluated using the same objective function and identical controller search boundaries. Furthermore, the population size, maximum number of iterations, initialization procedure, stopping criterion, and number of independent trials are maintained consistently across all optimization methods. Therefore, the comparison reflects the effectiveness of the optimization strategy itself rather than differences caused by unequal computational budgets or parameter settings.
The performance of each controller is evaluated using several complementary indices, including total harmonic distortion (THD), steady-state error, peak overshoot, rise time, settling time, and computational convergence characteristics. The transient responses are plotted over the same time scale and under identical disturbance and operating conditions. In addition, the steady-state region is separately examined to quantify the residual tracking error after the transient response has decayed. This provides a more complete assessment of both transient and steady-state control performance. Table 2 shows the system parameters.
Table 2. Simulation, Control, and Optimization Parameters
|
Parameter |
Symbol |
Value |
|
Rated voltage |
^ rated |
400 V |
|
Rated power |
^ rated |
10 kW |
|
Grid frequency |
f g |
50 Hz |
|
DC-link voltage |
vdc |
700 V |
|
DC-link capacitance |
C dc |
2200 µF |
|
Filter inductance |
4 |
2.5 mH |
|
Filter resistance |
R f |
0.1 Ω |
|
Filter capacitance |
Cf |
10 µF |
|
Switching frequency |
fsw |
10 kHz |
|
Sampling frequency |
f s |
20 kHz |
|
Sampling time |
T s |
50 µs |
|
Modulation technique |
— |
SPWM |
|
Simulation duration |
Tsim |
1 s |
|
Solver |
— |
ode23tb |
|
Solver type |
— |
Variable-step |
|
Maximum step size |
T . 1 step |
1 x 10⁻⁶s |
|
K p lower bound |
p,min |
0.01 |
|
/Ср upper bound |
Kp,max |
10 |
|
K t lower bound |
i,min |
0.01 |
|
K i upper bound |
n i,max |
100 |
|
Pulse-frequency lower bound |
fp,mln |
500 Hz |
|
Pulse-frequency upper bound |
fp,max |
5000 Hz |
|
Population size |
N |
30 |
|
Maximum iterations |
1 max |
100 |
|
Search dimension |
D |
3 |
|
Initial IBSA coefficient |
^ max |
1.0 |
|
Final IBSA coefficient |
^ mln |
0.1 |
|
Spiral constant |
b |
1 |
|
Spiral parameter range |
I |
[-,11] |
|
Initialization |
— |
Uniform random |
|
Boundary handling |
— |
Saturation |
-
Case 1: A balanced power supply under an imbalanced load
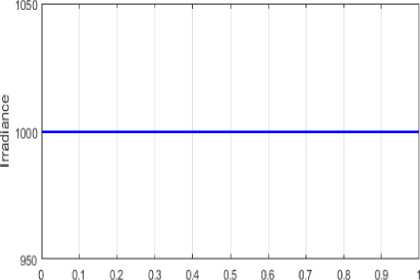
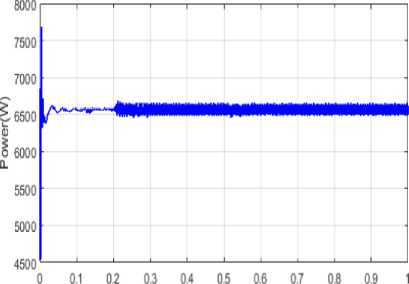
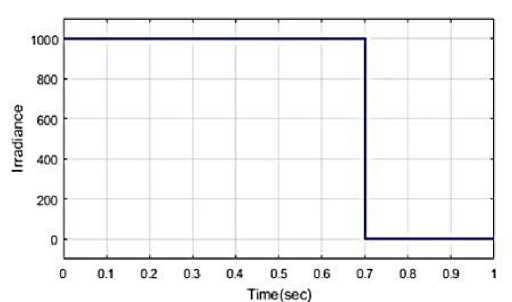
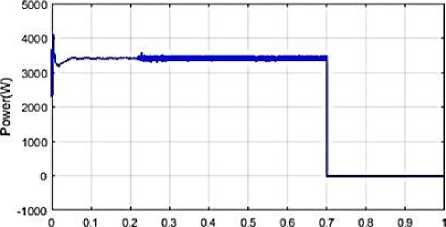
Examining how the power controller handles an unbalanced load is the main objective of the first scenario. Figure 6(b) shows the power output and Figure 6(a) shows the irradiance of a solar photovoltaic system over time. From t=0 to 1 second, the irradiation under Solar PV stays constant, within a factor of a thousand. Solar photovoltaic arrays produce no electricity at all when first installed, as shown in Figure 6 (b). After t=0.25 sec, the solar PV system's output stays the same.
Time (sec)
Time(sec)
(b)
(a)
Fig. 6. Solar photovoltaic (PV) irradiance and power analysis
Figure 7 (a)-(d) below shows the results of the power analysis for the solar PV system, wind turbine, fuel cell, battery, and load. The power (w) and time (in sec) axes are used for analysis in Figure 7(a)-(d). Solar PV maintains a high production of 3500 W at t=0.023 sec, and then declines suddenly at t=0.08 sec. The maximum power of WT, which is 4200 W, is maintained at time t=0.01 sec and then drops dramatically at time 0.023 sec. The FC's maximum output remains constant at 1500 W at t=0.01 sec, before suddenly decreasing at t=0.03 sec. The battery power exhibits a maximum variation of 14,000 W at (t = 0.01) s, followed by a significant reduction at (t = 0.02) s. When the system transitions to grid-connected mode of operation, the electricity produced by the grid is shown in Figure 7(e). Figures 7(e) and (f) show the load and grid functioning in an unbalanced condition. Power from the grid is 2 kilowatts (kW) at time t= 0.25 seconds and will stay that way until the procedure is finished. Until the procedure is finished, the load stays at its maximum power of 3500 W, which it reaches at time t= 0.25 sec.
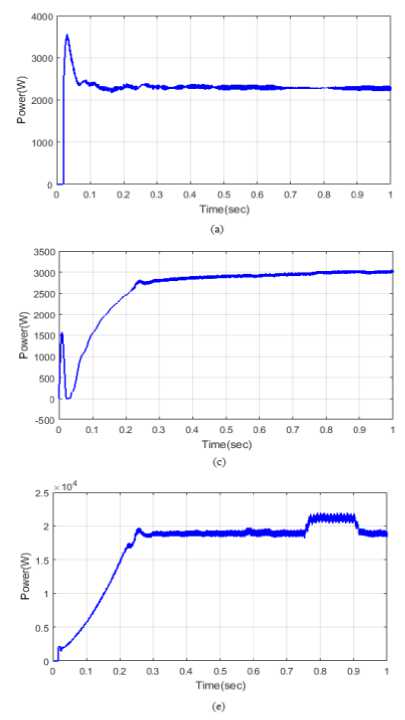
Fig. 7. Power analysis of different energy sources, along with loads, the grid, fuel cells, wind turbines, and solar PV.
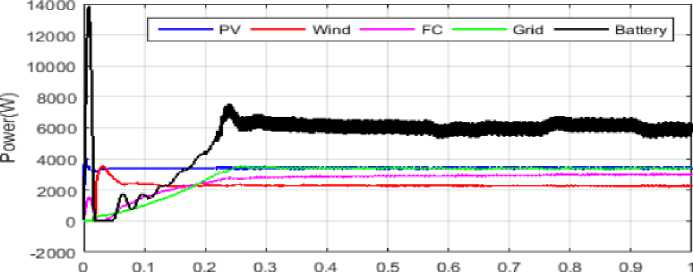
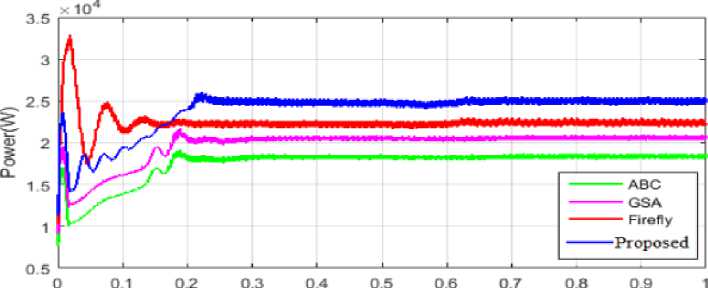
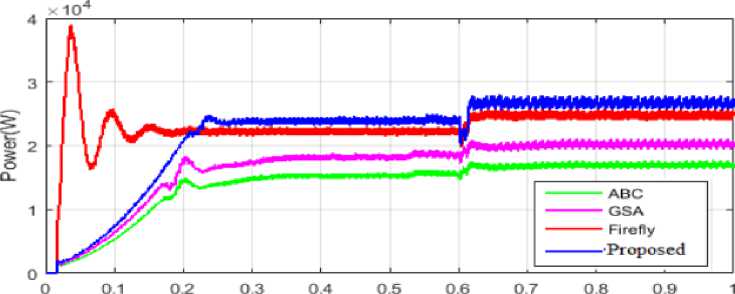
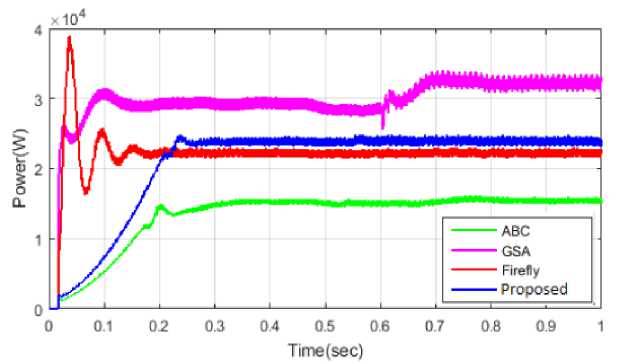
Figures 8(a), (b), and (c) accurately illustrate "the total power with the proposed controller," "a comparison of the total power," and "a comparison of the power extracted from the load as stated below," in that order. Figure 8(a) shows the power transfers from several sources, arranged from highest to lowest: solar PV, wind, FC, the grid, and batteries (7,800 MW). The unique methodology is evaluated using existing techniques including ABC, GSA, and FA. Figure 8(b) and (c) provide a comparison of "total power and load power as the load varies". Here, the suggested method reduces the "peak overshoot time" to zero. As an example, the suggested ABC, GSA, and FA methods would have settling times of 0.4 seconds, 0.22 seconds, 0.28 seconds, and 0.03 seconds, respectively, and rising times of 0.04 seconds, 0.03 seconds, and 0.028 seconds, respectively. According to the previous comparative study, the suggested approach significantly reduces the rising, settling, and peak overshoot times when compared to the existing method.
Time (sec)
(a)
Time(sec)
(b)
Time(sec)
(c)
Fig. 8. (a) Proposed method analysis of total power (b) Comparison of total power (c) Comparison of load power
-
Case 2: Supply Unbalance Under Balanced Load Conditions
The proposed setup keeps "active and reactive power" in a constant state of PQ balance. Slowly altering the reference current/voltage trajectory has achieved the inverter's control" aim and produced high-quality output power. The enhancement of PQ is guaranteed by considering both the balanced load and balanced supply circumstances. Solar PV variations inform two sets of analyses. Two possible responses from the solar system are (i) a step reaction, which is Mode A, and (ii) no response at all, which is Mode B.
System A: Step-by-step reaction
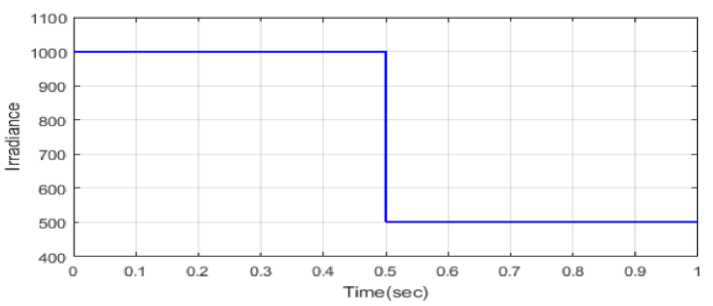
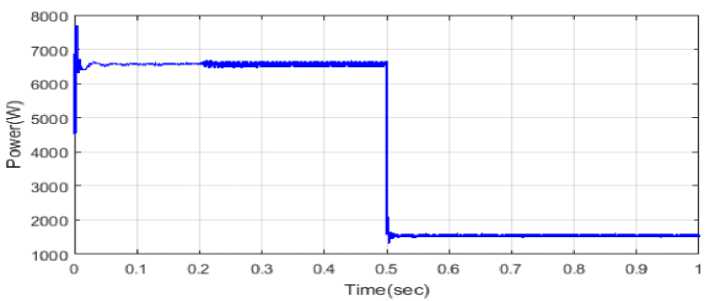
Presented below is an analysis of the power generated by solar PV, WT, FC, and batteries. Figure 9(a) and (b) show the uneven power and irradiance of solar photovoltaics. Figure 9(a) shows that under step irradiation conditions, solar PV produces 1000 watts/sq m from t=0 to half a second, and 500 watts/sq m from half a second to one second. In an unbalanced load situation, Solar PV power generation using the recommended technique is shown in Figure 9(b).
(a)
(b)
Fig. 9. Results of (a) Solar radiation and (b) Solar electricity
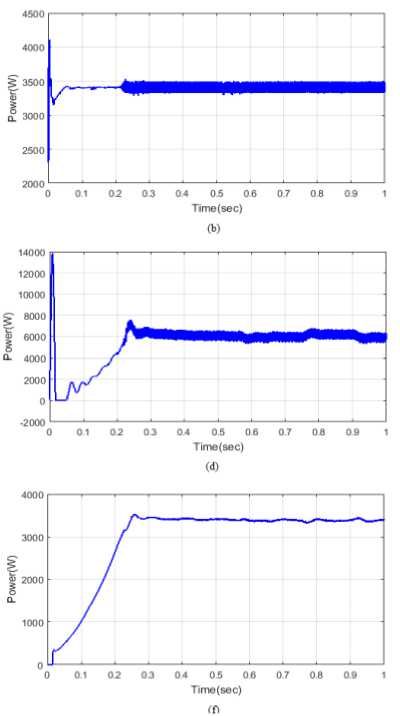
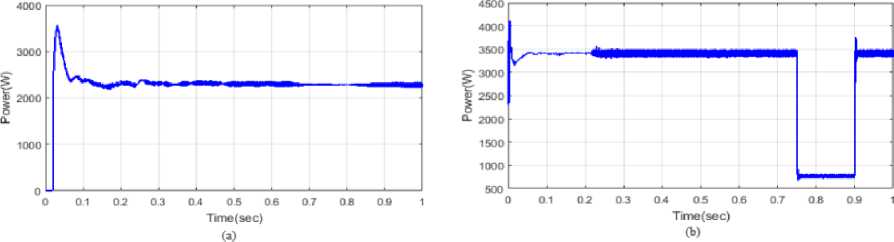
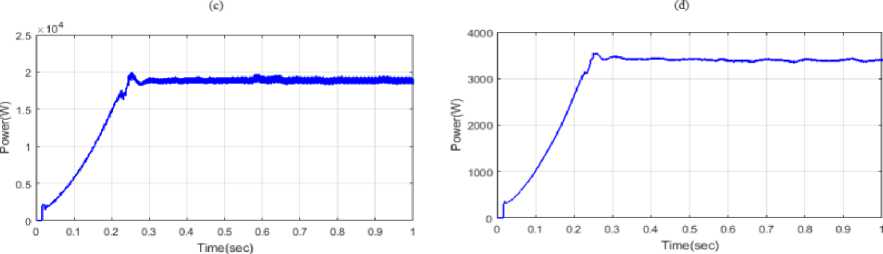
The WT, solar PV, FC, battery, grid, and load are shown in Figure 10 (a)-(f) at their highest outputs. Power generation from solar photovoltaic cells peaks at 3500 W at t=0.02 sec and falls to 2500 W at t=0.06 sec. In this scenario, the maximum power of WT is 4100 W at the onset and may decrease to 3250 W within 0.2 seconds (Figure 10(b)). In Figure 10(c), you can see the energy extraction from the FC. The first stage of the proposed method involves using the FC to extract 1500 W of electricity without oscillations. During periods of uneven load, the 2700 W of power that is normally given fluctuates somewhat. While Figure 10(d) shows that the battery's power peaks at 14,000 W at t=0.01 sec and then drops dramatically at 0.02 sec, Figure 10(e) and (f) show the load and grid's operation in an imbalanced state. At time t= 0.25 sec, the grid power is 2 kW and will stay that way until the operation is finished. At 0.25 seconds, the peak load power is 3500 W, and it stays constant throughout the operation.
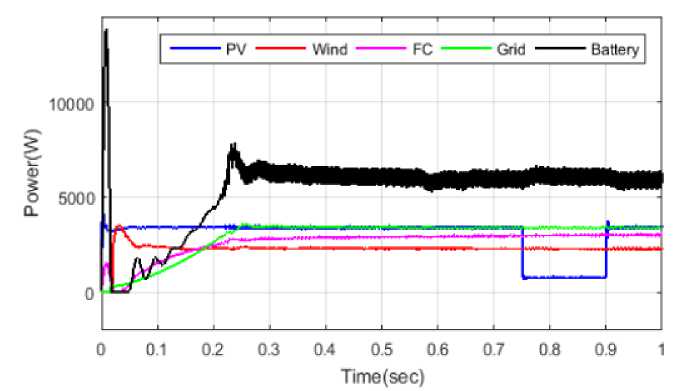
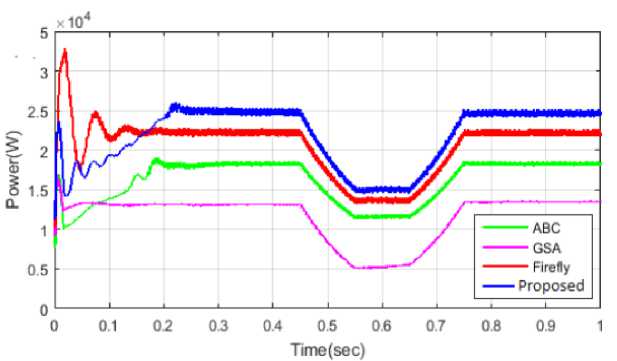
Figure 11(b) compares the total power generation achieved by using various PQE strategies to that achieved by utilizing the methods proposed in Figure 11(a) for producing total power. To generate the necessary amount of power, the suggested control method employs renewable energy sources, energy storage, and the grid. Since it is unnecessary, the 1.5104 W of power generated by the ABC goes to waste. Even though the FA method continues to generate power after the operational state ends, its performance is insufficient. See Figure 11(c) for a comparison of power under different loads. The GSA-based controller shows several small inconsistencies, and the ABC fails to meet the load requirements due to inadequate energy generation. The FA method's high-power production demonstrates that it does not account for load fluctuations. Figure 11 shows that, in comparison to existing approaches, the proposed strategy significantly improves the PQ of an energy storage-based smart grid system.
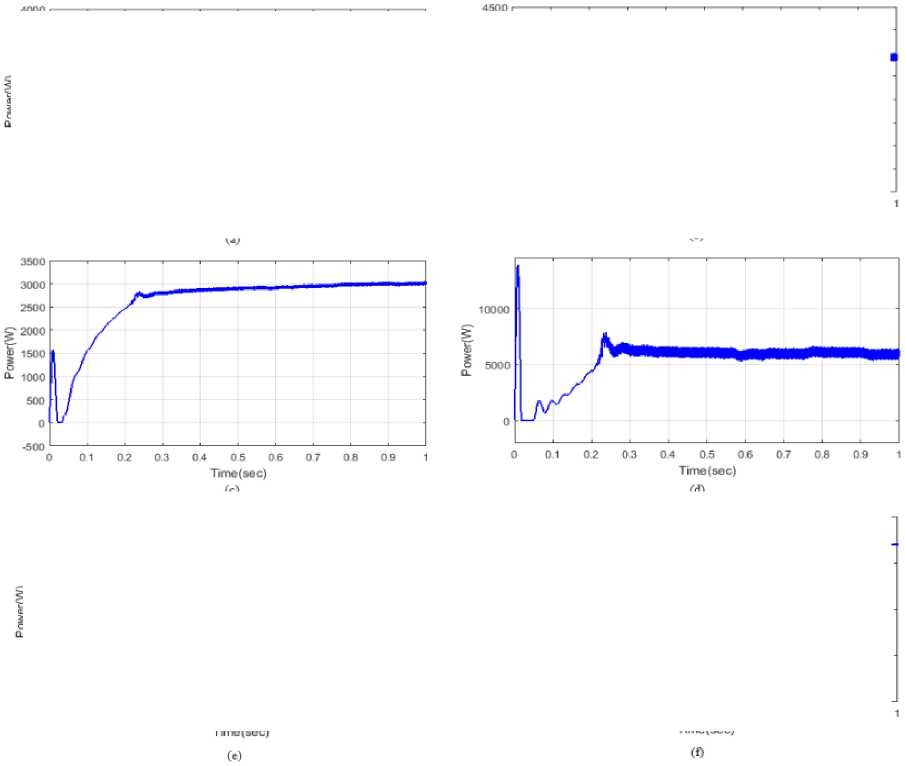
Fig. 10. A power diagram showing (a) solar the grid and load (f) fuel cells (d) batteries (b) WT
Mode B Solar system has no reaction
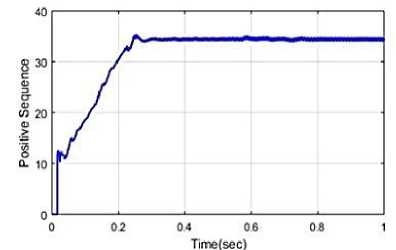
Figure 12 (a-c) provides an example of the zero-response study performed on solar photovoltaic systems. The caption states, "It displays the regulated total power flow that was created in combination with the power flow from the solar photovoltaic panels." Both the suggested and current approaches use the graphic to look at battery power and overall power. As a result, it is evident from the figure below that the suggested approach was effective in obtaining the optimal PQE and maximum power.
(a)
(b)
(c)
Fig. 11. (a) Proposed method analysis of total power (b) Comparison of total power (c) Comparison of load power
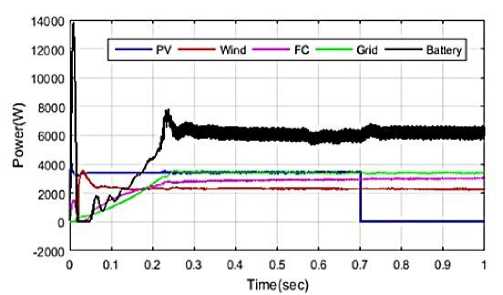
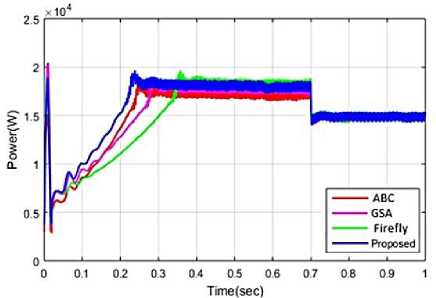
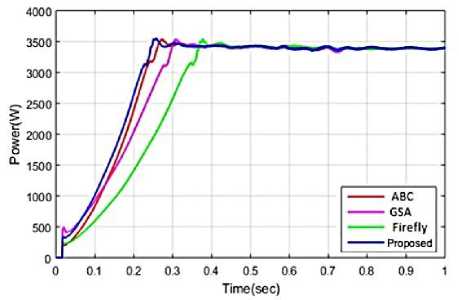
A power load, an assessment of total power, and total power using the suggested method are depicted in Figure 13(a)-(c). Figure 13(a) illustrates the power fluctuations of a variety of sources, including solar power, wind power, fuel cells, the grid, and batteries, with capacities ranging from 4000 W to 7800 W. Standardized approaches like ABC, GSA, and FA are used to assess the new method. Figures 13(b) and (c) show how "total power and load power as the load fluctuates" are related. In this section, we employ the suggested technique to reduce the "peak overshoot time" to zero. The settling times for the recommended ABC, GSA, and FA approaches are 0.22, 0.28, 0.32, and 0.4 seconds, respectively. For the same techniques, the equivalent rising times are 0.04, 0.03, 0.028, and 0.03 seconds. The results of the comparison research show that compared to the current technique, the proposed methodology drastically cuts down on rising time, settling time, and peak overshoot time.
(a)
Time(sec)
(b)
(c)
Fig. 12. Efficiency of solar (a) Power, (b) Radiance (c) Voltage of inverter
(a)
(b)
(c)
Fig. 13. Examining (a) Total power using the suggested technique, (b) comparing total power, and (c) comparing load power
Figures 14 and 15 show the harmonic waveforms of the voltage and current, respectively. Here, THDi= 8.99 and THDv= 18.01 represent the current and voltage total harmonic distortion (THD) rates, respectively, under these conditions. Due to the present power quality, the system is experiencing sthenic issues and cannot continue to function properly.
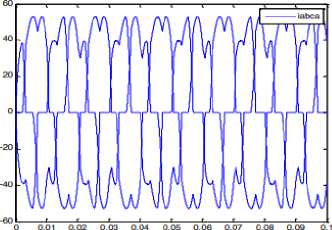
Time (sec)
Fig. 14. Form of the current wave when a harmonic source is present.
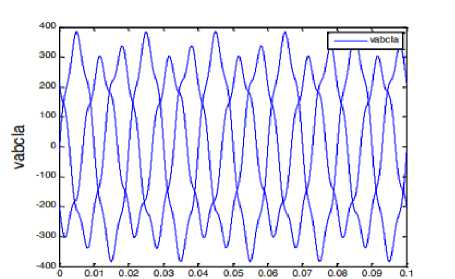
Time (sec)
Fig. 15. Current waveform when a harmonic source is present.
Table 3. Statistical Comparison of Optimization Algorithms over Five Independent Runs
|
Algorithm |
THD (%) |
Objective Function |
Steady-State Error (%) |
Settling Time (ms) |
Peak Overshoot (%) |
|
ABC |
3.42 |
0.0318 |
1.84 |
86.4 |
7.21 |
|
GSA |
3.18 |
0.0296 |
1.62 |
81.7 |
6.74 |
|
FA |
2.96 |
0.0274 |
1.48 |
76.9 |
6.21 |
|
IBSMFO |
2.31 |
0.0207 |
0.94 |
61.3 |
4.62 |
As may be seen below, Figure 16 depicts the DC link's voltage waveform. The influence of harmonic distortion following the connection of DGs to the power supply is a significant problem with energy usage. Most DGs, including microturbines, wind turbines, solar cells, etc., require power electronic equipment to be linked to the utility. Figures 17 and 18, respectively, show the rectified voltage and current waveforms. Comparison of Optimization Algorithms is given in Table 3.
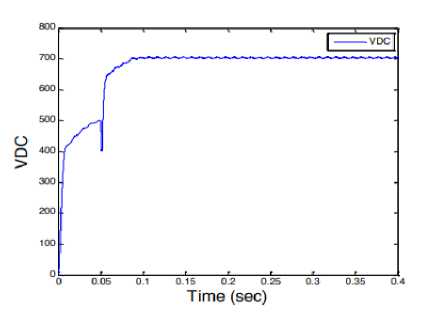
Fig. 16. DC link voltage modulation DC link voltage modulation
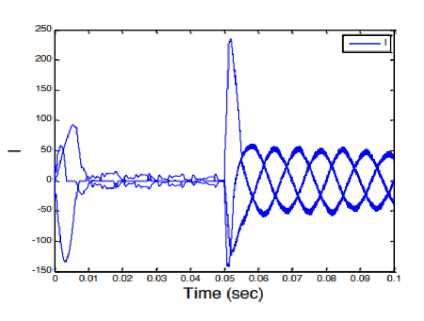
Fig. 17. Power supplier’s current waveform
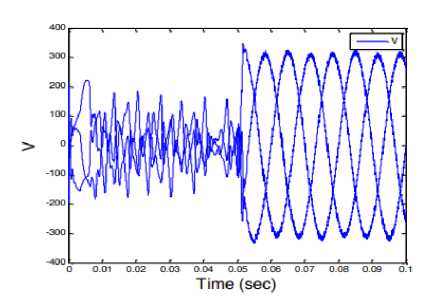
Fig. 18. Voltage waveform for load
Adding UPQC to the circuit at 0.05s greatly reduced harmonic pollution of current and even voltage unbalancing, as shown in the figures. Now the waveform resembles a sinusoidal wave much more. As a result of UPQC's positive impact on improving power quality, the total harmonic distortion (THD) of the current will drop to 4.03 and that of the voltage to 1.01. This study only looked at wind farms as a possible source of harmonic distortion; no other power sources were considered. Therefore, by increasing the number of harmonic resources, it is possible to account for the changing distance between power suppliers and nonlinear loads.
The proposed IBSMFO method demonstrated improved controller-parameter optimization, harmonic suppression, and dynamic response compared with the considered benchmark and individual IBSA/MFOA methods. The results are reported using the verified THD, steady-state error, settling time, and peak overshoot values, together with the mean and standard deviation of five independent runs. The computational burden of IBSMFO is higher than that of a single optimization algorithm, which may impose constraints on direct real-time DSP/FPGA implementation. Future work will therefore focus on computationally efficient IBSMFO implementation, hardware-in-the-loop validation, integration with model predictive control, and robustness evaluation under source-load uncertainty, parameter variations, and severe fault conditions.
-
5. Conclusion
The proposed IBSMFO-based controller was developed to optimize the controller parameters of the investigated power-electronic system by combining the global exploration capability of IBSA with the local exploitation capability of MFOA. Unlike the individual optimization algorithms, the proposed sequential hybrid strategy allows the IBSA stage to generate diverse and promising candidate solutions, which are subsequently refined through the MFOA spiral-search mechanism. The simulation results obtained under identical operating conditions demonstrate that the proposed IBSMFO approach provides improved optimization performance compared with the considered benchmark algorithms. The total harmonic distortion (THD) of the source current is 2.54% under perfect conditions and drops to 2.15% under imperfect ones. We can see that the power quality has greatly improved after UPQC was put into place since the current total harmonic distortion (THD) has decreased to 4.03 and the voltage THD has decreased to 1.01. According to the results of the simulations, the suggested algorithm is successful at preserving stability for power quality in systems that are linked to the grid. Furthermore, the ablation results show that the hybrid IBSMFO method provides improved performance compared with IBSA and MFOA when they are applied independently. This indicates that the combination of the exploration and exploitation mechanisms contributes to the observed improvement rather than the improvement being solely attributable to one of the constituent algorithms. The convergence characteristics also indicate that IBSMFO reaches a satisfactory objective-function region within fewer iterations than the compared optimization methods. This behavior can be attributed to the complementary operation of the two search mechanisms. IBSA promotes global exploration and population diversity during the initial search, whereas MFOA subsequently refines promising solutions through its spiral-based exploitation mechanism. However, improved convergence behavior is obtained at the cost of additional computational operations because both optimization stages are executed during each iteration.
All the Declarations and StatementsAuthor Contributions Statement
S.C.: Conceptualization, methodology, data preparation, experiment, writing—original draft, Review and Editing, Critical review, editing, and supervision.
Conflict of Interest Statement
The authors declare that they have no known competing financial interests or personal relationships that could have appeared to influence the work reported in this paper.
Funding Declaration
This research did not receive any specific grant from funding agencies in the public, commercial, or non-profit sectors.
Data Availability Statement
The data supporting the results of this study are included in the article.
Ethical Declarations
Not applicable. This study does not involve human participants, human subjects, animals, or clinical data.
Acknowledgements
The author would like to thank their respective institutions and colleagues for their valuable support and encouragement during the course of this research.
Declaration of Generative AI in Scholarly Writing
During the preparation of this manuscript, AI-assisted tools were used solely for language polishing, grammar correction, and improving readability. No generative AI tools were used to create scientific content, develop research ideas, analyse or interpret data, generate figures or tables, or write the scientific aspects of the manuscript.
Abbreviations
This manuscript uses the following abbreviations:
DG – Distributed Generation
UPQC – Unified Power Quality Conditioner
PV – Photovoltaic
PQ – Power Quality
IBSMFO – Improved Bat Search Moth Flame Optimization
THD – Total Harmonic Distortion
MFOA – Moth Flame Optimization Algorithm
PCC – Point of Common Coupling
VSI – Voltage source inverter
FA Firefly algorithm
ABC — Artificial Bee Colony
GSA — Gravitational Search Algorithm
Appendix A/B/C…, with appendix title
None.