Identification and Quantification of Distress Along Flexible and Concrete Pavements Using Low-Cost Image Processing Technique

Author: Dhanya Kumar S.J., Archana M.R., V. Anjaneyappa, Anala M.R.
Journal: International Journal of Mathematical Sciences and Computing @ijmsc
Article in issue: 2 vol.11, 2025.
Free access
This research focuses on developing an automated framework for evaluating distress on flexible and rigid pavement surfaces through deep learning and algorithms, enhancing infrastructure monitoring by efficiently identifying, assessing, and measuring road distresses. The methodology begins with identifying road stretches from ground-level images, followed by capturing photos of distresses and applying algorithms to measure their dimensions accurately. A YOLOv5 model is developed to evaluate the length and width of identified distresses, with an exploration of the relationship between camera position and measurement accuracy. Physical measurements using tape are employed for validation, ensuring that the automated results align with real-world dimensions. Results indicate that the average errors of 26.1% for length and 26.9% for width for flexible pavement and the average percentage error in length is about 29% and average percentage error in width is about 1% for rigid pavement. This highlights the importance of precise measurements for effective road rehabilitation. The integration of computer vision in road maintenance, validated through physical measurements, promises significant improvements in the accuracy, efficiency, and resilience of road networks.
Flexible Pavement, Rigid Pavement, Pavement Distress, Deep Learning, Python Code, Yolov5, Pothole Detection, Pothole Measurement
Short address: https://sciup.org/15019833
IDR: 15019833 | DOI: 10.5815/ijmsc.2025.02.03
Text of the scientific article Identification and Quantification of Distress Along Flexible and Concrete Pavements Using Low-Cost Image Processing Technique
In pavement asset management, evaluating road surface conditions is crucial for formulating effective repair and maintenance plans. For flexible pavements, it is essential to assess various types of road surface distress, including potholes, cracks, and patches, to ensure effective maintenance strategies. As the world rapidly moves towards enhanced automation, it has become imperative, especially in the context of the ongoing pandemic, to adapt to autonomous solutions [1]. The pandemic has significantly disrupted various sectors, including road development and maintenance, making it challenging to ensure a safe working environment. Implementing an autonomous system can help address this issue by minimizing human involvement, thereby enhancing safety and efficiency.
Despite these concerns, a major challenge remains in accurately identifying and measuring pavement distress, particularly potholes, which vary in size, shape, and environmental conditions. Traditional road inspection methods rely heavily on manual assessment, which is time-consuming, labor-intensive, and prone to human error. This study specifically addresses this problem by proposing an automated system that enhances the accuracy and efficiency of pavement distress identification and dimension estimation. To address this challenge, a pavement detection and dimension estimation system is proposed, utilizing deep learning techniques. The system leverages the YOLO (You Only Look Once) algorithm, trained on a custom dataset and images sourced from Google Search Engine, which include both water-logged and dry potholes of various shapes and sizes [5]. The use of image-based object detection has significantly contributed to pavement distress assessment. While machine learning, particularly deep learning, has advanced automated data collection and analysis, challenges persist due to the reliance on training data and the absence of standardized datasets [6].
The proposed model demonstrates the ability to accurately detect various types of potholes on flexible and rigid pavements with commendable precision. Moreover, the algorithm-based system for estimating pothole dimensions provides reliable measurements, significantly reducing the time and effort required for road maintenance. By automating the identification and quantification of pavement distress, this approach enhances overall efficiency, offering a promising solution for road maintenance authorities [7].
2. Related Works
Challenges in pothole detection include handling extreme weather conditions, varying lighting, and diverse pavement types, which require robust algorithms and high-quality datasets for optimal performance. Vibration-based sensors and accelerometers are also utilized to detect potholes, leveraging vehicle dynamics to identify anomalies in road surfaces [9]. Smartphones equipped with GPS, accelerometers, and cameras provide a low-cost, efficient tool for road inventories, significantly reducing the expense and complexity associated with traditional methods [10]. Methods combining grayscale transformation, texture analysis, and binary segmentation effectively differentiate defects from surrounding intact pavement, enhancing detection accuracy [11]. While YOLOv5 has been widely used for object detection, this study presents a novel contribution by optimizing the model specifically for pavement distress detection in diverse real-world conditions. Unlike existing approaches that often rely on general object detection frameworks, this research incorporates a custom-trained dataset featuring potholes across various pavement types, lighting conditions, and moisture levels. Additionally, the model has been fine-tuned to improve detection accuracy in low-contrast environments, where conventional algorithms struggle.
Deep learning techniques, such as YOLOv5, exemplify the growing role of machine learning in enhancing mobile image analysis for applications like automated pavement distress detection [12]. The inclusion of adaptive thresholding and guided image filtering in segmentation models allows for improved localization and boundary delineation of different distresses, even in complex environments [13]. Integrated systems like laser scanning with mobile cameras achieve pothole measurement accuracy within ±2 mm for depth and ±5% for surface area [14]. Advanced techniques enable pixel-level segmentation by providing pothole area estimations within 95% accuracy and reliable volume calculations using physical pixel-to-geometry conversions [15].
The algorithm achieved a detection accuracy of 70% for asphalt concrete pavement and 100% for specific datasets with controlled conditions, demonstrating its capability for accurate distress quantification [16].
3. Proposed Approach 3.1 . Data collection
The project aims to assess flexible pavement potholes along the road stretch extending from Jnana Bharathi Metro Station to Bangalore University. For rigid pavement potholes assessed along Kengeri railway parallel road both segment spans approximate 2 - 4 kilometers and provides a range of road conditions and pavement distresses for thorough analysis and assessment. High-resolution images will be captured by smartphone at regular intervals along this route to observe and analyse pavement distresses, particularly focusing on potholes.
The pothole image was captured using an iPhone 14 Plus with a 12-megapixel camera and a resolution of 3024x4032 pixels, ensuring detailed visual data for analysis. Manual measurements of the pothole’s length and breadth were conducted at multiple positions to validate image processing results. This process, demonstrated in Fig. 1, accounts for correction factors in the assessment and ensures accuracy in pothole detection. The combination of smartphone imaging and manual validation enhances reliability in pavement distress assessment, facilitating accurate identification and evaluation of road distresses.
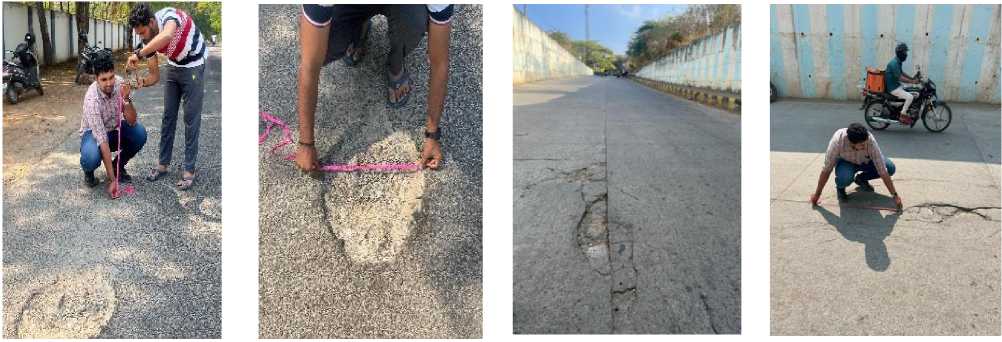
Fig. 1. Measurements of pavement distress along both flexible and rigid pavement
Pothole images are captured using a smartphone from three different distances viz., 1, 1.5 and 2 m away from the pothole. At each distance, the height of the smartphone is varied at intervals of 1, 1.5, and 2 m as shown in Fig. 2. This methodology resulted in the collection of 9 distinct images of the pothole, providing comprehensive visual data from various perspectives and distances for accurate analysis.
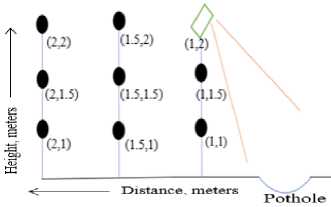
Fig. 2. Capturing images of pothole at different positions.
3.2 Dataset creation
3.3 YOLO Architecture and Algorithm
4. Methodology
A custom dataset was developed for training the model, consisting of approximately 965 images from both Indian and foreign roads, covering both flexible and rigid pavement distresses. The dataset includes a mix of waterlogged and dry potholes of varying shapes and sizes. To ensure a diverse representation of real-world conditions, images were collected from multiple locations within Bangalore city using high-resolution mobile camera. Additionally, publicly available datasets and open-access sources were utilized to supplement the dataset, ensuring ethical. While some images were initially sourced through Google Images for reference, only those from open-access repositories and publicly available datasets were included in the final dataset. This approach ensures the dataset is legally compliant and sufficiently diverse for robust model training.
The annotation process involved labeling each object class and drawing bounding boxes around the potholes within the images. These bounding boxes were then assigned the appropriate class identifiers. The final annotations were exported in YOLO format, which includes the object class along with normalized coordinates and dimensions of each bounding box, as shown in Fig. 3. The annotation format is as follows:
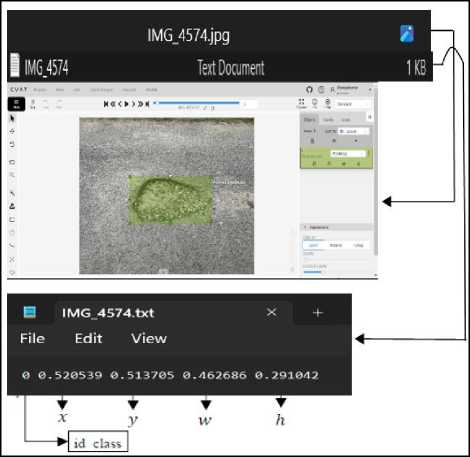
Fig. 3. Annotation and Labelling of collected images.
The YOLOv5 model (version X) was utilized for real-time pothole detection and measurement. The model was trained using a custom dataset and fine-tuned to improve detection accuracy under various environmental conditions. In this study, images were captured from different positions and analyzed using the YOLOv5 model, loaded with pretrained weights (best.pt). A detection threshold of 0.5 was set to ensure accurate predictions while minimizing false positives. The algorithm processed each image, generating bounding box coordinates, confidence scores, and class IDs for detected potholes.
To estimate the real-world dimensions of potholes, a conversion factor (meters per pixel) was applied, ensuring accurate width and height calculations. The bounding boxes were drawn around detected potholes, and only the measurements (width and height in meters) were displayed without additional class labels. This approach allowed for a more precise evaluation of pothole sizes, aiding in effective road maintenance planning. Additionally, considerations were made regarding class imbalance in the dataset, ensuring that pothole detection was not biased towards specific sizes or shapes. The model’s training environment, including GPU acceleration and PyTorch, was optimized for performance. The approach demonstrated that the YOLOv5-based approach could be a viable solution for automated road surface monitoring and maintenance.
The project involves analyzing pothole distress along flexible and rigid pavements of stretches Bangalore University and Kengeri railway parallel road. High-resolution images of distress are captured using a smartphone at distances of 1 meter, 1.5 meters, and 2 meters, with the smartphone's height varied at these distances. Identifying and documenting pothole distress along an urban flexible and rigid road stretches, ensuring clear visibility for image capture. Field data collection is conducted by capturing images at known positions using a smartphone. Analysis is performed using YOLOv5 model to detect and measure pothole distress and validating with physical measurements of the pothole. This approach results in 9 distinct images of each pothole, delivering visual data from various angles and distances to ensure accurate analysis. The objective is to create an automated system that enables efficient and precise pothole detection on both pavements.
The traditional method for assessing pavement conditions involves manually walking or driving on the road to collect data. This approach relies heavily on experience of person involved and is often time-consuming, hazardous, and subjective. To tackle these challenges, automation has proven to be an effective technique. The YOLO model is loaded with pre-trained distresses, and a detection threshold is set to identify pothole in the image. The algorithm converts pixel measurements into real-world dimensions. Bounding boxes are drawn around the identified potholes, and labels indicating their class are included, as depicted in Fig. 4.
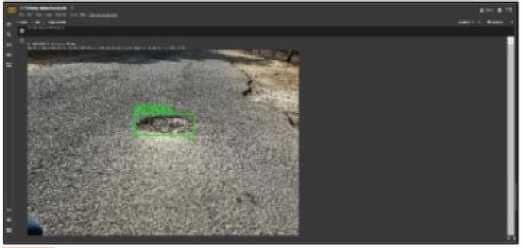
Fig. 4. Detection of pothole
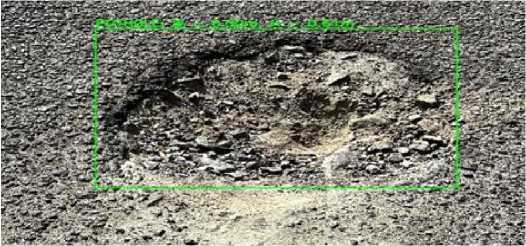
Fig. 5. Output indicating maximum length and breadth of flexible pothole.
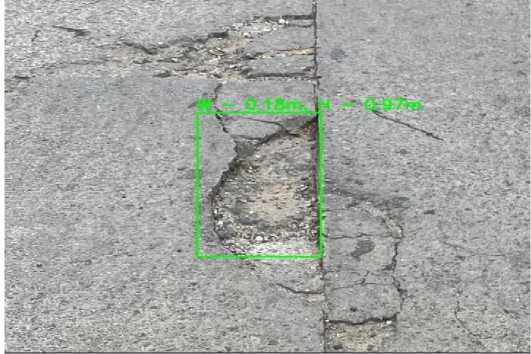
Fig. 6. Output indicating maximum length and breadth of rigid pothole.
The algorithm analyzes all images captured from varying positions, detecting potholes and measuring their dimensions. These images were taken at three different distances 1, 1.5, and 2 m from the pothole, with the smartphone height adjusted at each distance to 1, 1.5, and 2 m from the ground level as presented in Table 1., Table 2. and Fig. 2.
Table 1. The data of Flexible pothole for analysis
|
Distance, meters |
Height, meters |
Length, meters |
Width, meters |
Actual length, meters |
Actual width, meters |
% Error of length |
% Error of width |
|
1.0 |
1.0 |
0.6 |
0.5 |
0.7 |
0.5 |
7.6 |
1.6 |
|
1.0 |
1.5 |
0.6 |
0.4 |
0.7 |
0.5 |
4.5 |
31.1 |
|
1.0 |
2.0 |
0.5 |
0.4 |
0.7 |
0.5 |
25.8 |
13.4 |
|
1.5 |
1.0 |
0.5 |
0.4 |
0.7 |
0.5 |
28.8 |
29.1 |
|
1.5 |
1.5 |
0.6 |
0.4 |
0.7 |
0.5 |
9.1 |
17.3 |
|
1.5 |
2.0 |
0.5 |
0.3 |
0.7 |
0.5 |
21.2 |
35.0 |
|
2.0 |
1.0 |
0.3 |
0.3 |
0.7 |
0.5 |
50.0 |
33.1 |
|
2.0 |
1..5 |
0.4 |
0.3 |
0.7 |
0.5 |
43.9 |
37.0 |
|
2.0 |
2.0 |
0.4 |
0.3 |
0.7 |
0.5 |
43.9 |
44.9 |
Table 2. The data of rigid pothole for analysis
|
Distance, meters |
Height, meters |
Length, meters |
Width, meters |
Actual length, meters |
Actual width, meters |
% Error of length |
% Error of width |
|
1.0 |
1.0 |
1.8 |
1.8 |
0.2 |
0.0 |
-31.8 |
|
|
1.0 |
1.5 |
1.7 |
0.3 |
1.8 |
0.2 |
5.5 |
-18.2 |
|
1.0 |
2.0 |
1.5 |
0.3 |
1.8 |
0.2 |
16.6 |
-13.6 |
|
1.5 |
1.0 |
1.1 |
0.2 |
1.8 |
0.2 |
38.6 |
9.1 |
|
1.5 |
1.5 |
1.1 |
0.2 |
1.8 |
0.2 |
38.7 |
-9.1 |
|
1.5 |
2.0 |
1.3 |
0.2 |
1.8 |
0.2 |
29.83 |
4.6 |
|
2.0 |
1.0 |
1.0 |
0.2 |
1.8 |
0.2 |
46.4 |
18.2 |
|
2.0 |
1..5 |
1.0 |
0.2 |
1.8 |
0.2 |
47.5 |
18.2 |
|
2.0 |
2.0 |
1.0 |
0.2 |
1.8 |
0.2 |
47.0 |
18.2 |
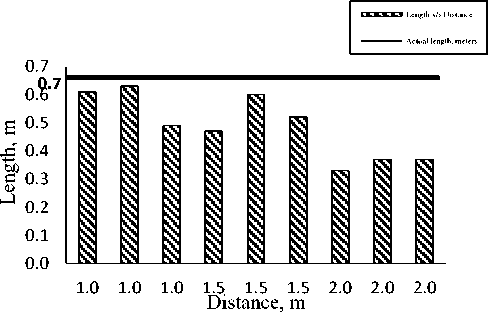
Fig. 7. The above graph shows length v/s distance to the actual length of flexible pothole.
100.00
a 80.00 я
60.00
н 40.00
W o'-- 20.00
0.00
0.75
y = 38.384x2 - 81.818x + 56.061 R² = 0.79
1 1.25 1.5 1.75 2 2.25
Distance, m
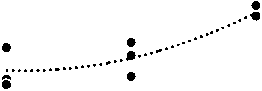
Fig. 8. The above graph shows the % error in length v/s distance of flexible pothole
The length measured with algorithm is validated against actual dimensions on flexible and rigid pavements revealed that the highest accuracy, the variations obtained are as presented from Fig 7 to Fig 10. For flexible pavement pothole the measurements taken at 1m distance indicated the highest accuracy of around 86 %, This accuracy decreased to 82% at 1.5 meters and further dropped to 57% at 2 meters. The percentage error for 1, 1.5 and 2m are approximately
86, 82 and 57 % respectively. From Fig. 8. illustrates a positive correlation between the percentage error in length measurements and the distance from which they were taken, with an R² value of 0.79. As the distance increases from 1.0 to 2.0 meters, the error percentage generally rises, ranging from 7.6% at 1.0 meters to 43.9% at 2.0 meters.
ы Length v/s Distance
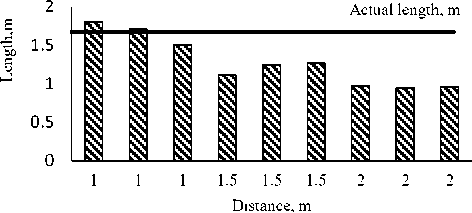
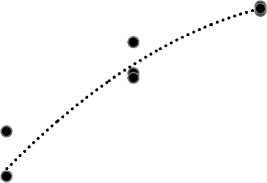
Fig. 9. The above graph shows length v/s distance to the actual length of rigid pothole.
50.00
45.00
40.00
я 35.00
30.00
д 25.00
20.00
§ 15.00
10.00
5.00
0.00
y = -23.941x2 + 111.42x - 80.11 R² = 0.92
0.75 1 1.25 1.5 1.75 2 2.25
Distance, m
Fig. 10. The above graph shows the % error in length v/s distance of flexible pothole.
For rigid pavement pothole the measurements taken at 1m distance indicated the highest accuracy of around 100 %, This accuracy decreased to 83% at 1.5 meters and further dropped to 53% at 2 meters. The percentage error for 1, 1.5 and 2m are approximately 100, 83 and 53 % respectively. From Fig. 10. illustrates a positive correlation between the percentage error in length measurements and the distance from which they were taken, with an R² value of 0.92. As the distance increases from 1.0 to 2.0 meters, the error percentage generally rises, ranging from 16.6% at 1.0 meters to 46.96% at 2.0 meters.
^ ^ ^ ^ О Width v/s Distance
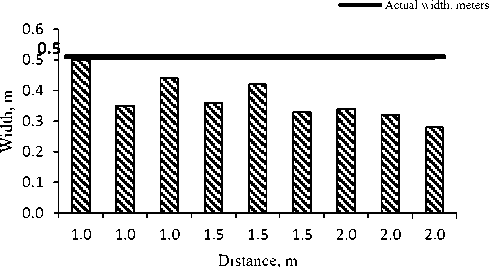
Fig. 11. The above graph shows width v/s distance to the actual width of flexible pothole.
100.00
л 80.00
I 60.00
н 40.00
м
20.00
0.00
0.25 0.5 0.75
y = 22.966x - 7.5022 R² = 0.58
1 1.25 1.5 1.75 2 2.25
Distance, m
Fig. 12. The above graph shows the % error in width v/s distance
Further the width measured with algorithm is validated against actual dimensions on flexible and rigid pavements revealed that the highest accuracy, the variations obtained are as presented in Fig. 11. and Fig. 14. For flexible pavement pothole the measurements taken at 1m distance indicated the highest accuracy of around 94 %, This accuracy decreased to 84% at 1.5 meters and further dropped to 63% at 2 meters. The percentage error for 1, 1.5 and 2m are approximately 94, 84 and 63 % respectively. From Fig. 12. illustrates a positive correlation between the percentage error in width measurements and the distance from which they were taken, with an R² value of 0.5. As the distance increases from 1.0 to 2.0 meters, the error percentage generally rises, ranging from 1.6% at 1.0 meters to 44.9% at 2.0 meters.
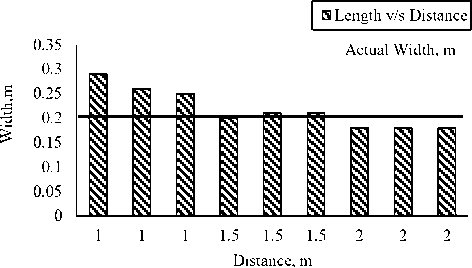
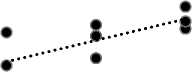
Fig. 13. The above graph shows width v/s distance to the actual width of rigid pothole.
|
100.00 80.00 ^ 60.00 д 40.00 S 20.00 б W 0.00 0. -20.00 -40.00 |
y = -30.303x2 + 130.3x - 121.21 R² = 0.92 ...•8 |
|
75 1 1.25 1.5 1.75 2 2.25 • Distance, m |
Fig. 14. The above graph shows the % error in width v/s distance
For rigid pavement pothole the measurements taken at 1.5m distance indicated the highest accuracy of around 95.5 %, This accuracy increased to 113% at 1 meters and further dropped to 81.8% at 2 meters. The percentage error for 1, 1.5 and 2m are approximately 113, 95.5 and 81.8 % respectively. From Fig. 14. illustrates a correlation between the percentage error in width measurements and the distance from which they were taken, with an R² value of 0.92. As the distance increases from 1.0 to 2.0 meters, the error percentage varies from negative to positive, ranging from -13% at 1.0 meters to 18.18% at 2.0 meters.
5. Conclusion
-
a) The algorithm proves effective in detecting distress areas like potholes on both flexible and rigid pavements through a pretrained YOLO model. By improving the accuracy of pothole detection and dimension estimation, the system enables faster and more effective road maintenance, directly enhancing road safety. Potholes are a major cause of vehicular accidents and infrastructure damage, and timely identification and repair can help prevent accidents, reduce vehicle damage, and lower associated costs. The integration of an automated distress detection system reduces reliance on manual inspection, allowing quicker response times for maintenance crews and minimizing potential hazards for road users. Additionally, accurate distress quantification enables city planners and transportation authorities to prioritize repairs based on severity, ensuring hazardous road sections receive immediate attention.
-
b) The analysis for flexible pothole reveals that the least error in length measurements occurs at a distance of 1 meter and a height of 1.5 meters, with 4.5%, while the highest error is observed at 2 meters distance and 1 meter height, reaching 50%. Similarly, for width measurements, the lowest error is at 1 meter distance and 1 meter height, with 1.6%, whereas the highest error is at 2 meters distance and 2 meters height, with 44%. On average, the error in length measurements is 26.1%, and for width measurements, it is 26.9%.
-
c) The analysis for rigid pothole reveals that the least error in length measurements occurs at a distance of 1 meter and a height of 1 meters, with 0%, while the highest error is observed at 2 meters distance and 1 meter height, reaching 50%. Similarly, for width measurements, the lowest error is at 1 meter distance and 1 meter height, with 4.5%, whereas the highest error is at 2 meters distance and 2 meters height, with 18.18%. On average, the error in length measurements is 29.15%, and for width measurements, it is 1.01%.
-
d) The analysis indicates that the most accurate pothole measurements are achieved at a distance of 1.0 meter and a height of 1.0 meter, for flexible pothole with the lowest error percentages for both length (7.6%) and width (1.6%). For rigid pothole with the lowest error percentages for both length (5.5%) and width (4.6%). Measurements at 1.0-meter distance with higher heights (1.5 meters and 2.0 meters) show increased error for both flexible and rigid potholes. Analysis also reveals that closer distances and higher heights generally lead to lower measurement errors, while farther distances and lower heights result in higher errors. Thus, positioning the camera at 1.0-meter distance and 1.0-meter height is optimal for accurate pothole measurement, significantly enhancing road maintenance accuracy.
-
e) The proposed YOLOv5-based pothole detection model shows promising results in automated road monitoring but has certain limitations. Detection accuracy varies across different pavement types, and environmental factors like lighting, rain, and shadows can affect reliability. The model estimates width and height but lacks depth measurement without advanced sensors like LiDAR. Further optimization is needed for real-time deployment in mobile or drone-based systems to enhance scalability and robustness.
