Image retrieval using hypergraph of visual concepts

Author: Sandhya V. Kawale, S. M. Kamalapur
Journal: International Journal of Information Technology and Computer Science @ijitcs
Article in issue: 12 Vol. 9, 2017.
Free access
Retrieving images similar to query image from a large image collection is a challenging task. Image retrieval is most useful in the image search engine to find images similar to the query image. Most of the existing graph based image retrieval methods capture only pair-wise similarity between images. The proposed work uses the hypergraph approach of the visual concepts. Each image can be represented by combination of the several visual concepts. Visual concept is the specific object or part of an image. There are several images in the database which can share multiple visual concepts. To capture such a relationship between group of images hypergraph is used. In proposed work, each image is considered as a vertex and each visual concept as a hyperedge in a hypergraph. All the images sharing same visual concept, form a hyperedge. Images in the dataset are represented using hypergraph. For each query image visual concept is identified. Similarity between query image and database image is identified. According to these similarities association scores are assigned to images, which will handle the image retrieval.
Clustering, Hypergraph, Image Retrieval, Ranking, Visual Concepts
Short address: https://sciup.org/15016217
IDR: 15016217 | DOI: 10.5815/ijitcs.2017.12.05
Text of the scientific article Image retrieval using hypergraph of visual concepts
Published Online December 2017 in MECS DOI: 10.5815/ijitcs.2017.12.05
Retrieving similar images to query image from a large database plays most valuable role in the field of image processing. Human eye can recognize the similarities in images within few seconds but for computer system it is very difficult and challenging. There is no system that achieved the accuracy of human visual perception for distinguishing images. Image retrieval is most useful in the image search engine to give the accurate image retrieval. Now-a-days image retrieval has been useful in several areas, such as medical field, biodiversity information systems, digital libraries, historical research, etc.[1].
In the literature several methods are available for the image retrieval, some of them are graph based. Graphs are useful only for capturing pairwise relationship between vertices. Graphs are not useful to represent the complex relationship between objects in real world. Fig.1 shows the example of graph. Here v 1, v2, v3, v4, v5, v6 are the vertices of the graph, where edges are connecting only two vertices.
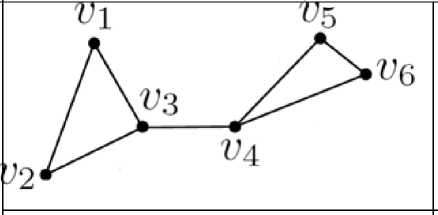
Fig.1. Example of graph
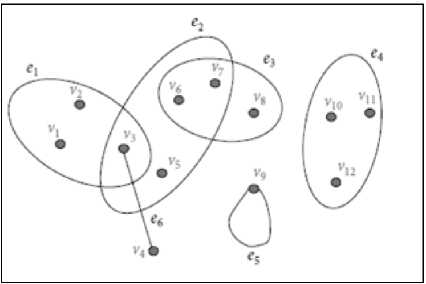
Fig.2. Example of hypergraph
Hypergraphs are more useful to represent complex relationship between objects [2]. In a hypergraph each edge can be attached to any (one or more than one)
number of vertices called as hyperedge. Hypergraph is defined over two sets: set of nodes or vertices and a set of hyperedges. Example of a hypergraph is shown in fig.2 [3].
In fig.2, V1 to V12 are the vertices in a hypergraph and e1 to e6 are the hyperedges. In the above figure more than two vertices sharing the same relation and therefore belonging to the similar hyperedge.
Here each image is considered as a combination of different visual concepts. In the image database, their are several images having similar visual information. To capture the images sharing same visual information, a hypergraph is used. All the images sharing same visual concept form a hyperedge. Visual concept is the specific object or part of an image which having some visual information. Image retrieval using hypergraph of visual concept retrieve those images which share same visual concept. Here images are considered as a vertices and visual concept as a hyperedge. Images sharing same visual concept form a hyperedge. This work focuses on hypergraph of visual concepts to retrieve query relevant images. Images with high association scores are retrieved to answer query images.
Paper is organized as follows: section I introduces the image retrieval using hypergraph of visual concept method. Section II gives the literature review. Section III describes the system architecture. Section IV represents the system analysis. Section V gives the results and section VI concludes the paper.
-
II. Related Work
This section includes work done for image retrieval methods. Some existing methods of the image retrieval are graph based and some are hypergraph based. Details of these methods are discussed in this section.
-
A. Graph Based methods:
Jing and Baluja proposed a VisualRank [4], which is based on PageRank, for large scale web image search. This page rank is a ranking algorithm based on the graph for calculating the importance of webpages. VisualRank algorithm uses the computer vision techniques as well as locality sensitive hashing (LSH) techniques (existing search technique uses the image metadata as well as surrounding text information to retrieve an initial result candidates). Features are extracted from images and collected into a LSH hash table. Match is found when the features hash into the same bins.
Here image ranking problem is modeled as a task of finding authority nodes on a visual similarity graph and discover the VisualRank method to identify the visual link structures between images. The images(vertices) which found to be authorities are taken to answer the image query.
Ambai and Yoshida proposed a MultiClass VisualRank method [5]. This method extends the idea of VisualRank for multiple categories of the images. In the Multiclass VisualRank method, images gets from search engine are divided into multiple classes based on the distinct patterns of the visual features. Then ranking is applied in the classes. This method gives the images in sequence and each sequence contains the classified images which are sorted by their ranked scores. For the existing image search engine this method work as a post-filtering. Three steps of MultiClass VisualRank method are getting visual similarity, clustering and ranking. Visual similarity wi,j between images Ii, Ij is obtained by scale invariant feature transform(SIFT) keypoints. Main focus of this method is on clustering, used to obtained different image classes related to given keywords. Here similar images are connected with high visual similarity. If images having high visual similarity then considered that these are similar images. Several clusters in the graph correspond to the different image classes. Clusters from the graph are extracted from the normalized cuts, representative method of spectral clustering. Ranking is done by PageRank.
-
J. He et al. [6] proposed a image retrieval method which is based on manifold ranking called as Manifold Ranking Based Image Retrieval (MRBIR). In this method by considering each data point as a vertex, a weighted graph is formed. Assign a non-negative ranking score to each query and zero to remaining points. Scores of all the points are spread to the nearest points via weighted graph. Repeat these spreading process until global state reaches. All the points except query image have their own scores and using these scores they are ranked. Relationship of all data points are reflected by propagation of ranking scores. In a feature space, far away points can have different ranking scores except that they belong to the similar cluster. This is because, many points help to link the far away points. Many of nearest points can have similar rank score except that they having different clusters. Drawback of MRBIR method is that it can solve the problem only when query image is present in the database, because the query point is taken as a vertex in the weighted graph. However, as input image (query) is absent in the database, this method fails to spread the ranking score for images in the image database. In almost all of the retrieval method, input image is given by the user, and it is to be search in the database.
-
J. He et al. [7] proposed a method which is generalization of Manifold-Ranking Based Image Retrieval called generalized MRBIR. Generalized Manifold-Ranking Based Image Retrieval is the extension of MRBIR. This method works well even if query is absent in the image database. The basic concern of this method is efficiently initializing scores for ranking the nodes in the original graph. By giving a query image, this method performs the following two step procedure:-
-
1) Initialization: In this step ranking scores of the query is spread to its K nearest neighbors in the image database.
-
2) Propagation: This step spreads the ranking scores of the neighbors to all unlabeled images by using manifold based ranking.
If input query image is in the image database, MRBIR and generalize MRBIR gives the same ranking output when K=1. If the input query image is not present in the image database, the first step of gMRBIR gives the K seeds with different ranking scores. Then second step performs the manifold ranking which is based on these seeds. Author included the relevance feedback and active learning into gMRBIR for refining the image retrieval results.
Michael K. Ng. et al.[8] presented MultiRank and Xutao Li. et al.[9] presented HAR(Hub, Authority and Relevance). These two methods are used to design a ranking scheme in a multi relational data for objects as well as relations. In MultiRank [8] importance of both objects as well as relations are simultaneously evaluated by probability distribution calculated from multi-relational data. HAR [9] uses relevance score of relations and, Hub and Authority score of objects in multi-relational data in order to search a query. The main idea behind this framework is to perform a random walk on a multi-relational data and study the limiting probabilities of the objects for hub scores and authority scores and of the relations for the relevance scores. These scores are use to obtain efficient searching results. But they have additional complexity in calculating hub, authority score of objects.
Xiaojun Qi and Ran Chang [10] proposed a ranking system based on graph for image retrieval. Here performance of the system is improved using semantic feature-based long-term learning and the relevance feedback based transductive short-term learning. The dynamic feedback logs are built to extract semantic features of the images based on the active learning. Manifold graphs containing two layers and are build in both high level semantic and low level visual spaces. At the first layer graph is constructed using anchor images which are obtained from the feedback log. At the second layer several graphs are constructed using the images in their respective cluster formed around the anchor image. Asymmetric relevance vector is generated for each second layer graph by using initial scores taken from first layer. For propagating the relevance scores of unlabeled and labeled images, asymmetric relevance vectors are fuses. This system requires additional cost of creating a compressed dynamic feedback log for storing image retrieval patterns of each past image query session.
-
B. Hypergraph based methods:
Y. Huang et al. [11] presented a Hypergraph Rank framework for retrieving images. In the weighted hypergraph images are vertices and image searching problem is considered as a problem of hypergraph ranking. Compute the similarity matrix from different feature descriptors. Then consider each image as a centroid vertex and formed a hyperedge by centroid vertex and with its k-nearest neighbors. By assigning each vertex v i to the hyperedge e j , probabilistic hypergraph is constructed. Then hypergraph incidence matrix is used to describe the local grouping information. Here relevance feedback is provided and image labels are ranked after providing feedback to the retrieval system.
This assign the equal label to vertices which share many incidental hyperedges and the constraints is that initial labels and predicted labels of the feedback images should be similar.
-
X. Li et al.[12] proposed a MutiVCRank with Application to Image Retrieval. In this method features are extracted from images using Scale Invariant Feature Transform (SIFT) and regions are detected with the help of salient region detection method. Hypergraph is constructed by considering each image as a vertex and each visual concept as a hyperedge. Weight between two vertices in a hyperedge is measured. Perform random walk to calculate limiting probabilities in a hyperedge. Query vectors are constructed from query image. Association score of the images and relevance score of the visual concepts are calculated. Images with high association scores are retrieved to answer query image. SIFT is quite slow. Here extracted features from SIFT are not perform well when lighting changes and blur which limits the performance of the system.
-
III. System Architecture
To overcome the drawbacks of existing methods a hypergraph of visual concepts method is used for query relevant image retrieval. In this method, features are extracted and salient regions are detected from images. After getting salient regions, clustering of these regions is done to get the visual concepts. Each cluster represents one visual concept. From these clusters, hypergraph is constructed by taking images as a vertices and visual concepts as a hyperedges. After giving the query image features are extracted as well as salient regions are detected. Then for each query region minimum distance clusters (visual concept) are identified by calculating distance with cluster centroid. Consider the hyperedge which represent the minimum distance clusters for query regions. This hyperedges represent the visual concepts, which matches with the query. Calculate the association scores to these hyperedge images. Image having high score is on the top of retrieval result. The overall Block diagram of the system is shown in the Fig.3
Dataset images
Feature extraction
Salient
detection
Query image 1
Feature extraction
Salient region detection —
Hypergraph
Clustering of regions
Matching with Centroid
Calculate Scores
Construct hypergraph
| Offline Part |
Retrieve Images according to the scores
|onlinePait~|
Fig.3. Architecture of the Retrieval System
-
A. Dataset Images
Image dataset contains t number of images from which images similar to query image are retrieved.
I = {I 1 , I 2 ,…..,I t }
-
B. Feature Extraction
Features play a valuable role in the retrieval system[18]. Local Binary Pattern (LBP) features are extracted from images as well as from salient regions.
To calculate the LBP descriptor[13], convert the input color image to grayscale image. Then compare the central pixel value with the neighbouring pixel values. Start from any neighbouring pixel and then transverse either in clockwise or anti-clockwise direction but use the same order for all the pixels. Since there are 8 neighbouring pixels- for each pixel, perform 8 comparisons. The results of the comparisons are stored in a 8-bit binary array [13].
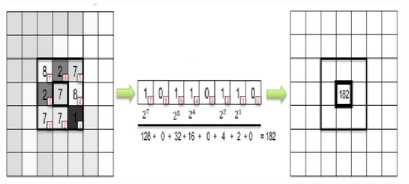
Fig.4. Calculation of LBP Values
Fig.4 shows the Calculation of LBP values. After this, 10bins LBP histograms are used to store these LBP values.
-
C. Salient Region Detection
Salient region detection is applied to dataset images as well as query image. After salient region detection p regions are obtained. Regional contrast (RC) based salient object detection algorithm is use to detect salient region. In RC method, input image is first segmented into regions (segments), then at a region level color contrast is computed. Finally saliency value is assign to each region, which is the weighted sum of regions contrast over all other regions in the image.
For segmentation, Simple Linear Iterative Clustering (SLIC) algorithm is used. Segments are generated by clustering the pixels on the basis of color similarity and spatial proximity in the image plane [14].
After getting segments (regions), color contrast at a region level is computed by building the color histogram to each region[15]. Actual-color space consists of 2563 number of possible colors. Each color channel is quantized to 12 different values to reduced number of colors i.e.123 = 1728. Ignore the colors which occur less frequently so that numbers of colors are reduced. Ensure that more frequently occurred colors covers color of more than 95% of the image pixel. For a region rk, saliency value is computed by measuring it’s color contrast to all other regions in the image.
S(r k ) = ∑ rk ≠ ri w(r i ) D r (r k , r i ) (1)
where,
w(ri) - indicates the weight of a region ri
Dr( . , . ) is the color distance metric across the two regions.
Distances are weighted by the number of pixels in r i as w(r i ).
The color distance between the two region r 1 and r 2 is,
D r (r 1 , r 2 ) = ∑ i=1 n1 ∑ j=1 n2f(c 1 , i ) f(c 2 , j ) D(c 1 , i, c 2 , j ) (2)
where, f(c k , i ) - probability of the ith color c k , i among all n k colors in the kth region r k , k = {1,2}.
If spatial weighting term is introduced in eq.(1), which increases the effects of closest regions as well as decreases the effects of farthest regions[15].
-
D. Hypergraph
-
a) Clustering of Regions:
To form a cluster, consider the region into feature space and cluster them into visual concepts. Apply K-means clustering algorithm [16] which partition p regions into n cluster. Here each region belongs to the cluster which is nearest to the cluster center. Euclidean distance is calculated to find the nearest neighbor.
-
b) Construct Hypergraph:
Hypergraph consist of Images as a vertices and visual concepts (clusters) as a hyperedges. A Hyperedge is set of vertices which share the same visual concepts i.e. those images form a hyperedge whose salient regions belonging to the same clusters. This hypergraph is constructed to model the region level similarity between images. Fig. 5 shows the example for hypergraph construction.
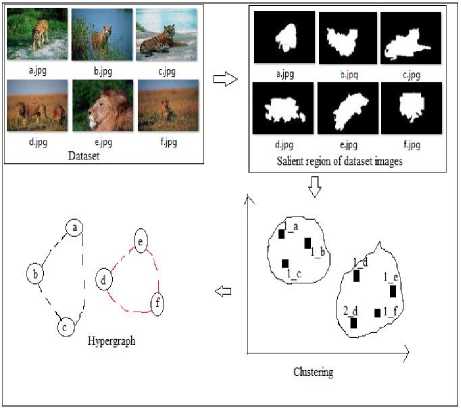
Fig.5. Example of hypergraph construction from dataset images.
Suppose dataset contains six images a, b, c, d, e, f. For each image, salient regions are identified and features of the images as well as regions are extracted. Based on this features clustering of this regions is done. Cluster1 contains all the regions containing tiger visual concept i.e. first region of image a, first region of image b, first region of image c represents tiger region and cluster2 contains all the region containing the lion visual concept i.e. first and second region of image d, first region of image e and one region of image f contains lion. Here each cluster represents the visual concept. Cluster1 represents the tiger visual concept and cluster2 represents the lion visual concept. From these clusters hypergraph is constructed. Here dataset images a, b, c, d, e, f are the nodes of hypergraph and visual concepts are the hyperedges. Images whose regions belonging to the same cluster form a hyperedge. Images a, b, c form a hyperedge because regions of these images belonging to same cluster. Similarly for another hyperedge.
-
E. Matching with Centroid:
In the online part for each query image salient regions are detected and features are extracted from images as well as regions. Suppose for query image Q, q number of salient regions are identified. i.e. Q = {R 1 , R 2 ,…..,R q }
Then for each query region minimum distance clusters are identified by calculating the distance with centroid.
-
F. Calculate Association score
After getting the minimum distance cluster, consider the hyperedge which represent this minimum distance cluster and calculate the association scores for these hyperedge images. Scores are calculated as follows,
O j = exp (-||f (Q) – f(I j ) ||2 / 2∂2) / ∑ i=1 m exp (-||f(Q) –f(I j )||2 / 2∂2) (3)
O j is the probability vector, according to which scores are assigned to the images. Images with high scores are found on the top of retrieval results.
-
IV. System Analysis
-
A. Mathematical model
System S accepts query image Q and retrieve the relevant images. System S is represented as,
S={I, B, M, d, n, C, G, Q, P, E, O}
-
- I is the set of images in the dataset. where, I= {i 1 , i 2 , ……, i m }
-
- B is the set of salient regions where, B={b 1 ,b 2 ,…,b p }
-
- M is the membership matrix, p by m between the regions and images. Where, [M] i, j = 1 if b i is from image I j , Otherwise 0.
-
- d number of features are used, f (.) ϵ Rd
-
- Grouping the regions into n number of cluster (C) with k-means. p by n matrix C to indicate the clustering result.
[C] i, j = 1 if b i belongs to jth cluster, otherwise 0.
-
- G = {V,E} hypergraph G having, set of vertices V and set of hyperedges E
V = {v 1 , v 2 , …., v m }
E = {e 1 , e 2 , …., e n }
-
- Q is the query image with q regions
Q = {q 1 , q 2 , ….., q m }
-
- O is association score according to which images are ranked, for query relevant image retrieval.
Functions used in the system are as follows:
-
F 1 - This function is used for salient region detection
F 1 (I) →B
F2 - This function is used for clustering the salient regions.
F 2 (B) →C
F 3 - This is the function used for Hypergraph
Construction
F 3 (I, C) → G
F 4 - This is the function used for calculating the minimum distance clusters for the query regions
F4(C) →D
F 5 - This is the function used for identifying the hyperedge which represent the minimum distance cluster of the query regions.
F 5 (D) →E
F 6 - This function is used for calculating association score for hyperedge images which represent the minimum distance clusters.
F 6 (Q, E) → O
-
B. Performance Measures and Efficiency
Performance of the system is measured in terms of the precision and recall for evaluation.
Precision is the ratio of Number of relevant images retrieved to the total number of images retrieved.
Recall is the ratio of Number of relevant images retrieved to the total number of relevant images in the database.
-
C. Experimental Setups
This experimentation uses windows 8(64 bit) operating system and intel (i5) processor with 4GB RAM. Python 2.7 is used for implementation. This system works on the image datasets.
-
D. Datasets
MSRC, Corel and Caltech256 datasets are considered for calculating the performance of the system. All the images in datasets are in JPG format. MSRC dataset contains 591 images of 20 different categories. Corel dataset has 5000 images of 50 categories. Each category contains different number of images. Caltech256 dataset contains 30608 images of 257 different categories.
Fig.6 shows the sample images from MSRC V2 dataset.

Fig.6. Sample images from MSRC dataset
Fig.7 shows the sample images from COREL 5K dataset.
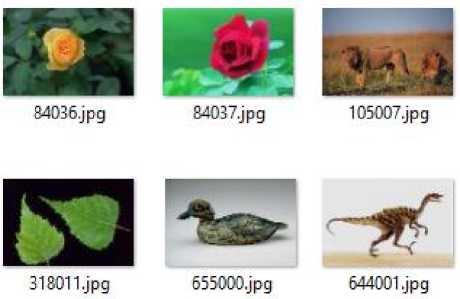
Fig.7. Sample images from Corel dataset
Fig.8 shows the sample images from Caltech dataset.
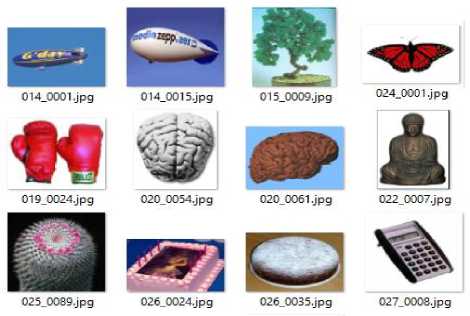
Fig.8. Sample images from Caltech dataset
-
V. Results
For each query image the nearest visual concepts (hyperedge images) are retrieved and precision is calculated. The procedure is repeated for every query image. Average precision is calculated for all images present in the dataset. The experiment is conducted for different number of clusters but best results was found for k = 21.
Table 1. Average precision for MSRC V2 dataset with clustering
|
Sr. No. |
Number of Clusters |
Average Precision |
|
1. |
21 |
0.6883 |
Table 2 shows the Comparison of proposed method with previous methods. Precision@5 means average of the precision for top 5 retrieval and Precision@10 means average of the precision for top 10 retrieval.
Table 2. Shows the precision@5 and precision@10 for MSRC V2 data set using different methods.
|
Sr. No. |
Methods |
Precision@5 |
Precision@10 |
|
1. |
Proposed method |
0.6345 |
0.6338 |
|
2. |
MultiVCRankII |
0.5000 |
0.4683 |
|
3. |
MultiVCRankI |
0.4867 |
0.4506 |
|
4. |
Hypergraph-rank_VC |
0.3521 |
0.3196 |
|
5. |
Hypergraph-rank |
0.2007 |
0.1833 |
|
6. |
ManifoldRank_VC |
0.3267 |
0.2983 |
|
7. |
ManifoldRank |
0.1521 |
0.1018 |
|
8. |
SVMRank |
0.1433 |
0.1183 |
|
9. |
TOPHITS |
0.1301 |
0.1083 |
|
10. |
Similarity Rank |
0.2633 |
0.2367 |
Above table is shown graphically in fig.9 as follows.
In the graphical representation comparison of the proposed method is done only with top three methods.
Here proper identification of the visual concepts (regions) and clustering of the regions improves performance of the proposed system.
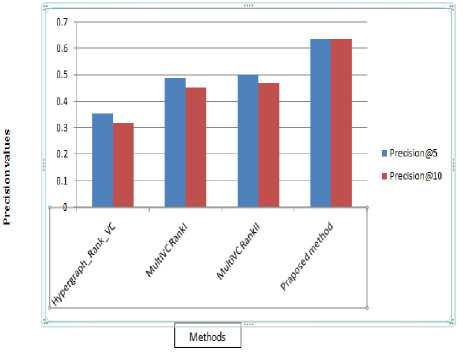
Fig.9. Comparison of the existing method (top 3) with proposed in terms of precision@5 and precision@10
-
VI. Conclusion
Retrieving images similar to query image has a lot of applications. Query relevant images should be rank on the top of the retrieval result. Graph based methods are useful only for pairwise relationships, so to capture relationship between group of images hypergraph is most useful. Using hypergraph of visual concepts images sharing same visual concepts are found on the top of the retrieval result, so most relevant images to the query image are obtained.
Acknowledgment
References Image retrieval using hypergraph of visual concepts
- R. Datta, D. Joshi, J. Li, and J. Z. Wang, “Image retrieval: Ideas, influences, and trends of the new age”, ACM Comput. Surv. vol. 40, no. 2, 2008, Art. ID 5.
- W. Bian and D. Tao, “Biased discriminant Euclidean embedding for content-based image retrieval,” IEEE Trans. Image Process., vol. 19, no. 2, pp. 545–554, Feb. 2010.
- Kaiman Zeng, Nansong Wu, Arman Sargolzaei, and Kang Yen, "Learn to Rank Images: A Unified Probabilistic Hypergraph Model for Visual Search," Department of Electrical and Computer Engineering, Florida International University, 10555 West Flagler Street, Miami, FL 33174,USA
- Y. Jing and S. Baluja, “Visualrank: Applying PageRank to large-scale image search”, IEEE Trans. Pattern Anal. Mach. Intell., vol. 30, no. 11, pp. 1877-1890, Nov. 2008.
- M. Ambai and Y. Yoshida, “Multiclass VisualRank: Image ranking method in clustered subsets based on visual features”, in Proc. 32nd Int. ACM SIGIR Conf. Res. Develop. Inf. Retr., 2009, pp. 732-733.
- J. He, M. Li, H.-J. Zhang, H. Tong, and C. Zhang, “Manifold-ranking based image retrieval”, in Proc. 12th Annu. ACM Int. Conf. Multimedia, 2004, pp. 9-16.
- J. He, M. Li, H.-J. Zhang, H. Tong, and C. Zhang, “Generalized manifold ranking- based image retrieval”, IEEE Trans. Image Process., vol. 15, no. 10, pp. 3170-3177, Oct. 2006.
- M. K.-P. Ng, X. Li, and Y. Ye, “MultiRank: Co-ranking for objects and relations in multi-relational data”, in Proc. 17th ACM SIGKDD Int. Conf. Knowl. Discovery Data Mining, 2011, pp. 1217-1225.
- X. Li, M. K. Ng, and Y. Ye, “HAR: Hub, authority and relevance scores in multi-relational data for query search”, in Proc. SIAM Int. Conf. Data Mining, 2012, pp. 141-152.
- Xiaojun Qi, Ran Chang (2013), “A Scalable Graph based semi-superwised Ranking System for Content-Based Image Retrieval".
- Y. Huang, Q. Liu, S. Zhang, and D. N. Metaxas, “Image retrieval via probabilistic hypergraph ranking”, in Proc. IEEE Conf. Comput. Vis. Pattern Recognit., Jun. 2010, pp. 3376-3383.
- Xutau Li, Yunming Ye, and Michael K. Ng "MultiVCRank With Applications to Image Retrieval", IEEE Transaction on Image Processing, Vol.25, No. 3, March 2016.
- Bikramjot Singh Hanzra, “Texture Matching using Local Binary Pattern”, May 30, 2015 blog.
- R. Achanta, A. Shaji, K. Smith, A. Lucchi, P. Fua, S. Susstrunk, “SLIC Superpixels”, EPFL Technical Report, 149300, June 2010.
- M. M. Cheng, N. J. Mitra, X. Huang, P. H. S. Torr, and S. M. Hu, “Global contrast based salient region detection”, Proc. IEEE Conf. Comput. Vis. Pattern Recognit., 2011, pp. 409-416.
- A. C. Fabregas, B. D. Gerardo and B. T. Tanguilig III,” Enhanced Initial Centroids for K-means Algorithm” I.J. Information Technology and Computer Science, 2017, 1, 26-33
- Jinshan Xiea and Liqun Qi, ”Spectral directed hypergraph theory via tensors” Linear and Multilinear Algebra, 2015.
- S.P. Algur and P. Bhat, “Web Video Mining : Metadata Predictive Analysis Using Classification Techniques” I.J. Information Technology and Computer Science, 2016, 2, 69-77.
