Image Segmentation Techniques for Noisy Digital Images based upon Fuzzy Logic- A Review and Comparison

Author: Prabhjot Kaur, Nimmi Chhabra
Journal: International Journal of Intelligent Systems and Applications(IJISA) @ijisa
Article in issue: 7 vol.4, 2012.
Free access
This paper presents a comparison of the three fuzzy based image segmentation methods namely Fuzzy C-Means (FCM), TYPE-II Fuzzy C-Means (T2FCM), and Intuitionistic Fuzzy C-Means (IFCM) for digital images with varied levels of noise. Apart from qualitative performance, the paper also presents quantitative analysis of these three algorithms using four validity functions-Partition coefficient (V_pc), Partition entropy (V_pe), Fukuyama-Sugeno (V_fs), and Xie-Beni (V_xb) functions and also compared the performance on the basis of their execution time.
Fuzzy Clustering, Fuzzy C-Means, Robust Image Segmentation, FCM TYPE-II, Intuitionistic FCM
Short address: https://sciup.org/15010277
IDR: 15010277
Text of the scientific article Image Segmentation Techniques for Noisy Digital Images based upon Fuzzy Logic- A Review and Comparison
Published Online June 2012 in MECS
Image segmentation plays an important role in image analysis and computer vision. The goal of image segmentation is partitioning of an image into a set of disjoint regions with uniform and homogeneous attributes such as intensity, color, tone etc. The image segmentation approaches can be divided into four categories; thresholding, clustering, edge detection, and region extraction. In image processing, two terms are usually seen very close to each other: clustering and segmentation. When analyzing the color information of the image, e.g. trying to separate regions or ranges of color components having same characteristics, the process is called color clustering. Mapping the clusters onto the spatial domain and physically separated regions in the image is called segmentation. In color images, the boundaries between objects are blurred and distorted due to the imaging acquisition process. Furthermore, object definitions are not always crisp and knowledge about the objects in a scene may be vague. Fuzzy set theory and Fuzzy logic are ideally suited to deal with such uncertainties. Fuzzy clustering models have proved a particularly promising solution to the color clustering problem. Such unsupervised models can be used with any number of features and clusters. The Fuzzy C means (FCM) [1] algorithm, proposed by Bezdek (1981), is the most widely used algorithm in image segmentation because it has robust characteristics for ambiguity and can retain much more information than hard segmentation methods. FCM has been successfully applied to feature analysis, clustering, and classifier designs in fields such as astronomy, geology, medical imaging, target recognition, and image segmentation. An image can be represented in various feature spaces and the FCM algorithm classifies the image by grouping similar data points in the feature space into clusters. In case the image is noisy or distorted then FCM technique wrongly classify noisy pixels because of its abnormal feature data. Various approaches are proposed by researchers to compensate this drawback of FCM.
Rhee and Hwang [2] proposed Type-II fuzzy clustering. Type-II fuzzy set is the fuzziness in a fuzzy set. In this algorithm, the membership value of each pattern in the image is extended as Type-II fuzzy membership by assigning membership grades (triangular membership function) to Type 1 fuzzy membership. The membership values for the Type -II membership are obtained as:
^ik = -1- - where aik and uik are the Type-II and Type 1 fuzzy membership respectively. The cluster centers are updated accordingly using conventional FCM taking into account the new Type -II fuzzy membership. T. Chaira [3] recently proposed a novel intuitionistic fuzzy c-means algorithm using intuitionistic fuzzy set theory. This algorithm incorporates another uncertainty factor which is the hesitation degree that arises while defining the membership function.
The organization of the paper is as follows: Section II, briefly review Fuzzy C-Means (FCM) [1], Type-II FCM (T2FCM) [2], and Intuitionistic Fuzzy C-means (IFCM) [3]. Section III compares these three techniques
Fuzzy Logic- A Review and Comparison by implementing them on noisy digital images and compares the results qualitatively and quantitatively followed by concluding remarks in Section IV.
II. Background Information
This section briefly discusses the Fuzzy C-Means (FCM), Intuitionistic Fuzzy C means (IFCM), and TYPE-II Fuzzy C-means (T2FCM) algorithms. In this paper, the data-set is denoted by ‘X’, where X={x 1 , x 2 , x 3 , …… x n } specifying an image with ‘n’ pixels in M-dimensional space to be partitioned into ‘c’ clusters. Centroids of clusters are denoted by v i and d ik is the distance between x k and v i .
A. The Fuzzy C-Means Algorithm
FCM [1] is the most popular fuzzy clustering algorithm. It assumes that number of clusters ‘c’ is known in priori and minimizes the objective function (JFCM) as:
Jfcm =∑ 1=1 ∑k=l u/k^?k (1)
Where ^ik =‖ Xr - Vt ‖, and uik is the membership of pixel ‘xk’ in cluster ‘i’, which satisfies the following relationship:
FCM using Intuitionistic fuzzy set and (ii) intuitionistic fuzzy entropy (IFE). IFCM minimizes the objective function as:
c n
JlFCM =∑∑ U ∗ ™ dik +∑ K ∗ el-,r ∗
1=1 k=l 1 1
with m=2 (5)
U∗ = + П^ , where u∗ (uik) denotes the intuitionistic (conventional) fuzzy membership of the kth data in ith class.
K[R is hesitation degree, which is defined as:
^ik =1- Uik -(1- Uik“ ) ⁄« (6)
and
Л = ∑ k=l^ik , k ∈ [1, N ]
Second term in the objective function i.e. IFE is introduced to maximize the good points in the class. The goal is to minimize the entropy of the histogram of an image.
Modified cluster centers are:
∑ ∗
= k=l Wtk^-k vi =∑ n u ∗ ∑
∑ 1=1 Щк =1; к =1,2,…․․ n (2)
Here ‘m’ is a constant, known as the fuzzifier (or fuzziness index), which controls the fuzziness of the resulting partition. m=2 is used in this paper. Any norm
• can be used for calculating dik. Minimization of J FCM is performed by a fixed point iteration scheme known as the alternating optimization technique. The conditions for local extreme for (1) and (2) are derived using Lagrangian multipliers:
At each iteration, the cluster center and membership matrix are updated and the algorithm stops when the updated membership and the previous membership i.e.
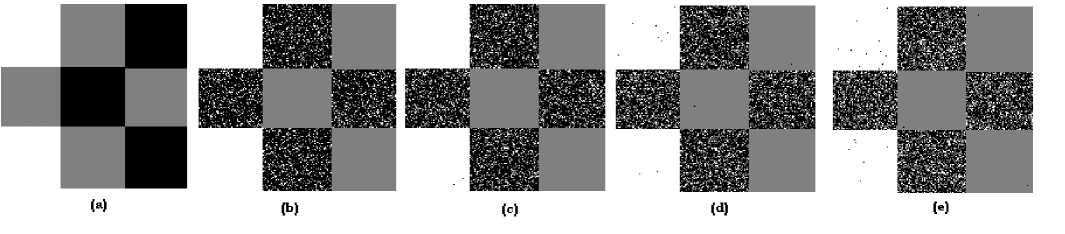
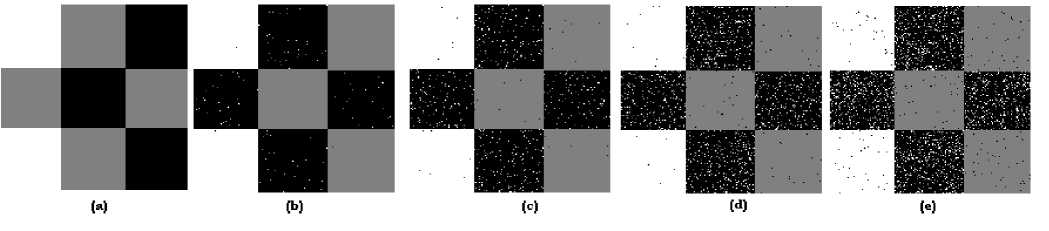
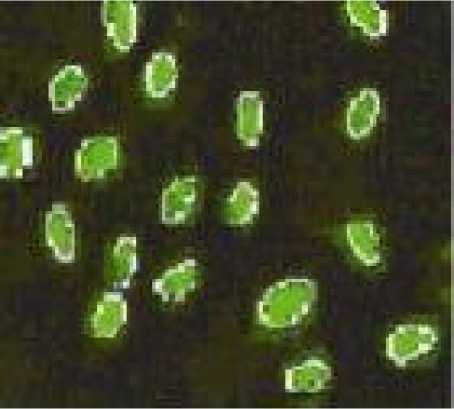
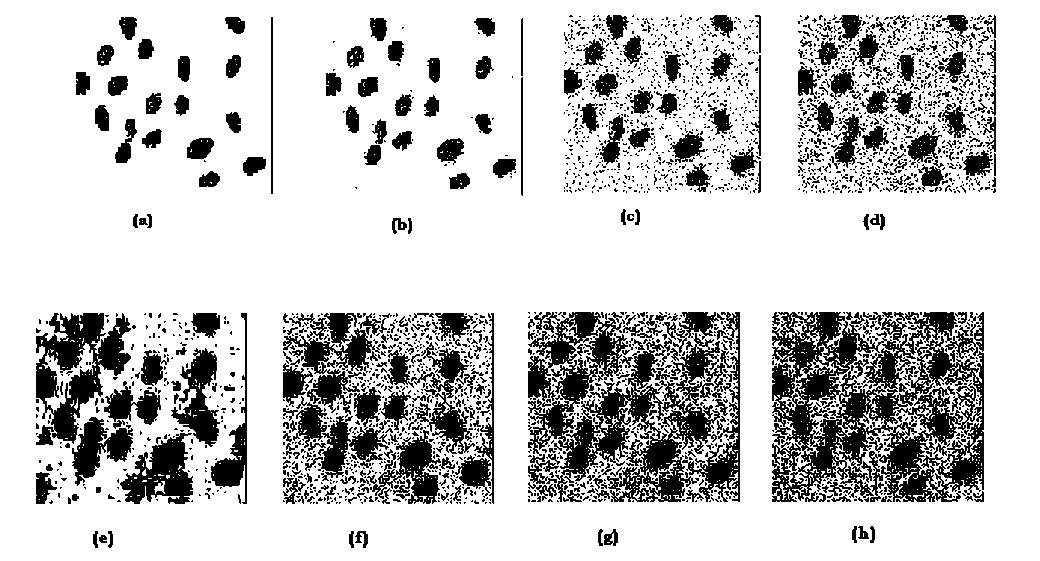
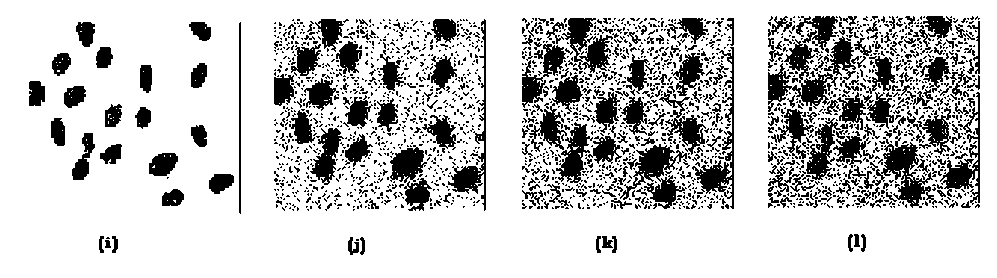
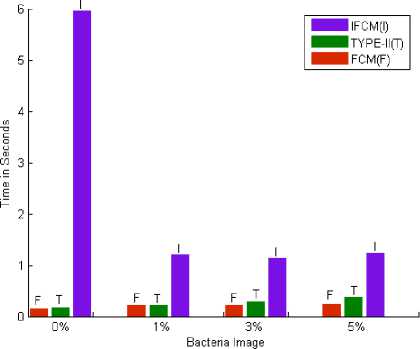
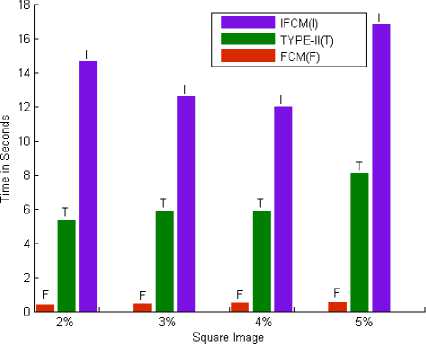
mctXik |U∗ new -u∗ ( | Utk = ∀к,i ∑j=l(4) where 1 ≤ i≤c; 1≤к≤n and ∑k=i(^^k) 1=∑k=i(ulk) ∀I The FCM algorithm iteratively optimizes JFCM (U,V) with the continuous update of U and V, until |U(l+1) – U(l)| <= ε, where ‘l’ is the number of iterations. FCM works fine for the images which are not corrupted with noise but if the image is noisy or distorted then it wrongly classifies noisy pixels because of its abnormal feature data which is pixel intensity in the case of images, and results in an incorrect membership and improper segmentation. C. The Type-2 Fuzzy C-Means (T2FCM) Rhee and Hwang [2] extended the TYPE-I membership values (i.e. membership values of FCM) to TYPE-II by assigning a membership function to each membership value of FCM TYPE-I. Their idea is based on the fact that higher membership values should contribute more than memberships that are smaller, when updating the cluster centers. TYPE-II memberships can be obtained as per following equation: U-ik = -^k (5) where aik and uik are the TYPE-II and TYPE-I fuzzy membership respectively. From (5), the type-2 membership function area can be considered as the uncertainty of the TYPE-I membership contribution when the center is updated. Substituting (5) for the memberships in the center update equation of the conventional FCM method gives the following equation for updating centers. V ∑k=i(aik)™xk 1=∑k=i(aik ) B. Intuitionistic Fuzzy C Means (IFCM) Intuitionistic fuzzy c-means [3] function contains two terms: (i) modified objective function of conventional During the cluster center updates, the contribution of a pattern that has low memberships to a given cluster is relatively smaller when using TYPE-II memberships and the memberships may represent better typicality. Cluster centers that are estimated by TYPE-II memberships tend to have more desirable locations than cluster centers obtained by TYPE-I FCM method in the presence of noise. T2FCM algorithm is identical to the TYPE-I FCM algorithm except equation (6). At each iteration, the cluster center and membership matrix are updated and the algorithm stops when the updated membership and the previous membership i.e. maxik |a'ikW - С12|<E,E is a user defined value. Although TYPE-II FCM has proven effective for spherical data, it fails when the data structure of input patterns is non-spherical and complex. III. Comparison and Results In this section, experimental results are presented to compare the segmentation performance of FCM, FCM TYPE-II, and IFCM. Two types of images are used: (1) Synthetic image (2) Real image. For both images, we are assuming the following computational protocols: ε = 0.002, Total number of iterations = 200. We chose m=2, which is a common choice for fuzzy clustering. Experiments are implemented and simulated using MATLAB Version 7.0. A. Square Image A synthetic square image (160 x 170 x 3 pixels) consisting of 9 squares is generated as shown in Fig. 1(a). It contains gaussian noise to create noisy versions of original image. The image represents three intensity levels with the values 255, 128 and 0. Fig. 1(a) in each row represents the original image. Upon surveying the 1st row of Fig.1 (b), (c), (d), and (e) which are the segmented images obtained on applying FCM algorithm to the original image with different noise levels, it was observed that as noise increases from 2%-5%, its effect can be seen equally in all the three clusters i.e. noise increases slowly and gradually, bit by bit in all the three intensity regions. FCM does nothing to remove the effect of noise, whether it is 1% or 5%. Now coming on to the 3rd row, which are the segmentation results of IFCM, we monitored that the noise increases slowly, little by little in all the three clusters similar to that of FCM, but the impact of noise is much less as compared to FCM, which means that IFCM tends to remove the noise as far as it can to get a better segmentation. So when it comes to comparison between these two methods used for image segmentation IFCM proves to be a better candidate. Now moving on to the results of FCM TYPE-II, in case of 2% noise, it was seen that the effect of noise is immense in the black region with noise completely removed from the white and gray regions. Moving a little further to the images with 3% and 4% noise, it was again seen that the noise in black region is immense with a little growth of noise in white and gray portions. Finally in case of 5% noise, it again does nothing to remove noise from the black region of the image with an increase in the noise in gray and white portions in comparison to the previous images obtained from FCM TYPE-II, but in comparison to the results obtained from the other two methods with 5% noise, it did a remarkable job (only for gray and white portions). Fuzzy Logic- A Review and Comparison Figu. 1 (a) in each row represents the original image, (b),(c),(d),(e) in 1st row represent results of FCM with 2%,3%,4% and 5% noise respectively; (b),(c),(d),(e) in 2nd row represent results of FCM TYPE-II with 2%,3%,4% and 5% noise respectively; (b),(c),(d),(e) in 3rd row represent results of IFCM with 2%,3%,4% and 5% noise respectively Fig. 2 Original Bacteria Image Fig. 3 (a),(b),(c),(d) represent segmentation results of FCM with 0%,1%,3% and 5% noise respectively; (e),(f),(g),(h) represent segmentation results of FCM TYPE-II with 0%,1%,3% and 5% noise respectively; (i),(j),(k),(l) represent segmentation results of IFCM with 0%,1%,3% and 5% noise respectively B. Bacteria Image A real bacteria image (126 x 140 x 3 pixels) consisting of two classes is considered and it is corrupted with gaussian noise to show the performance of all the techniques. The bacteria are separated from its background using all the three methods. Fig. 2 represents the original bacteria image. Fig. 3(a)-(d) represent results of FCM with 0%,1%,3% and 5% noise respectively,(e)-(h) represent results of FCM TYPE-II with 0%,1%,3% and 5% noise respectively, (i)-(l) represent results of IFCM with 0%,1%,3% and 5% noise respectively. It is observed that FCM and IFCM are able to retain the boundaries of bacteria more effectively as compared to FCM TYPE-II method. On examining Fig. 3 (a), (b), (c) and (d) carefully, which are the FCM segmentation results, we observed that FCM algorithm worked best in the absence of noise (Fig.3 (a)). As the noise increases, its effect can be seen in both the bacteria and the background, FCM does nothing to remove the noise in the bacteria resulting in distorted, noisy segmented image which is not suitable to be used for bacterial classification in medical diagnosis. When compared with the results of IFCM(Fig.3(i),(j),(k),(l)), it is seen that in the absence of noise both FCM and IFCM produce exactly the same result, but in the presence of noise the results of IFCM are better than those of FCM. One major point to be noted in the results of IFCM is-in 1% noise, although IFCM removes the noise completely from bacteria, which is our major objective here, but the size of bacteria is increased in some proportion with the original one. Now, as the noise is increased to 3% and 5% respectively, the results of IFCM are better as compared to the other two methods. Finally on exploring the results of FCM TYPE-II, we observed that in the absence of noise, the boundaries of bacteria are vague, imprecise and hazy along with an increase in the size of bacteria resulting in wrong segmentation. Now, in the segmented images with 1%, 3% and 5% noise, it is apparent that FCM TYPE-II removes noise comparatively from the bacteria but the size of bacteria is amplified/augmented. This makes it stand second where IFCM stands first taking into account both size and noise. Table 1 shows performance of these algorithms quantitatively using cluster validity functions. Finally when it comes to comparison between these three methods for all kinds of images, we conclude that, in the absence of noise, FCM works best with IFCM standing at par with it. Whereas, in the presence of noise, IFCM has the best segmentation results in comparison to those of FCM and FCM TYPE-II. According to our observation, TYPE-II FCM is really unpredictable as in you cannot be sure of the region in the image where it will work and where it will not. C. Performance Evaluation (i) Performance evaluation of algorithms based upon cluster Validity Functions In addition to the analyses of the qualitative evaluation presented above, we also calculated quantitative evaluation by using various cluster validity functions, to measure the segmentation accuracy. To evaluate the performance of segmentation quantitatively, two types of cluster validity functions are generally used: the fuzzy partition and the feature structure. The representative functions for the fuzzy partition are partition coefficient [4] and partition entropy [5]. They are defined as: -c (U) = ^ ^ ck=.и 1t (11) Vpe (U) = -^{ZF=^Mdlouu^ (12) Fuzzy Logic- A Review and Comparison TABLE-1 Performance Comparison of FCM, FCM TYPE-II, and IFCM in Terms of Cluster Validity Functions Image Name No. of Clusters Noise %age Methods The value of Validity Functions Vfs Vpc Vpe Vxb Bacteria 2 0% FCM 5658.7 .94952 .094135 .02543 FCM TYPE-II 290.6 0.56866 -0.12792+i1.9675 2.6477 IFCM 5459.7 0.94912 0.095595 0.027069 1% FCM 5437.6 .86184 .24873 .078188 FCM TYPE-II 824.05 0.44273 -0.12718+i1.8219 0.56943 IFCM 1635.5 .50003 .69312 16509 3% FCM 3854.6 .72187 .43758 .2348 FCM TYPE-II 1309.7 .42131 -0.14187+i1.7954 0.5028 IFCM 2213.7 .50011 .69304 2946.5 5% FCM 4008.1 .67785 .49217 .34643 FCM TPE-II 1624.7 .41333 -0.15394+i1.7817 0.49473 IFCM 2685.2 .50001 .69314 26354 Square 3 2% FCM -24117 .83975 .31867 .05239 FCM TYPE-II 13434 1.2789 -0.50246+i4.9318 4.6497e+30 IFCM -22573 .83539 0.3276 .055924 3% FCM -19902 .78635 .40445 .075385 FCM TYPE-II 14335 1.2831 -0.50287+i4.9383 1.4633e+28 IFCM -17593 .77664 .42299 .085029 4% FCM -16520 .74467 .47018 .097284 FCM TYPE-II 14395 1.2698 -0.50176+i4.9294 1.9347e+025 IFCM -13837 .72988 .49702 .11439 5% FCM 14036 .71338 .51918 .11944 FCM TYPE-II 14573 1.2567 -0.50188+i4.9205 2.142e+028 IFCM -11141 .69613 .5497 .14492 Best clustering results can be achieved when the value Vpc is maximal or Vpe is minimal. Disadvantage of Vpc and Vpe are that they measure only the fuzzy partition and do not specify featuring property. To solve this problem, other validity functions based on the feature structures are used [6], [7]. They are defined as: с и Vfs (и,V;X)=∑∑uik(‖Xi - Vk ‖2 k=l i=l Where ̅=- ∑k=lVk ^xb (U)= ∑k=i∑i-iuki‖Xj-Vk ‖ n∗(mink# J{‖Vk-vj‖}) -‖Vk - ̅‖2) Where Vfs is a Fukuyama-Sugeno function and Vxb is Xie-Beni function. When either Vfs or Vxb is minimal, a better clustering result is achieved [6], [7]. TABLE-1 shows performance comparison of FCM, Type-II FCM, and IFCM in terms of these four cluster validity functions. (ii) Performance evaluation of algorithms based upon execution time Fig. 4 shows bar charts of the execution time of FCM, Type-II FCM, and IFCM for Bacteria and Square images. TABLE-2 lists execution time and convergence rate of the algorithms. It is observed that FCM technique has least execution time compared to other image segmentation techniques. But the convergence rate of IFCM algorithm is best. Image Name Noise %age Technique Execution Time (Sec.) No. of Iterations (Conv. Rate) Bacteria 0% FCM 0.141 14 FCM TYPE-II 0.172 16 IFCM 5.954 15 1% FCM 0.218 22 FCM TYPE-II 0.219 20 IFCM 1.203 3 3% FCM 0.227 30 FCM TYPE-II 0.281 25 IFCM 1.14 3 5% FCM 0.235 28 FCM TYPE-II 0.375 37 IFCM 1.235 3 Square 2% FCM 0.375 14 FCM TYPE-II 5.344 200 IFCM 14.657 18 3% FCM 0.422 16 FCM TYPE-II 5.844 200 IFCM 12.609 19 4% FCM 0.516 20 FCM TYPE-II 5.891 200 IFCM 11.969 18 5% FCM 0.531 20 FCM TYPE-II 8.094 200 IFCM 16.813 22 Fig. 4. Performance of FCM, Type-II FCM, and IFCM in terms of execution time for Bacteria and Square Image IV. Conclusion Digital images generally contain unknown noise and considerable uncertainty. Traditionally, FCM is a popular segmentation method for digital images. However, it is an intensity-based clustering algorithm which is not robust against noisy images. In this paper, we have compared Fuzzy C-Means (FCM), TYPE-II Fuzzy C-Means (T2FCM), and Intuitionistic Fuzzy C-Means (IFCM) methods for different noise levels. We observed the results of these three algorithms on two different kinds of images-Bacteria and Square. Upon carefully examining the results, we obtained two entirely different conclusionsone for images with no noise and the other for images with noise. In the absence of noise, FCM generated finest results, with IFCM finishing as a close competitor and TYPE-II FCM nowhere close. Whereas, in the presence of noise, IFCM comes up with the best segmentation results in comparison to those of FCM and TYPE-II FCM. FCM does nothing to remove the noise in the bacteria whereas TYPE-II FCM did a good job in removing noise to a great extent at the cost of relative increase in size of the bacteria. In case of the square image, TYPE-II FCM algorithm, 8 and 10 times, was unable to recognize the three actual clusters mistakenly recognizing only two among them. So, we can conclude that TYPE-II FCM does not have the characteristics of a good and efficient method for image segmentation. It may have had shown good results theoretically but practically its results are not in compliance with those obtained in theory. And IFCM is best only amongst these three methods. Some better results may be obtained by applying some other algorithm which can remove noise better than IFCM when used on the same images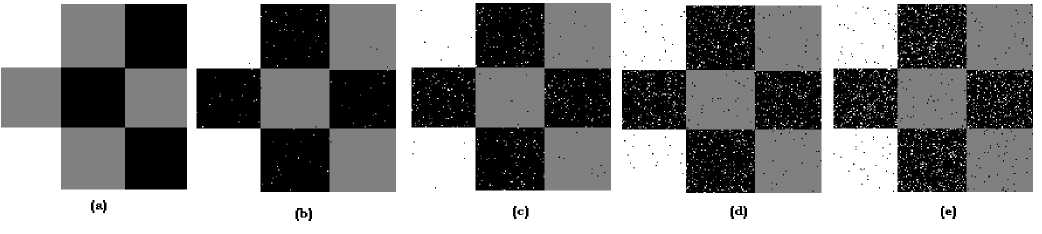
References Image Segmentation Techniques for Noisy Digital Images based upon Fuzzy Logic- A Review and Comparison
- J.C. Bezdek (1981), “Pattern Recognition with Fuzzy Objective Function Algorithm”, Plenum, NY.
- F.C.H. Rhee, C. Hwang, A Type-2 fuzzy c means clustering algorithm, in: Proc. in Joint 9th IFSA World Congress and 20th NAFIPS International Conference 4, 2001, pp. 1926–1929.
- T. Chaira, “A novel intuitionistic fuzzy c means clustering algorithm and its application to medical images”, Applied Soft computing 11(2011) 1711-1717.
- Bezdek JC.(1974), “Cluster validity with fuzzy sets”, J Cybern 1974; 3:58–73.
- Bezdek JC.(1975), “Mathematical models for systematic and taxonomy”, In: proceedings of eigth international conference on numerical taxonomy, San Francisco; 1975, p. 143–66.
- Fukuyama Y, Sugeno M. (1989), “A new method of choosing the number of clusters for the fuzzy c-means method”, In: proceedings of fifth fuzzy system symposium; 1989, p. 247–50.
- Xie XL, Beni GA. (1991), “Validity measure for fuzzy clustering”, IEEE Trans Pattern Anal Mach Intell 1991;3:841–6.
