Immunomodulatory properties of bambara groundnut condiment extract in diarrhoeal induced rats

Author: Olanipekun O.T., Akinloye O.A., Ayanda O.E., Ugbaja R.N., Afolabi T.A.
Journal: Журнал стресс-физиологии и биохимии @jspb
Article in issue: 4 т.20, 2024.
Free access
Functional foods optimize the immune system and prevent diseases which can lead to stress. In this work, authors investigated the immunomodulatory properties of bambara groundnut condiment extract, using leucocytes of diarrhoeal rats as probe. Wistar rats were sorted and divided into 5 groups by weight (n = 5). Rats were induced for diarrhoea using castor oil. Diarrhoeal rats were then treated as follows: Group 1 received 2.5 mg levamisole per kg body weight, groups 2, 3 and 4, received 100, 250, 500 mg of bambara groundnut condiment extract (BGCE) per kg body weight respectively; group 5 received 2.5 ml of 3% tween 80 per kg body weight. Following standard protocols, treated rats were assessed for immunoglobulins G and M, leucocyte mobilization, as well as primary and secondary antibody titre values. Attempt was also made to screen bambara groundnut condiment for phytochemicals, both qualitatively and quantitatively, following standard protocols. Obtained data were analysed by SPSS (version 20). Values were expressed as Mean ± S.E.M. Mean values were evaluated by one way analysis of variance (ANOVA) and means were separated by Duncan’s multiple range test (DMRT). Differences were considered significant at p function show_abstract() { $('#abstract1').hide(); $('#abstract2').show(); $('#abstract_expand').hide(); }
Bambara groundnut, condiment, diarrhoea, immunomodulatory, phytochemicals
Short address: https://sciup.org/143183438
IDR: 143183438
Text of the scientific article Immunomodulatory properties of bambara groundnut condiment extract in diarrhoeal induced rats
The Bambara tribe is the source of the name for the Bambara groundnut, which is native to Mali's Sahel Savannah terrain. Asia, Australia, and Central and South America are now the regions where bambara groundnut is grown (Bamishaye et al., 2011). It is also grown in tropical parts of Asia and Africa (Eltayeb et al., 2011). Nwadi et al. (2021) reported that bambara groundnut seeds are utilized as food, a meal complement, a food supplement, or a snack. Protein, vitamins, and minerals are abundant in it (Abu-Ghannam and Gowen, 2020). Additionally, bambara groundnut plants are therapeutic, they contain active ingredients used to cure diseases or to relieve pain (Nduche and Omosun, 2016). There have been reports on the application of bambara groundnut plant parts for treating human, animal, and even plant ailments. For instance, diarrhoeal patients reported that their symptoms improved when they were given water derived from boiling maize and bambara groundnut seeds (Harris et al., 2018). The leaves of wild lettuce, Lantana trifolia L. (Efo yanrin, Yoruba, Nigeria), are blended with bambara groundnut leaves to produce a solution as a prophylactic strategy against ticks in livestock management. The animals are then routinely washed with the solution. A pesticide solution composed of wild lettuce and bambara groundnut leaves is also applied to vegetables (Harris et al., 2018). Furthermore, combination of bambara groundnut leaves with the leaves of Mexican marigold leaves, (Tagetes minuta and L. trifolia), functions as an insecticide (Nahak and Kanta, 2018). Cattles that have mouth disease are fed with dried and ground bambara groundnut leaves, mixed with salt; this promotes healing of the wound (Bamishaye et al., 2011). The therapeutic values of plants have been traced to the phytochemicals in them, which are documented to improve the immune system of plant eaters (Bland, 2021). Fermentation as a food processing method makes food functional, as they become richer in bioactive compounds with health benefits (Adebo et al., 2021). Consumption of a healthy diet which comprise functional foods prevents non communicable diseases and optimizes the immune system; thereby conforming immunomodulatoty properties to functional foods (Bland, 2021). In this work, authors screened bambara groundnut condiment for phytochemicals and also made attempt at investigating the immunomodulatory properties of bambara groundnut condiment, using leucocytes of diarrhoeal rats as probe.
MATERIAL AND METHODS
Processing of bambara groundnut condiment flour
The condiment flour prepared from bambara ground nut seeds was processed using a modified version of the Farinde et al. (2007) method.
Preparation of bambara groundnut condiment extract (BGCE)
The bambara groundnut condiment extract (BGCE) was made using the Olanipekun et al. (2024) method. In summary, 250 grams of bambara groundnut condiment flour were soaked for 72 hours in 2500 milliliters of 70% pure methanol. Using a vacuum rotary evaporator (Buchi Rotavapor R210/215, Switzerland), the filtrate was collected after 72 hours and concentrated. The solvent was then allowed to evaporate by immersing it in a water bath that was heated to 40 °C.
Preparation of BGCE solution for in vitro phytochemical screening
The BGCE (5 g) was dissolved in 45 ml of distilled water to make 10 % BGCE solution (1:9 w/v).
Qualitative phytochemical screening of bambara groundnut condiment extract (BGCE)
The standard protocol outlined by Trease and Evans (1989) and Sofowora (1993) was followed while conducting phytochemical assays on BGCE.
Test for tannins
In a test tube, a 1 ml BGCE solution was brought to a boil in 20 ml of distilled water, and the mixture was subsequently filtered. It was mixed with a few drops of 0.1% ferric chloride. The presence of tannin was inferred from the green coloration.
Test for phlobatanins
Aqueous hydrochloric acid (1%) was used to boil a 2 ml solution of BGCE. The presence of phlobatanins was inferred from the red precipitate that was deposited.
Test for saponin
In a water bath, 5 ml of bambara groundnut condiment extract (BGCE) was heated with 20 ml of distilled water, and the resulting liquid was then filtered. A consistent, long-lasting froth was achieved by rapidly shaking 10 milliliters of the filtrate with 5 milliliters of distilled water. Three drops of olive oil were added to the foam, and it was violently shaken. The presence of saponin was confirmed by the formation of an emulsion.
Test for flavonoids
Five milliliters of BGCE solution were mixed with three milliliter of 1% aluminum chloride solution. The resultant yellow colouring was taken as indication that the extract might include flavonoids. Confirmation for flavonoids was made when the yellow colour disappeared after adding 5 ml of diluted ammonia solution and concentrated tetra-oxo sulphate (vi) acid to the yellow mixture.
Test for steroids
Two milliliters of acetic anhydride were added to two milliliters of the BGCE solution, this was followed by addition of milliliters of tetra-oxo sulphate (vi) acid. The change in colour, from violet to green indicated the presence of steroids.
Test for terpenoids
Chloroform (2 ml) was combined with a 5 ml solution of bambara groundnut condiment extract (BGCE). Carefully, 3 milliliters of concentrated H 2 SO 4 were added, and a bilayer was formed. A reddish brown colouration at the interface was taken as confirmation of the presence of terpenoids.
Test for cardiac glycosides and cardenolides
Five milliliters of Bambara groundnut condiment extract solution were treated with two milliliters of glacial acetic acid that contained one drop of ferric chloride solution. One milliliter of tetra-oxo sulphate (vi) acid was then added. Cardenolides are present when a brown ring is formed at the interface (the brown ring is a chracteristics of de-oxy sugars). The presence of glycosides was verified by the emergence of a violetgreen ring immediately beneath the brown ring.
Test for alkaloids
-
1 milliliter of BGCE solution was mixed with 5 milliliters of 1% aqueous HCl on a steam bath at 50°C for approximately ten minutes. The mixture was filtered
while it was still hot, and to 1 milliliter of the filtrate, few drops of potassium mercuric iodide solution were added. The formation of a cream color confirmed the presence of alkaloids.
Test for anthroquinones
Benzene (10 ml) was added to 5 ml of BGCE solution with thorough stirring, the mixture was filtered and filtrate was mixed with 10 % ammonia solution (1:1 v/v). After shaking the mixture, development of a pink in the lower phase indicated the presence of anthraquinones.
Test for chalcones
Ammonia solution (10 %, 2 ml) was added to 5 ml BGCE solution. Formation of reddish colour confirmed the presence of chalcones.
Test for Phenol
Bambara groundnut condiment extract solution (5 ml) was put into a 30 ml test-tube, then distilled water (10 ml), ammonium hydroxide solution (2 ml), and concentrated aryl alcohol (5 ml), were added in order. The mixture was allowed to stand for thirty minutes at room temperature. Development of blue-green colour indicated the presence of phenol.
Quantitative determination of phytochemicals in bambara groundnut condiment extract
The phytochemicals that were found in appreciable amounts during qualitative screening were further assessed for quantitative analyses using standard methods.
Quantitative determination of tannins
This was done by the method of Ejikeme et al. (2014). BGCE (0.2 g) was measured into a 50 ml beaker. 20 ml of 50 % methanol was added and covered with paraffin. The mixture was placed in a water bath whose temperature was maintained at 80 ± 2 °C for 1 hour. The mixture was shaken thoroughly at intervals to ensure uniform mixing. The mixture was then filtered using a double layered Whatman No 1 filter paper into a 100 ml volumetric flask. 20 ml of distilled water was added to the filtrate followed by the addition of 2.5 ml Folin-Denis reagent (dissolving 50 g of sodium tungstate (Na2WO4) in 37 cm3 of distilled water) and 10 ml of 17 % sodium carbonate solution; the mixture was thoroughly shaken together, distilled water was added to make the 100 ml mark and the mixture was allowed to stand for 20 minutes for blue colour development. Standard tannin solutions (1-10 ppm) were prepared from 100 ppm stock solution. Absorbance of the standard tannin solutions were read at 760 nm. Graph of absorbance against concentration was made and gradient factor was calculated from the graph. Absorbance of BGCE solution was also read after colour development on a spectronic 21D spectrophotometer at a wavelength of 760 nm. Tannin concentration was determined as percentage using the equation below:
% Tannin =
AxgxD wx 10,000
where A = Absorbance g = gradient factor
D = dilution factor w = Weight of sample
1 / 10,000 = conversion factor to convert ppm to percentage
Quantitative determination of alkaloids
Quantitative determination of alkaloid was determined as described by Ezeonu and Ejikeme (2016). In a 250 ml beaker, 200 ml 10 % acetic acid in ethanol and 2.5 g of the BGCE were added. The mixture was allowed to stand for 4 hours, this was followed by addition of 15 drops of concentrated ammonium hydroxide drop wise until there was complete precipitation. After 3 hours of mixture sedimentation, the supernatant was discarded and precipitate was washed with 20 cm3 of 0.1 M ammonium hydroxide, followed by filtration, the residue was dried in an oven and weight recorded.
The percentage alkaloid was expressed as
% Alkaloid =
Weight of alkaloid Weight of sample x 100
Quantitative determination of flavonoids
Flavonoid determination was by the method reported by Ejikeme et al. (2014). 2.5 g of BGCE was measured into a 250 ml beaker, 50 ml of 80 % aqueous methanol was added and the mixture was allowed to stand for 24 hours at room temperature. After decanting the supernatant, the residue was re-extracted three times with the same volume of methanol. Whatman No 42 filter paper (125 mm) was used to filter the solution. The filtrate was then transferred into a crucible and evaporated to dryness over a water bath. The content in the crucible was dried to constant weight and cooled in a dessicator. The percentage flavonoid was calculated thus:
% Flavonoid =
Weig ht of flavonoids Weightofsample x 100
Quantitative determination of saponin
Saponin quantitative determination was done by the method reported by Ejikeme etal (2014). 100 ml of 20 % aqueous ethanol was added to 5 g BGCE in a 250 ml beaker. The mixture was heated over a hot water bath set at 55 °C for four hours with continuous stirring, followed by filtration, the residue of the mixture was reextracted with another 100 ml of the solvent. The combined extract was evaporated to 40 ml over water bath at 90 °C. 20 ml of diethyl ether was added to the concentrate in a 250 ml separator funnel and vigorously agitated from which the aqueous layer was recovered and the other layer discarded. This purification process was repeated twice, after which 60 ml of n-butanol was added and extracted twice with 10 ml of 5 % sodium chloride. After discarding the sodium chloride layer, the remaining solution was heated in a water bath for 30 minutes, after which the solution was transferred into a crucible and dried in the oven to a constant weight.
Saponin content was calculated as
% saponin =
Weightofsaponin Weightof sample x 100
Quantitative determination of glycoside
Glycoside determination was done as reported by Amadi etal. (2004). 1 g of BGCE was weighed into a conical flask containing 20 ml of 2.5 % sodium hydroxide and anti-foaming agent (tannic acid). 100 ml of cyanogenic glycoside, 8 ml of 6 M ammonium hydroxide and 2 ml of 5 % potassium iodide were also added to the filtrate, mixed and titrated with 0.02 M silver nitrate solution. End point was point of turbidity. Glycoside content was calculated by the formula
Titre value ( ml ) x 1.08 x extract volume Glycoside ( % ) = x 100
Aliquot volume ( ml ) x sample weight
Where 1.08 = equivalent weight of silver nitrate (0.02 M) to potassium iodide.
Quantitative determination of steroids
Determination of steroids was as described by Harbone (1973). 0.5 g of BGCE was measured into a 100 ml beaker, 20 ml of chloroform: methanol mixture (2:1 v/v) was added, the mixture was vigorously shaken for 30 minutes on a shaker. The mixture was after then filtered and filtrate collected into another dried and clean
100 ml conical flask. The residue was re-treated twice with the chloroform: methanol mixture to make sure it is free of steroids. 1 ml of the filtrate was then pipetted into a 30 ml test tube and 5 ml alcoholic potassium hydroxide was added, the mixture was shaken thoroughly to obtain a homogenous mixture. The mixture was placed in a water bath set at 40 °C for 90 minutes, it was cooled to room temperature and 10 ml of petroleum ether was added, followed by the addition of 5 ml distilled water, then evaporation to dryness. 6 ml of Liebermann Burchad reagent was added and absorbance taken at a wavelength of 620 nm on a spectronic 21 D spectrophotometer. Standard steroid concentrations of 0 - 4 mg/ml were prepared from 100 mg/ml stock solution and treated similarly to the sample (BGCE). Graph of absorbance against concentration was made and gradient factor was calculated from the graph. Steroids concentration was determined as percentage using the equation below:
% steroids =
( AXgXD ) wX 1,000
where A = Absorbance of sample g = gradient factor w = weight of sample
D= dilution factor
1 / 1,000 = conversion factor to convert mg/ml to percentage
Quantitative determination of phenol
This was done as described by Amadi et al. (2004). 0.5 g of BGCE was boiled for 15 minutes with 50 ml ether to extract phenolic compounds. 10 ml distilled water, 2 ml of 0.1 N ammonium hydroxide solution and 5
ml of concentrated aryl alcohol were added to 5 ml of the phenolic extract and left to stand for 30 minutes for colour development. Absorbance was measured at 505 nm. Phenol standard curve was prepared by dissolving 0.2 g tannic acid in distilled water and diluting to the 200 ml mark. 0.2 – 1.0 mg/ml of the standard tannic acid solution were pipetted into five different test-tubes to which 2 ml of ammonium hydroxide, 5 ml of aryl chloride and 10 ml of water was added. The solution was made up to 100 ml volume and made to stand for 30 minutes for colour development. Absorbance was also determined at 505 nm. Graph of absorbance against concentration was made and gradient factor was calculated from the graph.
Phenol content was calculated thus:
AXgxD
% Phenol = g— wX 1,000
Where A= Absorbance g = Gradient factor
D = Dilution factor w = Weight of sample
1 / 1,000 = conversion factor to convert mg/ ml to percentage
Induction of diarrhoea in rats
Castor oil was used to induce diarrhoea in rats by gavage, as reported by Olanipekun et al. (2024).
Immuno-modulatory properties of BGCE in diarrhoeal rats
Immuno modulatory properties of BGCE were assessed by the carageenan induced leucocyte mobilisation and haemaglutination antibody titre in diarrhoeal induced rats as described by Onwuka et al. (2016).
Carageenan induced leucocyte mobilisation in diarrhoeal rats
Tewnty five rats were divided into five groups (n= 5). Rats were allowed to acclimatise for 7 days after which they were induced for diarrhoea with castor oil as described by Olanipekun et al. (2024). After diarrhoea was established in the rats, animals were treated as in
Table 1.
1 hour after the treatment, each rat received intraperitoneal injection of 0.5 ml of 1 % (w/v) carrageenan suspension in normal saline (0.9 % NaCl). Four hours after carrageenan injection was given, rats were bled through the jugular vein into previously labeled heparinised bottles to obtain plasma. The plasma was used for the assessment of immunoglobulins (IgG and IgM). The rats were opened up and the peritoneum washed with 5 ml of 5 % solution EDTA in phosphate buffered saline PBS. The peritoneal blood was collected into EDTA bottles for the determination of total white blood cell count and differentials (leucocyte mobilisation).
Determination of IgG and IgM concentrations in plasma of diarrhoeal rats
Blood samples were centrifuged at 5,000 rpm for 10 minutes to obtain plasma. The plasma was carefully transferred into previously labelled eppendof tubes and plasma samples were fed into rapid analyser machine (COBAS 6000, Roche, Germany) for immunoglobulins G and M. Values of IgG and IgM were automatically produced by the machine.
Determination of total and differential white blood cell (WBC) counts in diarrhoeal rats
Determination of total and differential leucocyte (WBC) count was carried out by the method described by Lewis (2006). 20 µl of blood was drawn into the Pasteur pipette after which 350 µl of Turk’s solution (WBC diluting fluid) was drawn and mixed with the blood. The counting chamber was cleaned and the cover slip mounted on it. The diluent i.e the diluted sample of blood and Turk’s solution was remixed and introduced into the counting chamber. This was allowed to stand for 2 minutes. The set-up was then mounted on a light microscope and the cells counted in 4 large squares of the counting chamber, using the x10 magnification lens. To determine differential leucocyte count, Leishman staining technique was used. 20 µl of the fluid (the diluent) was placed on one end of the grease free slide using the push wedge technique, where the spreader was placed at the acute angle in front of the fluid and the fluid was allowed to run along the edge of the spreader.
Then, the spreader was moved forward in an even movement to obtain a fine fluid. The film was allowed to dry, after which Leishman stain was used to cover it. The set-up was allowed to dry for the next 2 minutes. Thereafter, buffered distilled water of pH 6.8 (double the quantity of stain used) was used to flood the film. After 5 minutes, stain was rinsed with more buffered distilled water (pH 6.8), slide was allowed to dry and then examined under the microscope using the oil immersion objective lens (x 100 magnification). The cells were counted and differentiated on morphological basis using tally counter.
Haemaglutination antibody titre of diarrhoeal rats
The haemaglutination antibody titre was evaluated by the method of Gabhe et al. (2006). Another set of 25 rats were used for the experiment and they were grouped and dosed as in Table 1 above. One hour after dosing, each rat received 0.1 ml 40 % sheep red blood cell (SRBC) suspension injected into the subplantar region of the right hind paw of the rats. Dosing (drug administration) continued daily until day 7 of the experiment. The remaining SRBC was kept in the refridgerator at 4 °C. On the 7th day of the experiment, blood samples were collected through the retro orbital plexus of the rats into plain bottles to obtain serum. The blood was centrifuged at 5000 rpm for 10 minutes and supernatant (serum) was used for the evaluation of primary (1°) haemaglutination antibody titre. After the collection of blood, the rats were re-challenged by injecting 0.1 ml of 40 % SRBC suspension into the subplantar region of the left hind paw of the rats. Dosing continued until the fourteenth day of the experiment. On the fourteenth day of the experiment, blood samples were collected through the retro orbital plexus of the rats into plain bottles to obtain serum and the sera of the rats were used for the evaluation of secondary (2°) haemaglutination antibody titre.
Isolation of sheep red blood cell (SRBC)
Blood (5 ml) was drawn from each of two sheep reared at the animal farm of Trypanotolerant Livestock Improvement Programme (TLIP), Institute of Agricultural Research and Training, Ibadan. The blood was drawn into heparin bottles. The blood was pooled together to make 10 ml. Red blood cells were isolated from whole blood by the method of Hanson et al. (2008). The whole blood was centrifuged at 5000 rpm for five minutes, levels of haematocrit (red lower layer) and plasma (yellowish upper layer) were marked on the tube. The plasma layer was aspirated carefully with micropipette leaving only the haematocrit in the tube. 150 mM NaCl solution was gently used to cover the haematocrit in the tube to the original level of plasma (previously marked). The tube was capped and inverted three times to mix the content gently. Then, content was centrifuged at 5000 rpm for another five minutes. Plasma layer was aspirated again and PBS (pH 7.4) was used to cover the haematocrit (instead of the NaCl solution). This was followed by three times invertion and another round of centrifugation at 5000 rpm. The whole process was repeated 3 more times.
Determination of primary (1°) haemaglutination antibody titre in diarrhoeal rats
This was done as described by Gabhe et al. (2006). Micro titre plates were arranged in 25 rows of 10 plates each. 0.1 ml of phosphate buffered saline PBS (pH 7.4) was put into each plate. Then, 0.1 ml of serum was added to the first plate on each row, giving a 0.2 ml mixture of PBS and serum (50:50 v/v). 0.1 ml of the mixture was transferred to the next plate and the serial dilution continued till the last plate. 0.1 ml of SRBC suspension (1 %) was added into the plates, incubation followed at 37 °C for 30 minutes. The plates were placed in the refrigerator until the following morning. On the following morning, plates were brought out of the refrigerator and inspected for agglutination. Plates where agglutination was observed were marked positive (+) while those that had no agglutination were marked negative ( - ). Titre value was taken as the inverse of the last dilution that gave positive agglutination. The second plate in each row was taken as the first dilution.
Determination of 2° haemaglutination antibody titre in castor oil-induced diarrhoeal rats
Determination of 2° haemaglutination antibody titre value was done as described for 1° haemaglutination antibody titre.
Statistical analyses
Data were analysed by SPSS (version 20). Values were expressed as Mean ± S.E.M. Mean values were evaluated by one way analysis of variance (ANOVA) and means were separated by Duncan’s multiple range test (DMRT). Differences were considered significant at p < 0.05 .
RESULTS
The result of qualitative phytochemical screening of BGCE is given in Table 2. The result revealed that chalcones, anthraquinones and cardinolides were completely absent, while alkaloids, tannins, saponins, flavonoids, steroids, phenols and glycosides were found in appreciable amounts.
The result for the quantitative phytochemical screening of BGCE is given in Table 3. Result revealed that all the identified phytochemicals were within safe limits.
In Table 4 is the result of leucocyte mobilization in diarrhoeal rats. The rats that received 3 % tween 80 had the highest concentration of total leucocyte count (TLC), neutrophils and lymphocytes. Neutrophils were the most mobilised leucocytes. Diarrhoeal rats treated with BGCE at (100, 250 500) mg / kg bw had reduced leucocyte mobilization,
Fig. 1 shows the results of the plasma concentrations of immunoglonulins – IgG and IgM in the experimental rats. IgG concentration values were consistently higher than that of IgM. There were significant differences (p < 0.05) in the values of IgG and IgM across the groups.
Table 5 gives the antibody titre values of the experimental rats treated with BGNCE. The result revealed that secondary antibody titre values were generally higher than the primary antibody titre values, except for the rat group on levamisole, where 2° antibody titre was significantly lower (p < 0.05) than 1° antibody titre.
Table 1: Experimental design on leucocyte mobilisation in diarrhoeal rats
|
Rat group |
Treatment |
|
1 |
Levamisole, 2.5 mg/kg body weight |
|
2 |
BGCE, 100 mg/kg body weight |
|
3 |
BGCE, 250 mg/kg body weight |
|
4 |
BGCE, 500 mg/kg body weight |
|
5 |
3% Tween-80, 2.5 ml/kg body weight |
Table 2: Qualitative phytochemical screening of BGCE
|
Phytochemicals |
Observation |
Remark |
|
Alkaloids |
+++ |
AA |
|
Tannin |
+++ |
AA |
|
Phobatannin |
+ |
TA |
|
Saponin |
+++ |
AA |
|
Flavonoids |
+++ |
AA |
|
Anthraquinones |
- |
ND |
|
Steroids |
+++ |
AA |
|
Terpenes |
+ |
TA |
|
Cardenolides |
- |
ND |
|
Phenol |
+++ |
AA |
|
Chalcones |
- |
ND |
|
Glycosides |
+++ |
AA |
|
AA- Appreciable amount |
TA- Trace amount |
ND – Not detectable |
Table 3: Quantitative phytochemical screening of BGCE
|
Phytochemicals |
Value ± SEM |
(%) |
|
Alkaloids |
0.679 ± 0.02 |
|
|
Tannin |
0.055 ± 0.01 |
|
|
Steroids |
0.023 ± 0.01 |
|
|
Saponin |
0.291 ± 0.03 |
|
|
Flavonoids |
0.036 ± 0.02 |
|
|
Phenol |
0.125 ± 0.01 |
|
|
Cardiac glycoside |
0.142 ± 0.02 |
Values are means of three determinations ± SEM
Table 4: Leucocyte mobilisation of castor oil-induced diarrhoeal rats
|
TLC (x103/ µl) |
Neutro (x103 / µl) |
Lymph (x103 / µl) |
Baso (x103 / µl) |
Eosino (x103 / µl) |
Mono (x103 / µl) |
|
|
Lev. 2.5mg / kg bw |
10.37± 2.34b |
6.83± 0.04d |
0.31 ± 0.00d |
0.11± 0.01d |
0.30± 0.00d |
0.20± 0.00d |
|
100 mg BGNCE / kg bw |
13.21± 3.14ab |
11.26± 0.15b |
0.34± 0.00c |
0.13± 0.00c |
0.35± 0.01c |
0.24± 0.00c |
|
250 mg BGNCE / kg bw |
12.72± 2.02ab |
7.80± 2.47c |
0.36± 0.00b |
0.16± 0.00b |
0.38± 0.00bc |
0.28± 0.00b |
|
500 mg BGNCE / kg bw |
11.18± 1.63ab |
7.05± 0.09c |
0.40± 0.01a |
0.18± 0.02b |
0.41± 0.02b |
0.31± 0.00a |
|
3% tween 80 (2.5 ml / kg bw) |
14.26± 2.11a |
13.10± 1.74a |
0.42± 0.00a |
0.22± 0.00a |
0.44± 0.01a |
0.16± 0.01e |
Values are means of five determinations ± SEM. Means with different alphabets within the column are significantly different (p < 0.05)
TLC = Total Leucocyte Count, Lymph = Lymphocytes, Neutro = Neutrophils Baso = Basophils,
Eosino = Eosinophils Mono = Monocytes Lev = Levamisole,
BGNCE =Bambara groundnut condiment extract
Table 5: Effect of BGCE, levamisole and tween 80 on primary (1°) and secondary (2°) antibody titre values for castor oil-induced diarrhoeal rats
|
Treatment groups |
1° titre |
2° titre |
|
lvmsl 2.5 mg/kg bw |
19.20 ± 3.20b |
16.00 ± 0.00c |
|
BGCE 100 mg/kg bw |
16.00 ± 0.00b |
25.60 ± 3.91b |
|
BGCE 250 mg/kg bw |
28.80 ± 3.20a |
28.80 ± 3.20b |
|
BGCE 500 mg/kg bw |
25.60 ± 3.92a |
32.00 ± 0.00a |
|
tween 80 2.5 ml/kg bw |
5.20 ± 1.20d |
8.00 ± 0.00d |
Values are means of five determinations ± SEM. Means with different alphabets within the column are significantly different (p < 0.05)
lvmsl = Levamisole BGCE = Bambara groundnut condiment extract mg/kg bw = milligram per kilogam body weight
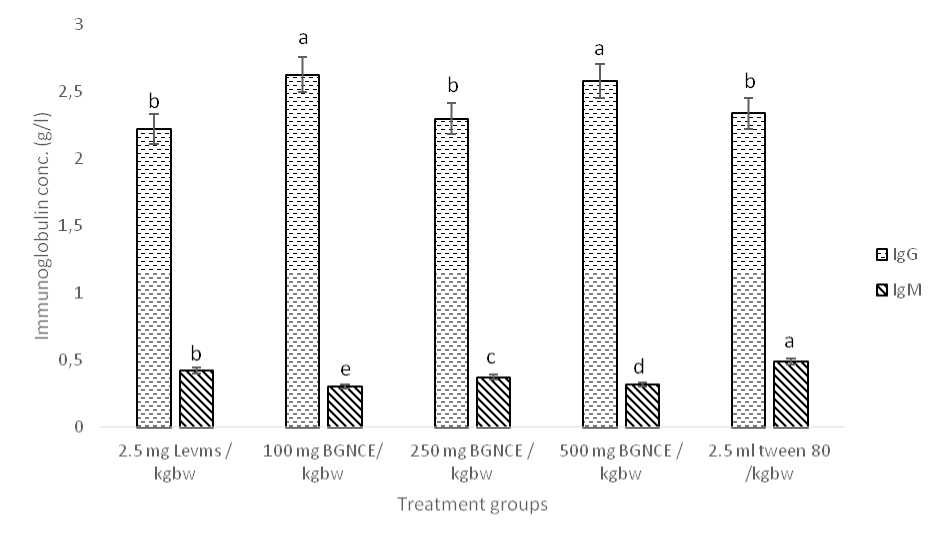
Figure 1. Effect of BGCE, levamisole and tween 80 on Plasma IgG and IgM concentrations of castor oil-induced diarrhoeal rats
Values are means of six determinations ± SEM. Bars of the same parameter with different alphabets are significantly different (p < 0.05)
Levms = Levamisole
BGCE = Bambara groundnut condiment extract
IgG = Immunoglobulin G
IgM = Immunoglobulin M
DISCUSSION
Phytochemical screening of the bambara groundnut condiment extract (BGCE) revealed that the extract is rich in phytochemicals like alkaloids, phenols, saponin and cardiac glycosides. Other researchers (Ademiluyi and Oboh, 2011; Salawu, 2016; Harris et al., 2018; Okafor et al., 2022) have reported similar results in milk of bambara groundnut, bambara groundnut flour, bambara groundnut methanol extract and bamabara groundnut aqueous extract. It is noteworthy that BGCE is very rich in alkaloids which have been reported to have antibacterial, anti-diarrhoeal and anti-malarial potentials (Damtie., 2023). Report of Yakubu et al. (2012) revealed that the presence of alkaloids, phenolics, flavonoids and saponins in plants could be linked to their antidiarrhoeal properties. The rich array of phytochemicals found in BGCE in this work corroborated earlier reports that bambara groundnut has potential to be a functional food (Salawu, 2016; Okafor et al., 2022). Functional foods have been defined as foods rich in certain bioactive components that can be used to prevent and (or) manage some chronic diseases (Irondi and Ademiluyi, 2017). The need to maintain the defence system of the body, to make it healthy, has led to the search for natural substances that has properties that can support health. For a substance to do this, such must be able to interact with the immune system, in order to regulate specific response to invading molecules or micro-organisms. Such substances are known as immunomodulators. Immunomodulators from natural sources play big roles in disease prevention and treatment (Onwuka et al., 2016). The immunomodulatory study on the BGCE revealed that BGCE has immunoboosting abilities. Bambara groundnut condiment extract (BGCE) elicited decrease in the neutrophil count and total leucocyte count (TLC) compared with the control (group that had levamisole). The differential count also showed that neutrophils were the most mobilised leucocyte granules indicating that treatment of diarrhoeal rats with BGCE improved immunity of the rats. Similar effect was reported for Hoslundia opposita leaf extract where neutrophil was also the most mobilised leucocyte (Onwuka et al., 2016). It has been observed that the first and most important step in phagocytosis is the chemotactic movement of neutrophils towards the foreign body (Rosales et al., 2016). Leucocytes are rapidly released from the bone marrow reserve into the blood during infections or inflammations (Sun et al., 2021). Ricinoleic acid, a metabolite of castor oil that was used to induce diarrhoea in this study have been implicated in inflammation of small intestine (Yakubu and Salimon, 2015). Daikwo et al. (2012) had explained that plants that have immunostimulatory properties confer their stimulatory effects on cytokines that cause inflammation and probably regulate effect on their receptors. All polymorphonuclear (PMN) leucocytes exhibit phagocytic function against pathogens, they activate T and B cells so that the offending pathogens can be recognised for destruction. Activation of T cells results in the movement of monocytes and lymphocytes into the area of inflammation (Gupta et al., 2010). This research result showed that little amount of other (PMN) leucocytes (lymphocytes, basophils, eosinophil and monocytes) were mobilised. Activation of adaptive immune system results in the generation of antibodies (immunoglobulins) that specifically target the foreign body or inducing condition (Conkrite and Strutt, 2018). Immunoglobulin M (IgM) relates to the primary response while the secondary response consists mainly of immunoglobulin G (IgG) (Panda and Ding, 2015). The concentrations of immunoglobulin observed in this work confirmed result obtained for primary and secondary titre values. The higher values of secondary antibody titre and IgG in the experimental rats were in agreement with the work of Gupta et al. (2010) and Onwuka et al. (2016). It has been documented that adaptive immune system develop gradually and they exhibit memory, therefore, a repeat exposure to the same antigene would result in improved resistance mediated by specific aspects of the adaptive immune system (O’connell and Aldhamen., 2020). This is due to the expanded clone of cells with memory of the original antigene available to proliferate into mature plasma cells (Onwuka et al., 2016).
CONCLUSION
Our work revealed that bambara groundnut condiment extract has immunostimulatory properties, obtained from the array of phytochemicals like alkaloids, phenols, saponin and cardiac glycosides in it. Authors therefore encourage the consumption of bambara groundnut condiment as a functional food, to improve the immunity status of consumers.
ETHICS / APPROVAL CONSENT
The study was approved by the Post graduate Review and Ethics committee of the College of Bio Sciences, Federal University of Agriculture, Abeokuta, Nigeria.
CONFLICTS OF INTEREST
The authors declare that they have no potential conflicts of interest
References Immunomodulatory properties of bambara groundnut condiment extract in diarrhoeal induced rats
- Abu-Ghannam N. and Gowen A. (2020) Pulse based food products. In Tiwari B. K, Gowen A. and McKenna B. (ed.). Pulse Foods: Processing, Quality and Nutraceutical Applications. 2nd edition, Academic Press, Elsevier Inc. Amsterdam. pp369-391.
- Adebo J.A., Njobeh P.B., Gbashi S., Oyedeji A.B., Ogundele O.M., Oyeyinka S.A. and Adebo O.A. (2021) Fermentation of cereals and legumes: Impact on nutritional constituents and nutrient bioavailability. Ferment. 8 (2), 63-71.
- Ademiluyi A.O. and Oboh G. (2011) Antioxidant properties of condiment produced from fermented bambara groundnut. J. Food Biochem. 35 (4), 11451160.
- Amadi B.A., Agomuo E.N. and Ihegbulem C.O. (2004) Research methods in biochemistry. Supreme publishers, Owerri, Nigeria. pp.52
- Bamishaye O.M., Adegbola J.A. and Bamishaye E.I. (2011) Bambara groundnut: an under-utilized nut in Africa. Adv. Agric. Biotechnol. 1 (1), 60-72.
- Bland J.S. (2021) Applications of Phytochemicals in immune disorders: Their roles beyond Antioxidants. Integr. Med. (Enclinitas) 20 (5), 16-21.
- Cronkite D.A. and Strutt T.M. (2018) The regulation of inflammation by innate and adaptive lymphocytes. J. Immunol. Res. 146 (7), 538-550.
- Daikwo O.A., Tande J.A., Okey S.M., Eze E.D. and Isa A.S. (2012) The effect of aqueous extract of leaf of Ficus capensis thumb on in vivo leukocyte mobilization in Wistar rats. Br. J. Pharmacol. Toxicol. 3 (3), 110-114.
- Damtie D. (2023). Review of medicinal plants traditionally used to treat diarrhea by the people in the Amhara region of Ethiopa. Evid. Based Complement. Alternat. Med. 10, 1-24.
- Ejikeme C.M., Ezeonu C.S. and Eboatu A.A. (2014) Determination of physical and phytochemical constituents of some tropical timbers indigenous to Niger Delta area of Nigeria. Eur. Sci. J. 10 (08), 247270.
- Eltayeb, A.R., Alli A.O., Abou-Arab A.A. and Abu-Salem F.F. (2011) Chemical composition and functional properties of flour and protein isolate extracted from Bambara groundnut. Afr. J. Food Sci. 5 (2), 82-90.
- Ezeonu C.S. and Ejikeme C.M. (2016) Qualitative and Quantitative determination of phytochemical contents of indigenous Nigerian soft woods. New J. Sci. 56 (01), 1327-1336.
- Farinde E.O., Fasoyiro S.B., Obatolu V.A. and Yusuf, A.A. (2007) Production of soy-iru using an alternative method of processing and fermenting container. J. Biol. Sci. 7, 61-64.
- Gabhe S.Y., Tatke P.A. and Khan T.A. (2006) Evaluation of the immuno-modulatory activity of the methanol extract of Ficus benghalensis roots in rats. Indian J. Pharmacol. 38 (4), 271-275.
- Gupta P.D. and Birdi T.J. (2017) Development of botanicals to combat antibiotic resistance. J. Ayurveda Integr. Med. 8 (4), 266-275.
- Hanson M.S., Stephenson A.H. and Bowles E.A. 2008. Phosphodiesterase 3 is present in rabbit and human erythrocytes and its inhibition potentiates iloprost induced increases in cAMP. Am. J. Physiol. Heart Circ. Physiol. 295: H786-H793.
- Harbone J.B. (1973) Phytochemical methods: A guide to modern techniques of plant analyses. Chapman and Hall, London, U.K. pp 23-29.
- Harris T., Jideani V. and Le Roes-Hill M. (2018) Flavonoids, Tannin composition of Bambara groundnut of Mpumalanga, South Africa. Heliyon, 4 (9), 833-847.
- Irondi E.A. and Ademiluyi A.O. (2017) Functional foods and management of diseases. In Oboh, G. (ed.). Unlocking the medicine in foods. Grace land Publishers. Akure, Nigeria, pp. 1-9.
- Lewis S.M. (2006). Reference ranges and normal values. In Dacie and Lewis (ed.). Practical Haematology, 10th Edition. Churchill Livingstone, Elsevier, pp.11-24.
- Nahak G. and Kanta S.R. (2018) Bio-controlling effect of leaf extract of Tagetes patula (marigold) on growth parameters and diseases of tomato. Pak. J. Biol. Sci. 20 (1), 12-19
- Nduche M.U. and Omosun G. (2016) The use of medicinal plants in the treatment of diarrhoea in Nigeria; Ethnomedical inventory in Abia State. Sch. J. Agric.Vet. Sci. 3 (3), 270-274.
- Nwadi O. M.M., Uchegbu N. and Oyeyinka S.A. (2021) Enrichment of food blends with bambara groundnut flour: Past, present and future trends. Legum. Sci. 2 (1): e25-e34
- O'connell P. and Aldhamen Y.A. (2020) Systemic innate and adaptive immune responses to SARS-CoV-2 as it relates to other coronaviruses. Hum. Vacc. Immunother. 16 (12): 2980-2991.
- Okafor J.N.C., Jideani V.A., Meyer M. and Le Roes-Hil, M. (2022) Bioactive components in bambara groundnut (Vigna Subterranea) as potential source of nutraceutical ingredients. Heliyon (8), 1-11.
- Olanipekun O.T., Akinloye O.A. and Soetan K.O. (2024) Bambara groundnut condiment extract reversed diarrhoeal condition in male wistar rats. Asian J. Res. Biochem. 14 (1), 30-39.
- Onwuka N.A., Ezike A.C., Ettebong E.O., Tologbonse A.A. and Onyeukwu N.J. (2016) Evaluation of the Immunomodulatory activity of Hoslundia opposita leaf extract. Int. J. Pharmacogn. Phytochem. Res. 8 (1), 1-7.
- Panda, S. and Ding, J.L. (2015) Natural antibodies bridge innate and adaptive immunity. J. Immun. 194, 13-20.
- Rosales C., Demaurex N., Lowell C.A. and Uribe-Querol E. (2016) Neutrophils: Their role in innate and adaptive immunity. J. Immun. Res. 146 (9), 780-782.
- Salawu S.O. (2016) Comparative study of the antioxidant activities of methanolic extract and simulated gastrointestinal enzyme digest of bambara nut. Res. Sci.1: 107-120.
- Sofowora A. (1993) Medicinal plants and Traditional medicines in Africa. Chichester John-willey and sons. New York. pp. 256-263.
- Sun H., Huo Y. and Fan Z. (2021) Editorial: Imaging and mechanism of leukocyte recruitment and function in inflammation and infections. Front. Cell dev. Biol. 9, 13-18
- Trease G.E. and Evans W.C. (1989) A textbook of Pharmacognosy, Balliere Tidall Ltd. London, U.K. pp. 53.
- Yakubu M.T., Opakunle F.K., Salimon S.S, Ajiboye T.O., Bamisaye F.A. and Quadri A.L. (2012) Antidiarrhoeal activity of aqueous extract of Ceratotheca sesamoildes in rats. Bangladesh J. Pharmacol. 7 (1), 14-20.
- Yakubu, M.T., and Salimon, S.S. 2015. Antidiarrhoeal activity of aqueous extract of Magnifera indica L. leaves. J. Ethnopharmacol. 163, 135-141.
