Impact of 3D transesophageal echocardiography assessment of mitral valve on short-term outcome of balloon mitral valvuloplasty using additional quantitative parameters

Author: Elsawah I.A., Amin A.М., Abdo A.-M.M., Taha M.O., Khalil E.A.
Journal: Cardiometry @cardiometry
Section: Original research
Article in issue: 21, 2022.
Free access
The goals of this prospective observational study were to identify quantitative morphological factors that might aid in the prediction of PBMV outcome, as well as to define the function of 3D TEE in mitral valve evaluation. Material and Methods: The trial comprised seventy individuals who had isolated severe rheumatic Mitral Stenosis (MS) who were scheduled for PBMV between October 2017 and March 2021. Trans-thoracic echocardiography (TTE) was used for pre-procedural evaluation. Posterior to Anterior Leaflet Length Ratio (P/ALLR), Commissural Area Ratio (CAR), Doming Height (DH), and Calcification Score (Ca score) were also assessed using 2D and 3D-Trans-esophageal Echocardiography (TEE). Following that, all patients were monitored for three months. Results: We have had 50(71.5%) successful procedures and 20(28.5%) unsuccessful procedures. The additional parameters showed highly significant difference between successful and un-successful groups (P-value 0.6 and >0.55 by 2-D and 3-D TEE respectively, CAR ≤ 1.28 and ≤ 1.25 by 2-D and 3-D TEE respectively, DH > 1.2 cm by 2-D TEE, and Ca Score ≤ 2. Conclusion: In our research, we discovered that these characteristics may predict the result of PBMV and contribute value to the semi-quantitative methodologies we adopted to use.
3d transesophageal echocardiography, balloon mitral valvuloplasty, additional quantitative parameters
Short address: https://sciup.org/148324183
IDR: 148324183
Text of the scientific article Impact of 3D transesophageal echocardiography assessment of mitral valve on short-term outcome of balloon mitral valvuloplasty using additional quantitative parameters
Ibrahim Ahmed Elsawah, Ali Mohamed Al Amin, Abdel-Mohsen Moustafa Abdo, Mohamed Osama Taha, Essam Ahmed Khalil. Impact of 3D transesophageal echocardiography assessment of mitral valve on short-term outcome of Balloon Mitral Valvuloplasty using additional quantitative parameters. Cardiom-etry; Issue 21; February 2022; p. 70-77; DOI: 10.18137/cardiom-etry.2022.21/7077; Available from: issues/no21-february-2022/impact-3D-transesophageal
Rheumatic heart disease (RHD) is one of the most frequent cardiac disorders in poor nations, where it is the second leading cause of morbidity and mortality after atherosclerotic vascular diseases [1]. The most frequent valve lesion encountered in chronic RHD is MS, which often presents as exertional dyspnea and symptoms of right heart failure caused by pulmonary hypertension [2]. For most people with severe MS, PBMV is regarded a better option than surgery [3]. The pre-procedural echocardiographic score, which reveals the degree of mitral valve morphologic defects, is the strongest predictor of immediate outcomes [4]. For the examination of mitral valve morphology prior to PBMV, a two-dimensional (2D) echocardiographic total scoring approach (Wilkins’ score) has been presented. Total scores for leaflet motion, leaflet thickness, valvular calcification, and subvalvular disease are used in this procedure [5]. Although this scoring approach has been frequently utilized because of its simplicity, each component grading remains semi-quantitative, sensitive to observer variability, and less accurate in identifying patients with scores in the mid-range [6]. Several criteria, such as asymmetrical commissural affection and absolute leaflet displacement in diastole, have been postulated for predicting Mitral Regurgitation (MR), although the ideal combination of characteristics predicting outcome variables has yet to be determined [7]. TEE is a highly effective diagnostic tool for assessing heart structure and function [8]. Unlike 2D TEE, which employs typical imaging planes, 3D TEE uses volume datasets to provide a more comprehensive assessment of mitral valve (MV) anatomy and morphology from numerous angles [9].
This study implies that these morphologic quantitative characteristics will be a straightforward and independent tool for predicting PBMV outcome.
Aim of the work
The goal of this study is to identify quantitative morphological parameters that may be used to predict success following PBMV, as well as to define the function of 3D TEE in mitral valve evaluation.
Material and method
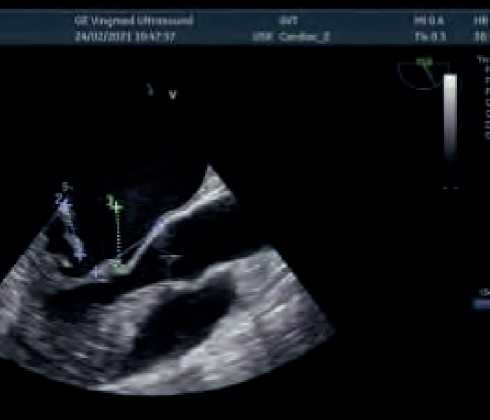
The study included seventy patients, both sexes, over the age of 18, who had isolated severe MS with a Wilkins’ score ≤ 12, as well as non-existing or mild mitral MR, and who underwent PBMV between October 2017 and March 2021. All participants in the research provided informed consent. Any patient who had a contraindication for the procedure was ruled out. Each patient had a complete medical history taken including age, gender, diabetes, hypertension, NYHA class, clinical examination, and a 12-lead resting electrocardiogram (ECG). TTE examined the traditional indices for assessing MS severity, such as mitral valve area (MVA) by planimetry, peak and mean transmitral valve pressure gradients, MR severity with vena con-tracta (MRVC), and PASP, before and after PBMV. TEE was performed before the procedure to confirm grade of MR, rule out thrombus, and examine the mitral valve using the quantitative parameters listed below; in the mid esophageal long axis view, P/ALLR and DH were assessed as indicated in (Figure 1). Then, with the image fixed at end diastole after using the X-plane and 3D zoom modes, a transverse line was drawn connecting both annular sides and crossing the commissures, another line was drawn to define the mid-point of the first line, the areas on both sides of this point were traced, and the large area was divided by the small one to get CAR (Figure 2). P/ALLR was calculated by measuring the length of the anterior and posterior leaflets in the same image. Calcification Score (0-10) was assessed using Anwar Score; 1 point for calcification in one of the middle scallops vs 2 points if it appears in one of the commissural scallops [10]. After PBMV, success was defined as successful dilatation of the MV with an area (MVA) more than 1.5 cm2, as well as no deterioration of the MR by more than one grade; MRVC ≤ 0.4cm. For three months, all patients were monitored for the necessity for MVR, re-do, NYHA, rhythm, and death.
Statistical Analysis
Data were gathered, edited, coded, and put into the IBM SPSS version 23 Statistical Package for Social Science. When the data was determined to be non-parametric, the quantitative data was presented as mean, standard deviations, and ranges rather than mean, standard deviations, and ranges. Qualitative factors were also given numerically and as percentages. The following p-values were judged significant: P-value more than 0.05 indicates non-significant (NS), P-val-ue less than 0.05 indicates significant (S), and P-value less than 0.01 indicates highly significant (HS) (HS).
Results
According to the results of PBMV, patients were classified based on procedure success and the two el-
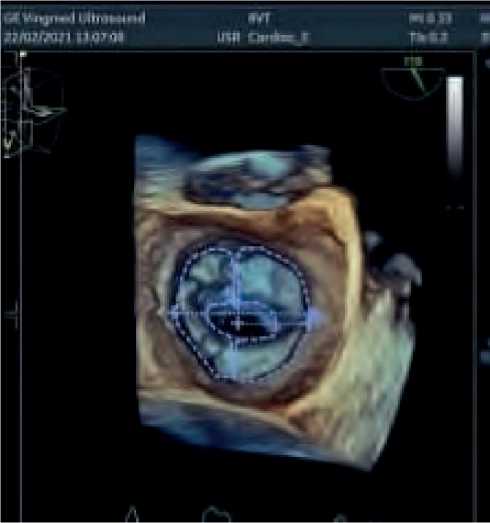
Figure 2: Measurement of CAR with 3-D TEE ements of procedure results separately; degree of dilatation and progression of MR.
The study included 70 patients; 57 (81.4%) were female and 13 (18.6%) were male. The mean age was 34.69 ± 8.65 years. There was only 9 (12.9%) diabetic patients and 10 (14.3%) were hypertensive. Regarding rhythm; 19 (27.1%) patients were AF (Table 1).
We have had 50(71.5%) successful procedures and 20(28.5%) unsuccessful procedures; 10 patients purely non-dilated, 9 patients were dilated but had worsening of MR and 1 patient was non-dilated and had worsening of MR (Table 2).
Only ECG rhythm had the significant difference between the two groups; 9 (45%) of unsuccessful patients had atrial fibrillation (AF) and 40 (80%) of successful patients were sinus (P-value 0.034). (Table 3)
Table 4 reveals that the mean value of Wilkin’s score showed a highly significant difference (P-values 0.001). The mean values of left atrial diameter (LAD) and peak pressure gradient demonstrated a significant difference between the two groups (P-values 0.027 and 0.045 respectively). However, there was no significant difference in MVA, mean pressure gradient, PASP, or MRVC. When the two components of success were evaluated independently, we discovered that baseline MVA differed significantly between the dilated and non-dilated groups (P-value 0.014), while it showed non-significant difference when compared with mitral regurgitation results (P-value 0.821).
Table 3
Comparison of clinical data to procedure success
The mean value of P/A LLR, CAR, and DH showed highly significant difference between successful and unsuccessful groups (P-value 0.000) (Table 5).
Table 1
Descriptive statistics of demographic data
|
No. = 70 |
||
|
Age |
Mean ± SD |
34.69 ± 8.65 |
|
Range |
18 – 58 |
|
|
Sex |
Female |
57 (81.4%) |
|
Male |
13 (18.6%) |
|
|
DM |
No |
61 (87.1%) |
|
Yes |
9 (12.9%) |
|
|
HTN |
No |
60 (85.7%) |
|
Yes |
10 (14.3%) |
|
|
ECG rhythm |
A |
19 (27.1%) |
|
S |
51 (72.9%) |
|
Table 2
Descriptive analysis of procedure success
|
Procedure Success |
|||
|
Un Successful |
Successful |
||
|
No. = 20 |
No. = 50 |
||
|
Dilatation |
No |
11 (55.0%) |
0 (0.0%) |
|
Yes |
9 (45.0%) |
50 (100.0%) |
|
|
Mitral regurgitation |
No |
10 (50.0%) |
50 (100.0%) |
|
Yes |
10 (50.0%) |
0 (0.0%) |
|
|
Basic data |
Success |
Test value |
P-value |
Sig. |
||
|
Un Successful |
Successful |
|||||
|
No. = 20 |
No. = 50 |
|||||
|
Age |
Mean ± SD |
36.25 ± 5.88 |
34.06 ± 9.52 |
0.956• |
0.342 |
NS |
|
Range |
26 – 47 |
18 – 58 |
||||
|
Sex |
Female |
17 (85.0%) |
40 (80.0%) |
0.236* |
0.627 |
NS |
|
Male |
3 (15.0%) |
10 (20.0%) |
||||
|
DM |
No |
18 (90.0%) |
43 (86.0%) |
0.204* |
0.652 |
NS |
|
Yes |
2 (10.0%) |
7 (14.0%) |
||||
|
HTN |
No |
17 (85.0%) |
43 (86.0%) |
0.012* |
0.914 |
NS |
|
Yes |
3 (15.0%) |
7 (14.0%) |
||||
|
ECG rhythm |
A |
9 (45.0%) |
10 (20.0%) |
4.515* |
0.034 |
S |
|
S |
11 (55.0%) |
40 (80.0%) |
||||
|
C/O NYHA |
NYHA I |
1 (5.0%) |
0 (0.0%) |
2.819* |
0.244 |
NS |
|
NYHA II |
7 (35.0%) |
22 (44.0%) |
||||
|
NYHA III |
12 (60.0%) |
28 (56.0%) |
||||
*:Chi-square test; •: Independent t-test
72 | Cardiometry | Issue 21. February 2022
Table 4
Comparison between pre- interventional TTE data according to procedure success.
|
TTE |
Success |
Test value |
P-value |
Sig. |
||
|
Un Successful |
Successful |
|||||
|
No. = 20 |
No. = 50 |
|||||
|
Wilkins score |
Mean ± SD |
8.80 ± 0.77 |
7.90 ± 1.04 |
3.515• |
0.001 |
HS |
|
Range |
8 – 10 |
6 – 10 |
||||
|
LAD (cm) |
Mean ± SD |
5.04 ± 0.24 |
4.82 ± 0.39 |
2.268• |
0.027 |
S |
|
Range |
4.6 – 5.6 |
4.2 – 6.5 |
||||
|
MVA (cm2) |
Mean ± SD |
0.96 ± 0.14 |
1.02 ± 0.15 |
-1.612• |
0.112 |
NS |
|
Range |
0.7 – 1.2 |
0.6 – 1.3 |
||||
|
P gr (mmHg) |
Mean ± SD |
27.15 ± 5.12 |
24.88 ± 3.79 |
2.039• |
0.045 |
S |
|
Range |
19 – 42 |
18 – 38 |
||||
|
M gr (mmHg) |
Mean ± SD |
15.00 ± 2.45 |
14.60 ± 2.57 |
0.596• |
0.553 |
NS |
|
Range |
11 – 23 |
11 – 23 |
||||
|
PASP (mmHg) |
Mean ± SD |
58.35 ± 17.30 |
58.66 ± 14.90 |
-0.075• |
0.940 |
NS |
|
Range |
35 – 90 |
35 – 106 |
||||
|
MR vc (cm) |
Median (IQR) |
0.1 (0.05 - 0.2) |
0.1 (0 - 0.2) |
-0.648‡ |
0.517 |
NS |
|
Range |
0 – 0.2 |
0 – 0.2 |
||||
•: Independent t-test; ‡: Mann Whitney test
Table 5
Comparison between pre- interventional 2D-TEE data according to procedure success.
|
2-D TEE |
Success |
Test value• |
P-value |
Sig. |
||
|
Un- Successful |
Successful |
|||||
|
No. = 20 |
No. = 50 |
|||||
|
P/A LLR |
Mean ± SD |
0.51 ± 0.05 |
0.66 ± 0.08 |
-7.552 |
0.000 |
HS |
|
Range |
0.4 – 0.6 |
0.47 – 0.8 |
||||
|
CAR |
Mean ± SD |
1.33 ± 0.05 |
1.15 ± 0.10 |
7.366 |
0.000 |
HS |
|
Range |
1.21 – 1.4 |
1.01 – 1.43 |
||||
|
DH (cm) |
Mean ± SD |
1.11 ± 0.07 |
1.31 ± 0.16 |
-5.324 |
0.000 |
HS |
|
Range |
1 – 1.21 |
1.12 – 2.2 |
||||
•: Independent t-test
As regard 3-D TEE measurements, the mean value of P/A LLR, CAR, and the median for Ca Score showed highly significant difference between successful and unsuccessful groups (P-value 0.000) (Table 6).
There were no deaths reported. Symptoms follow-up demonstrated better NYHA class in successful versus un-successful patients with highly significant difference (P-value 0.000). Regarding re-intervention, no patient (0%) in the successful group requires it, but 12 patients (60%) in the failed group require MV Replacement (MVR) with a highly significant difference (P-value 0.000), and 2 patients (10%) require re-do PBMV with a significant difference (P-value 0.023)
(Table 7). The analysis of MVR patients revealed that three were solely non-dilated, one was non-dilated with MR, and eight had MR.
The cut-off points of 2-D TEE parameters that predict success were P/A LLR > 0.6 with 74.0% sensitivity and 100.0% specificity. CAR ≤ 1.28 with 90.0% sensitivity and 85.0% specificity. DH > 1.2 cm with 84.0% sensitivity and 95.0% specificity (Figure 3), and that for 3-D TEE parameters were P/A LLR > 0.55 with 84.0% sensitivity and 90.0% specificity. CAR ≤ 1.25 with 80.0% sensitivity and 95.0% specificity. Ca Score ≤ 2 with sensitivity 80.0% and specificity 75.0% (Figure 4).
Table 6
Comparison between pre- interventional 3D-TEE data according to procedure success.
|
3-D TEE |
Success |
Test value |
P-value |
Sig. |
||
|
Un Successful |
Successful |
|||||
|
No. = 20 |
No. = 50 |
|||||
|
P/A LLR |
Mean ± SD |
0.52 ± 0.05 |
0.66 ± 0.09 |
-6.614• |
0.000 |
HS |
|
Range |
0.45 – 0.7 |
0.49 – 0.9 |
||||
|
CAR |
Mean ± SD |
1.33 ± 0.05 |
1.15 ± 0.10 |
7.152• |
0.000 |
HS |
|
Range |
1.2 – 1.43 |
1 – 1.35 |
||||
|
Ca score |
Median (IQR) |
4.5 (2.5 - 5.5) |
1 (1 - 2) |
-4.779‡ |
0.000 |
HS |
|
Range |
0 – 7 |
0 – 4 |
||||
•: Independent t-test; ‡: Mann Whitney test
Table 7
Comparison of three months follow-up data according to procedure success.
|
Procedure Success |
Test value* |
P-value |
Sig. |
|||||
|
Un Successful |
Successful |
|||||||
|
No. |
% |
No. |
% |
|||||
|
NYHA |
NYHA I |
3 |
15.0% |
44 |
88.0% |
42.875 |
0.000 |
HS |
|
NYHA II |
5 |
25.0% |
6 |
12.0% |
||||
|
NYHA III |
6 |
30.0% |
0 |
0.0% |
||||
|
NYHA IV |
6 |
30.0% |
0 |
0.0% |
||||
|
Rhythm |
A |
9 |
45.0% |
10 |
20.0% |
4.515 |
0.034 |
S |
|
S |
11 |
55.0% |
40 |
80.0% |
||||
|
Need MVR |
No |
8 |
40.0% |
50 |
100.0% |
36.207 |
0.000 |
HS |
|
Yes |
12 |
60.0% |
0 |
0.0% |
||||
|
Need Redo |
No |
18 |
90.0% |
50 |
100.0% |
5.147 |
0.023 |
S |
|
Yes |
2 |
10.0% |
0 |
0.0% |
||||
|
Death |
No |
20 |
100.0% |
50 |
100.0% |
NA |
NA |
NA |
|
Yes |
0 |
0.0% |
0 |
0.0% |
||||
Chi-square test
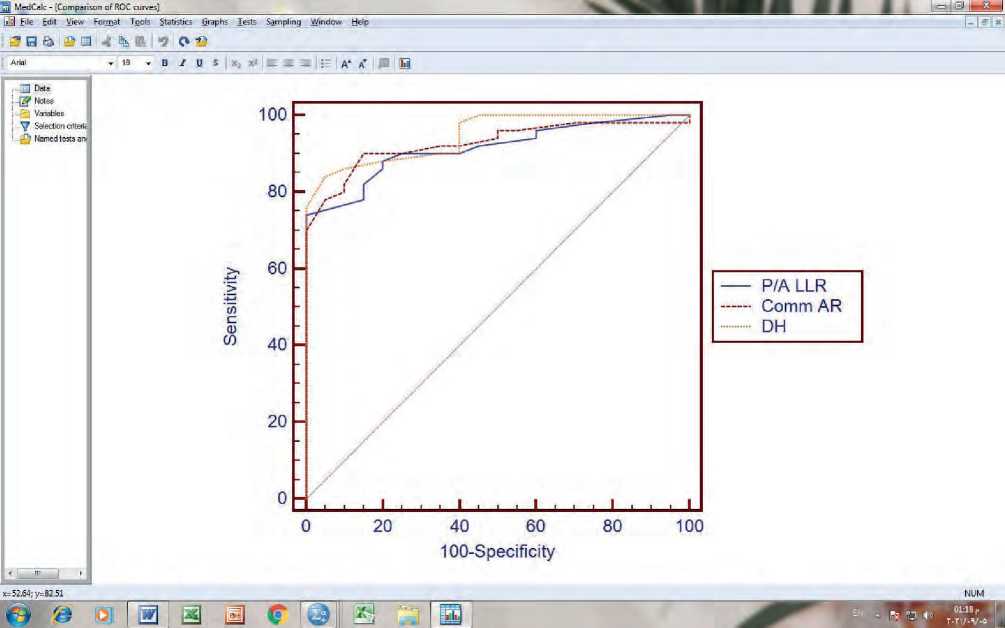
Figure 3: The Receiver-Operating Characteristic (ROC) curve of 2-D TEE measurements
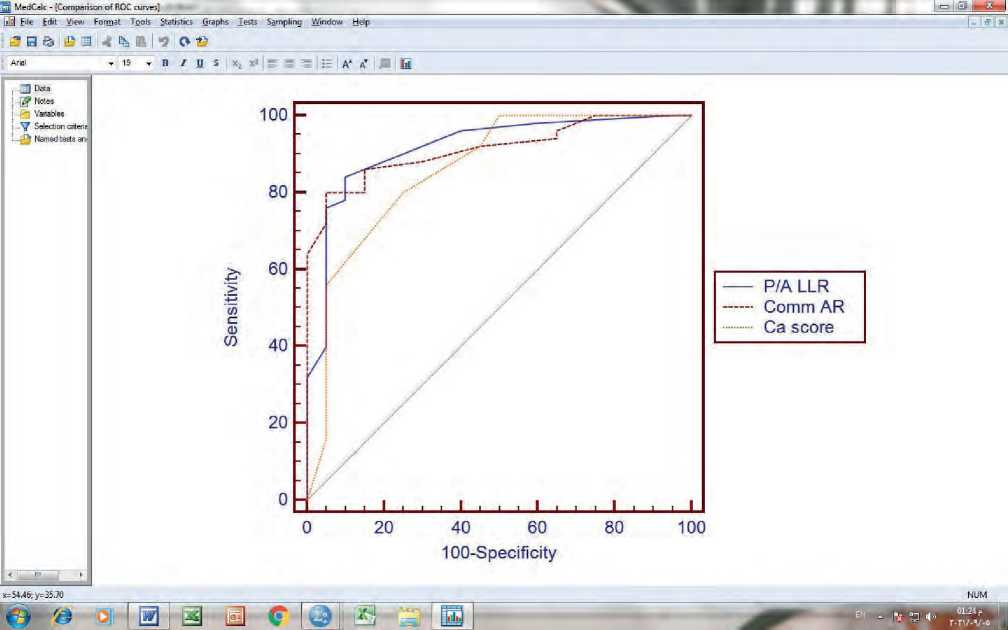
Figure 4: The Receiver-Operating Characteristic (ROC) curve of 3-D TEE measurements
Discussion
According to the procedure success definition, MVA was measured by planimetry to be greater than 1.5 cm2 with no more than a one-grade rise in MR. Our study found that 20 procedures (28.5 percent) were unsuccessful, which is quite similar to Rifaie et al., study, which found that 30 percent of patients were unsuccessful [11]. In addition, Nunes et al., discovered (35 percent) of patients with sub-optimal outcomes [12]. Individuals with AF had a considerably poorer result than patients with sinus rhythm, according to Fatkin et al., (P-value 0.002) [13]. While Nunes et al., found no significant difference in rhythm (P-value 0.424), they did find a highly significant difference in age; the suboptimal group was elder (P-value 0.001) [12]. This might be explained by the fact that the mean age in our study was 34.69±8.65 years, whereas in Nunes et al., study it was 57±16 years [12]. Shaw et al., reported that PBMV produces good results in individuals under the age of 55, but the improvement is less maintained in the elderly [14]. Mailer et al., found that lower baseline MVA, larger trans-mitral gradient, and LAD were predictors of unsatisfactory results and the development of MR following PBMV [15], which was consistent with our findings. Nunes et al., found a highly significant difference in Wilkins score, baseline MVA, CAR, and DH between the two groups (P-value 0.001) [12]. Reifart et al., dilated in vitro 15 excised MV from MS patients who received MVR and discovered a 20% rate of leaflet rupture. They proposed that MR following PBMV is determined by the symmetry of morphologic alterations rather than their severity [16]. According to Rifaie et al., calcification and sub-valvular illness are the only independent predictors of immediate post-procedural prognosis [11]. Anwar et al., discovered that leaflet mobility and sub-valvular thickness as 3-D score components were independent indicators of procedural success (P-value 0.004 and 0.04 respectively) [10]. All of the previous investigations agreed with our findings when the quantitative evaluation of leaflet mobility was stated as maximal leaflet displacement; DH, and when valve thickness and fibrosis was expressed as P/A LLR and CAR. According to Mahfouz, P/A LLR is significantly correlated with PBMV outcome, with greater ratios producing much better results [17]. In terms of calcification, we assessed it using 3-D TEE and assigned a score in the same manner as Anwar et al., who proposed a new score for assessing MV, reported that 3DE could predict the extent and distribution of calcification in each scallop from a single short axis cut plain, and discovered that calcification was the only independent predictor of the development of significant MR [10]. Shakil et al., found a significant difference in calcium detection and evaluation between 2-D and 3-D echocardiography; 2DE detected calcification in 26 (52 percent) of cases versus 35 (70 percent) of cases with 3-DE (P-value 0.002) [18]. According to Sutaria et al., and Messika-Zeitoun et al., calcification of commissures is a powerful predictor of outcome following PBMV because it influences the degree of commissural splitting [19,20]. Our findings reveal that 90 percent of patients with deteriorating MR require MVR, but only 13.6 percent of non-dilated individuals require MVR, indicating that severe MR is a better predictor of patients’ symptoms and need for MVR than poor MVA. Nunes et al., discovered that the event-free survival rate at 2 years was only 13% in patients with moderate MR against 62 percent in those with mild MR (P0.001), and the rate of MVR was significantly greater in individuals with moderate MR (46 percent versus 9 percent, P0.001) [12]. In our investigation, the cut-off values for quantitative parameters that indicate success were as follows: P/A LLR >0.6 and >0.55 by 2-D and 3-D TEE, CAR ≤1.28 and ≤1.25 by 2-D and 3-D TEE, and DH > 1.2 cm by 2-D TEE. It was virtually identical to Nunes et al., who concluded that DH > 12mm and CAR ≤ 1.25 were considered as cut-off points between successful and subpar groups [12]. In addition, Mahfouz defined P/A LLR > 0.5 as a cut-off between the successful and unsuccessful groups [17]. In our study, the cut-off point for calcification that predicted procedure success was Ca score ≤ 2, which means a calcium score less than moderate, as demonstrated by Soliman et al., who graded leaflet calcification to four grades modified from Anwar et al.,[10] with permission as follows: normal=0, mild=1–2, moderate=3–5, and severe ≥6 [21].
Finally, we discovered that these quantitative characteristics might predict PBMV outcomes and added value to the semi-quantitative traditional approaches we used.
Conclusion
Our study revealed that P/A LLR > 0.55, CAR ≤ 1.25, DH > 1.2 cm, and Ca Score ≤ 2 determined by 2-D and 3-D TEE are specific and sensitive predictors of PBMV success in a quantitative way, aiding the traditional scoring methods in selecting the appropriate patients for the procedure.
76 | Cardiometry | Issue 21. February 2022
The study’s weaknesses were a limited sample size, the lack of multicenter participation, and a short follow-up time.
Statement on ethical issues
Research involving people and/or animals is in full compliance with current national and international ethical standards.
Conflict of interest
None declared.
Author contributions
The authors read the ICMJE criteria for authorship and approved the final manuscript
References Impact of 3D transesophageal echocardiography assessment of mitral valve on short-term outcome of balloon mitral valvuloplasty using additional quantitative parameters
- Pastore S, De Cunto A, Benettoni A, et al. The resurgence of rheumatic fever in a developed country area: the role of echocardiography. Rheumatology (Oxf) 2011; 50:396-400.
- Inoue K, Owaki T, Nakamura T, et al., Clinical application of transvenous mitral commissurotomy by a new balloon catheter. J Thorac Cardiovasc Surg 1984; 87(3): 394–402.
- Hernandez R, Banuelos C, Alfonso F, et al. Longterm clinical and echocardiographic follow-up after percutaneous mitral valvuloplasty with the Inoue balloon. Circulation 1999;99:1580–1586.
- Reid CL, Chandraratna PA, Kawanishi DT, et al. Influence of mitral valve morphology on doubleballoon catheter balloon valvuloplasty in patients with mitral stenosis. Analysis of factors predicting immediate and 3-month results. Circulation. 1989; 80: 515–24.
- Padial LR, Freitas N, Sagie A, et al. Echocardiography can predict which patients will develop severe mitral regurgitation after percutaneous mitral valvulotomy. J Am Coll Cardiol. 1996;27:1225–1231.
- Krishnamoorthy K, Radhakrishnan S, Shrivastava S, et al. Natural history and predictors of moderate mitral regurgitation following balloon mitral valvuloplasty using Inoue balloon. International Journal of Cardiology, 2003; 87(1): 31-36.
- Abascal VM, Wilkins GT, Choong CY, et al. Echocardiographic evaluation of mitral valve structure and function in patients followed for at least 6 months after percutaneous balloon mitral valvuloplasty. J Am Coll Cardiol. 1988; 12:606–615.
- Cheitlin MD, Armstrong WF, Aurigemma GP et al. American College of Cardiology; American Heart Association; American Society of Echocardiography. ACC/AHA/ASE 2003 guideline update for the clinical application of echocardiography: summary article: a report of the American College of Cardiology/American Heart Association Task Force on Practice Guidelines (ACC/AHA/ASE Committee to Update the 1997 Guidelines for the Clinical Application of Echocardiography). Circulation 2003;108:1146 – 62.
- Gill EA and Klas B. Three-dimensional echocardiography: a historical perspective. Cardiol Clin 2007; 25:221–9.
- Anwar AM, Attia WM, Nosir YF, et al. Validation of a new score for the assessment of mitral stenosis using real-time three-dimensional echocardiography. J Am Soc Echocardiogr. 2010;23:13–22.
- Rifaie O, Smat I, Abdel-Rahman M, et al. Can a novel echocardiographic score better predict outcome after percutaneous balloon mitral valvuloplasty? Echocardiography. 2009; 26:119–127.
- Nunes MC, Tan TC, Elmariah S, et al. The echo score revisited: impact of incorporating commissural morphology and leaflet displacement to the prediction of outcome for patients undergoing percutaneous mitral valvuloplasty. Circulation. 2014;129:886–95.
- Fatkin D, Roy P, Morgan JJ, et al., Percutaneous balloon mitral valvotomy with the Inoue single-balloon catheter: commissural morphology as a determinant of outcome. J Am Coll Cardiol. 1993; 21:390–397.
- Shaw TRD, Sutaria N, Prendergast B, et al. Clinical and haemodynamic profiles of young, middle aged, and elderly patients with mitral stenosis undergoing mitral balloon valvotomy. Heart 2003; 89:1430–1436.
- Mailer R, Petitclerc L, Lesperance J, et al. “Mitral regurgitation assessed by echo-Doppler after percutaneous mitral valvuloplasty,” Circulation, 1989; 80(2): 16.
- Reifart N, Nowak B, Baykut D, et al., Kaltenbach M. Experimental balloon valvuloplasty of fibrotic and calcific mitral valves. Circulation 1990; 81:1005-ll.
- Mahfouz RA. Utility of the Posterior to Anterior Mitral Valve Leaflets Length Ratio in Prediction of Outcome of Percutaneous Balloon Mitral Valvuloplasty Echocardiography 2011; 28:1068-1073.
- Shakil SS, Nahar S, Osmany DF, et al. Comparison between 2D and 3D Echocardiography in Efficient Detection of Commissural Calcification in Rheumatic Mitral Stenosis” Mymensingh Med J 2021; 30 (1).
- Sutaria N, Northridge DB, Shaw TR. Significance of commissural calcification on outcome of mitral balloon valvotomy. Heart. 2000; 84:398–402.
- Messika-Zeitoun D, Blanc J, Iung B, et al. Impact of degree of commissural opening after percutaneous mitral commissurotomy on long-term outcome. JACC Cardiovasc Imaging. 2009; 2(1):1–7.
- Soliman OI, Anwar AM, Metawei AK, et al. New scores for the assessment of mitral stenosis using real-time three-dimensional echocardiography. Current cardiovascular imaging reports. 2011; 4(5):370.
