Impact of Digital Transformation on Organizational Performance: A Regional Analysis of China’s Industrial Development

Author: Yan Zh.
Journal: Региональная экономика. Юг России @re-volsu
Section: Фундаментальные исследования пространственной экономики
Article in issue: 3 т.13, 2025.
Free access
In the era of the digital economy, the digitalization and informatization process of Chinese industrial enterprises is steadily pushing forward, and there is also great expectation for improving enterprise performance through digital transformation. However, due to the influence of the COVID-19 epidemic and geopolitical conflicts, the digital transformation of most industrial enterprises is not smooth. The intricate relationship between digital transformation and enterprise performance has also left many companies confused about whether to undergo digital transformation. Therefore, timely grasping digital opportunities and accurately implementing digital strategies are of great importance for industrial enterprises to enhance their performance as well as achieve high-quality development. However, there is currently no unified consensus in academia regarding the relationship between digital transformation and enterprise performance. One side believes that digital transformation can bring positive effects, while the other side proposes that digital transformation will exacerbate the digital divide and suppress corporate performance. The relationship between digital transformation and enterprise performance requires more research. According to existing literature reviews and the current development status of the industrial economy, this article constructs two quantitative evaluation systems for digitalization level and enterprise performance, respectively. On this basis, after collecting panel data from 31 provinces in China from 2014 to 2023, this article uses the entropy weight method to calculate the comprehensive score of these two variables, and an empirical test was conducted to clarify the impact of digitalization level on enterprise performance through benchmark regression, endogeneity test, robustness test, and heterogeneity test. The results indicate that digital transformation can significantly improve the performance of industrial enterprises, and the higher the degree of digitalization, the more significant this positive effect will be.
Digital economy, industrial development, digital transformation, digitalization level, enterprise performance, impact mechanism, entropy method, panel data, empirical test
Short address: https://sciup.org/149149363
IDR: 149149363 | UDC: 338 | DOI: 10.15688/re.volsu.2025.3.10
Влияние цифровой трансформации на эффективность организаций: региональный анализ промышленного развития Китая
В эпоху цифровой экономики процесс цифровизации и информатизации китайских промышленных предприятий неуклонно продвигается вперед и есть большие надежды на повышение эффективности деятельности предприятий за счет цифровой трансформации. Однако из-за эпидемии COVID-19 и геополитических конфликтов цифровая трансформация большинства промышленных предприятий протекает непросто. Сложная взаимосвязь между цифровой трансформацией и эффективностью деятельности предприятий также привела к тому, что многие предприятия не знают, стоит ли проводить цифровую трансформацию. Таким образом, своевременное использование цифровых возможностей и точная реализация цифровых стратегий имеют огромное значение для повышения эффективности работы промышленных предприятий, а также для достижения качественного развития. Однако в настоящее время в научных кругах нет единого мнения относительно взаимосвязи между цифровой трансформацией и эффективностью деятельности предприятий. Одни считают, что цифровая трансформация может принести положительный эффект, в то время как другие придерживаются мнения, что это усугубит цифровой разрыв и снизит эффективность деятельности корпораций. Взаимосвязь между цифровыми преобразованиями и эффективностью деятельности предприятия требует дополнительных исследований. В соответствии с обзором существующей литературы и текущим состоянием развития промышленной экономики в данной статье рассматриваются две системы количественной оценки уровня цифровизации и эффективности деятельности предприятия. На этой основе после сбора панельных данных по 3-й провинции Китая за период с 2014 по 2023 г. в исследовании используется метод энтропийного взвешивания для расчета общей оценки этих двух переменных, а эмпирический тест проводится для выяснения влияния уровня цифровизации на эффективность предприятия с помощью контрольной регрессии, теста на эндогенность, теста на надежность и теста на гетерогенность. Полученные результаты свидетельствуют о том, что цифровая трансформация может значительно повысить эффективность работы промышленных предприятий, и чем выше степень цифровизации, тем более значительным будет этот положительный эффект.
Text of the scientific article Impact of Digital Transformation on Organizational Performance: A Regional Analysis of China’s Industrial Development
DOI:
Цитирование. Янь Ч., 2025. Влияние цифровой трансформации на эффективность организаций: региональный анализ промышленного развития Китая // Региональная экономика. Юг России. Т. 13, № 3. С. 116–128. (На англ. яз.). DOI:
Research background and literature review
Over the past forty years of reform and opening up, the Chinese economy has achieved significant development. The scale and performance of Chinese enterprises are growing rapidly. As the population ages and resource problems gain prominence, the economy is under much more downward pressure [Niu, Zheng, 2025]. There is an urgent need to optimize the economic structure, transform growth momentum, and promote the transformation of the economy from high-speed development to high-quality development [Liao, 2022]. The industrial sector, as an important pillar of the national economy, is an important force in promoting high-quality growth of the Chinese economy. In the wave of global technological revolution and industrial transformation, the development and deep application of digital technology have become important driving factors for economic growth. Industrial enterprises must seize the new opportunities to improve their operation performance, innovate business models, and keep up with the pace of the times [Chen et al., 2019]. However, influenced by the COVID-19 epidemic and geopolitical conflicts in recent years, domestic industrial enterprises, especially small and mediumsized enterprises, have seen a sharp decline in performance and are even on the brink of bankruptcy. Whether industrial enterprises can seek new development power or opportunity is a key initiative to maintain core competitiveness and long-term survival [Li, 2020].
In this context, the 14th Five-Year Plan for National Economic and Social Development of the People’s Republic of China and the 2035 Long-Range Objectives Outline propose to create new advantages in the digital economy, promote the deep integration of digital technology and the real economy, and empower traditional industries to transform and upgrade. This national strategy provides a new direction for the future development of industrial enterprises – digital transformation [Wang, Hou, 2025].
Patel and McCarthy were among the first to mention the concept of digital transformation, but they did not conceptualize the term [Patel, McCarthy, 2000]. Scholars have two focuses on the definition of digital transformation. One viewpoint emphasizes the supportive role of digital technology, believing that digital transformation is an upgraded transformation after the information technology revolution. It embeds digital technology into the internal business model of an enterprise and collects market information through digital technology, thereby providing decision support for stakeholders and ultimately affecting enterprise performance [Valdez-de-Leon, 2016; Gray, Rumpe, 2017; Andriole, 2017; Li, Su, Zhang, 2018]. Another perspective proposes that the organizational structure changes brought about by digital transformation. After introducing digital technology, enterprises can fundamentally reshape their business models, organizational structures, and management methods, thereby constructing new business models to improve production mode and efficiency [Singh, Hess, 2020; Li, Yin, 2020].
The digital transformation is a systematic and complex process. Coupled with the lack of relevant statistical data and technical challenges, this complexity makes it difficult to develop a comprehensive, scientific, and universally applicable digital transformation indicator system [Zhao, Zhang, Liang, 2020]. Previous studies have proposed various evaluation methods and criteria from different dimensions and perspectives, which can be categorized into three main groups. The first category focuses on constructing a quantitative evaluation system. Chanias and Hess analyzed 20 relevant models and introduced the concept of “digital maturity” to characterize the process of enterprise digital transformation [Chanias, Hess, 2016].
The second category involves measuring the extent of digital application through questionnaire surveys and relevant indicators. Liu Shuchun identified the volume of investments in ERP, MES/ DCS, and PLM as quantitative indicators for digital transformation [Liu et al., 2021]. The third category focuses on constructing a digital transformation index using text analysis and expert scoring methods. Zhao Chenyu et al. converted the annual reports of publicly listed manufacturing companies into text format, employed Python for keyword frequency analysis, and derived the digital index using the entropy weighting method. Subsequently, the expert scoring method was utilized to evaluate the level of digital transformation for each enterprise [Zhao, Wang, Li, 2021].
Performance is a governance concept that includes both achievements and benefits. It refers to the work behavior, methods, results, and objective impacts generated during a certain period of time. Li Honglang believes that enterprise performance is a comprehensive evaluation of a company’s operating conditions and a comprehensive reflection of its economic value and sustainable development capabilities [Li, 2005].
There are two main methods for measuring corporate performance in academia. One is to obtain cognitive performance through self-assessment, and the other is to use financial indicators. The commonly used tool for cognitive performance is a scale, which can usually be measured by whether the enterprises’ sales revenue, return on investment, and profit margin have significantly improved in the past years [Delaney, Huselid, 1996]. The use of financial indicators to evaluate performance is more universal. However, most existing literature prefers to use a combination of single or multiple financial indicators to measure corporate performance. Ruekert et al. measured corporate performance from aspects such as efficiency, effectiveness, and adaptability [Ruekert, Walker, Roering, 1985]. Zhu Yan et al. used ROA as a short-term performance evaluation indicator and Tobin’s Q value as a long-term performance evaluation indicator [Zhu, Zhang, 2013]. Wang Xuekai et al. introduced the return on investment capital, return on human capital, return on net assets, and return on total assets to reflect corporate performance [Wang, Jiang, Xie, 2021].
At present, there is currently no unified consensus in academia regarding the relationship between digital transformation and corporate performance. One side believes that digital transformation can bring digital dividends and improve organizational performance [Lin, Lv, 2019; Wang, Wu, Zhang, 2020; Xiao et al., 2021], while the other side supports that digital transformation will exacerbate the digital divide and suppress organizational performance [Xie et al., 2016; Zhou et al., 2018; Qi, Cai, 2020].
This research supports the positive effects viewpoint, mainly for the following reasons. Firstly, with the gradual deepening of digital transformation, data has become a more important factor of production and breaks the “data island,” enabling cross-border dialogue between data and data as well as data and humans. The various production processes within the enterprise can share dynamic information in real time, and industrial chains can also be shared and interconnected, which greatly reduces the transaction and search costs of the enterprise [Hu, Li, Zheng, 2022]. Secondly, digital transformation will promote the transformation of the production model towards intelligence and digitization. The use of intelligent machines can avoid human errors, reduce the probability of mistakes, and enable longterm and high-intensity precision production work as well, which can significantly improve organizational efficiency [Zeng, 2024]. Thirdly, digital transformation means integrating digital technology and core business, restructuring all aspects of the enterprise with Internet thinking mode and digital technology, thereby forming an information service architecture of “cloud+network+end” and improving enterprise performance [Yang, Qian, 2022].
Based on the above literature analysis, this research proposes the following hypothesis: digital transformation can significantly improve the performance of industrial enterprises, and the higher the degree of digitalization level is, the more significant this positive effect will be.
The current status of industrial economy development in China
China is currently the second largest industrial country with the most complete modern industrial system in the world. According to the China Statistical Yearbook 2024, China’s GDP in 2023 is 126.05 trillion yuan, of which nearly 40 trillion yuan will come from industry, accounting for nearly one-third [China Statistical Yearbook, 2024]. However, due to the overall pattern of China’s economy being strong in the east and weak in the west, and rising in the south and falling in the north, the industrial development between various provinces and regions has also demonstrated different characteristics.
The industrial sector still plays a pivotal role in economic growth. Excluding price factors, in recent years, although the nominal GDP of industry has declined, the driving rate of real GDP growth has been increasing. According to the 2023 China Regional Economic Report released by China Yuekai
Securities Co., Ltd., the industry sector drives a real GDP growth of 1.7 percentage points in 2023, with an increase of 0.5 percentage points from 2022. The eastern region holds up half of China’s industrial economy development. The industrial scale in the western region continues to increase, while the industrial status of the central and northeastern regions has declined to some extent (Figure 1) [China Regional Economic Report, 2023].
Besides, more than 150 large-scale industrial Internet platforms have been cultivated. The integrated application of the industrial Internet has expanded to 45 major categories of the national economy, and the number of industrial APPs has exceeded 280,000. The distribution of industrial internet platforms applied by industrial enterprises above a designated size in China is shown in Figure 2.
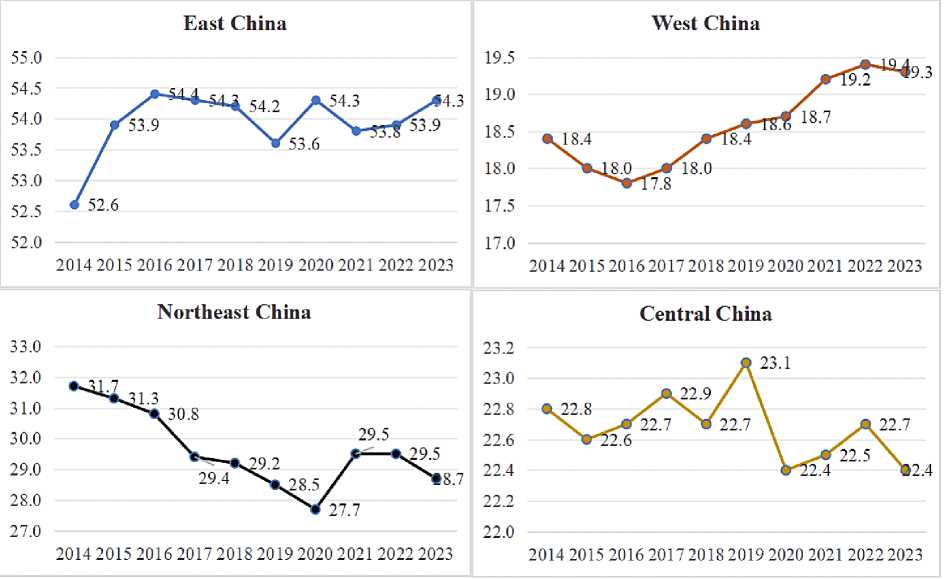
Fig. 1. The proportion of industrial added value in the four major regions to the national total Note. Source: [China Regional Economic Report, 2023].
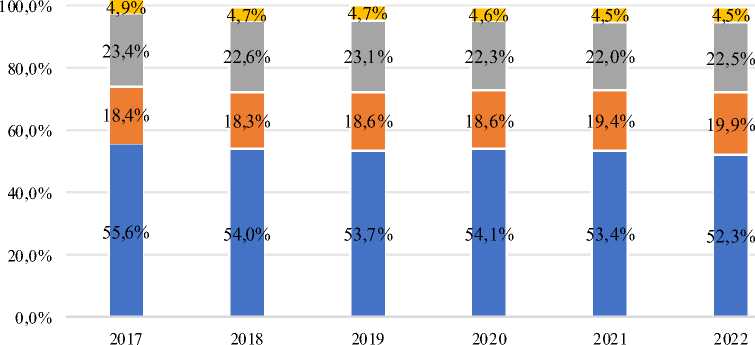
Industrial economies in the four major regions of China have achieved synergetic development, as shown in Figure 3.
The eastern region has strong resilience and force for industrial sector development due to the numerous coastal ports, high participation in the global industrial chain, and significant policy and resource advantages. Since 2017, the proportion of total industrial added value to GDP in the eastern region has consistently remained above 50%. The eastern region is a highland for the development of intelligent manufacturing in China, with 53% of the country’s digital workshops or smart factories. The central region has a strong manufacturing foundation and abundant human resources. Its core city has become the main force carrying the transfer of industries from the east. The development of high-tech industries such as equipment manufacturing and biomedicine has played a significant driving role. Leading enterprises represented by Foxconn and BYD have completed their layout in the central region, thereby promoting the trend of industrial clusters. The western region has benefited from the orderly implementation of the national western development strategy, with the continuous expansion of industrial economic growth space. The proportion of industrial added value in the western region to the total nation has been increasing year by year, with a 1.23 percentage point
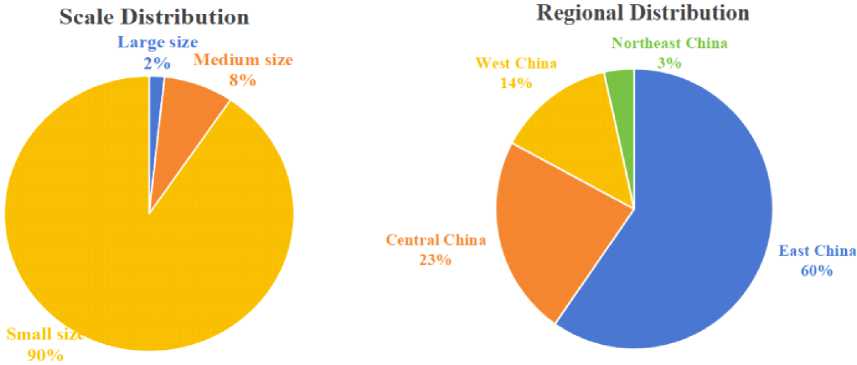
Fig. 2. Distribution of industrial internet platform applications for enterprises above a designated size Note. Source: [China Industrial Statistical Yearbook, 2023].
120,0%
■ East China ■ W est China ■ Central China ■ Northeast China
Fig. 3. Proportion of total industrial added value in China’s four major regions from 2017 to 2022 Note. Source: [China Industrial Statistical Yearbook, 2023].
increase from 2017 to 2021, which gradually narrows the gap with the eastern and central regions. As the backbone of China’s heavy industry, the northeast region has achieved significant results in industrial upgrading after proposing the strategy of revitalizing the old industrial base in Northeast China. The development of the manufacturing industry has improved in quality and efficiency. In 2021, the number of high-tech enterprises reached about 14,000, an increase of 9.5% over the previous year [China Industrial Statistical Yearbook, 2023].
Empirical test on the impact of digitalization on industrial enterprise performance
Based on the analysis of background, status and literature above, in order to explore the impact of digitization on the performance of industrial enterprises, a basic econometric model is constructed as follows (1):
IEPit = ao+aiDIGit+a2Xit + V; + vt+sit , (1)
IEPi,t – performance index of industrial enterprises in province i in year t ; DIGi,t – digitalization index of industrial enterprises in province i in year t ; Xi , t – set of other control variables that affect corporate performance; vi , vt – virtual variables for province and time respectively; ε i,t – random perturbation term; α 0, α 1, α 2 – constant term.
-
1. Explanatory variable – Digitalization level. Based on the literature research results above, this article combines the connotation and characteristics of industrial sectors to ultimately design an evaluation system of digitalization level for industrial enterprises as shown in Table 1.
Due to the evaluation system includes 2 dimensions and 7 secondary indicators, and each indicator has its own items and attribute. Therefore, this research adopts the entropy weight method to determine the weights of each indicators and calculate the comprehensive score according to those weights. The specific steps are as follows:
-
1) define indicators. If the time length is T years, the number of administrative provinces is N , and the number of indicators is M. Xt,i,j are the values of indicator j of region i in year t ;
-
2) standardization of indicators. Standardize the original indicators, i.e. dimensionless. For the convenience of subsequent comparison and analysis, dimensionless processing can be divided into positive and negative indicators:
, xt,i,j ~ m^n^xj^
-
X ^’^^ max^Xj) — min^Xj) (positive indicators), (2)
r max^xj} - xti j t’i’'1 mcLx(Xj) — min(Xj) (negative indicators), (3)
x ' t,i,j – values of indicator j of province i in year t after standardization; xt,i,j – values of indicator j of province i in year t ; xj – values of indicator j ;
-
3) calculate the proportion of the indicator j :
^>i>j = . / (4)
Zji=lZjj=i^ t,i,j
Pt,i,j – the proportion of the indicator j of province i in year t ; x't,i,j – values of indicator j of province i in year t after standardization;
-
4) the entropy value of the indicator j is: T N
ej=_ш™22Рш1пРад' (5)
ej – entropy value of the indicator j of province i in year t ; Pt,i,j – the proportion of the indicator j of province i in year t ; T, N – T is the length of time in years, N is the number of provinces;
-
5) the information utility value of the indicator j : dj = 1 – ej , (6)
dj – information utility value of the indicator j of province i in year t ; ej – entropy value of the indicator j of province i in year t ;
Table 1
Evaluation system for industrial digitalization level
|
Dimensions |
Indicators |
Indicator attribute |
|
Infrastructure Construction |
Fixed investment in the electronic information industry |
Positive |
|
Number of mobile phone base stations |
Positive |
|
|
Number of internet access ports |
Positive |
|
|
Industrial Digitalization |
Proportion of industrial application internet |
Positive |
|
Number of computers used per 100 people |
Positive |
|
|
Integration index of industrialization and informatization |
Positive |
|
|
E-commerce transaction volume of industrial enterprises |
Positive |
Note. Compiled by the author based on the results of the research.
-
6) weight of the indicator j :
1 dj’ (7)
ωj – weight of the indicator j of province i in year t ; dj – information utility value of the indicator j of province i in year t ; M – the number of indicators;
-
7) comprehensive score of digitalization level:
-
2. Explained variable – Performance. As the main body of the market economy, industrial enterprises cannot solely pursue financial performance. While pursuing maximum profits, they need to take on more responsibilities of social development and environmental protection as well as achieve an effective balance between economies, society and environment in order to continuously enhance their core competitiveness [Nie, 2025]. Therefore, based on existing research results, this article constructs an evaluation system of industrial enterprises performance as shown in Table 2.
-
3. Control variables. In scientific research, control variables are introduced to eliminate the potential influence of unrelated variables beyond the explanatory and explained variables. According to the research of Sun et al. [Sun, Hou, 2019], except for Year and Region, the control variables are as follows: 1) economic development level: Expressed by per capita GDP; 2) degree of openness: Expressed by the total import and export volume of goods; 3) financial development level: Expressed by the Digital Financial Inclusion Index; 4) talent development potential: Expressed by per capita education expenditure. The above control variables refer to the values of a certain region in a certain year, which can be queried from Chinese Statistical Yearbooks or research reports proposed by official institutions as well. All variables involved in this research are shown in Table 3.
^^9t,i ^j^C^j-^tij), (8)
Digt.i – weight of the indicator j of province i in year t ; ωj – weight of the indicator j of province i in year t ; xt,i,j – values of indicator j of province i in year t ; M – the number of indicators.
In Table 2, Rationalization of industrial structure is a core indicator for measuring the degree of coordination between industries and the efficiency of resource allocation. It is calculated based on the Theil index and focuses on the matching degree between labor productivity and employment structure among the three industry sectors [Zhang, Zhong, 2019]. The Advancement of industrial structure is a key indicator for measuring the optimization of industrial structure and the level of service-oriented development. It is calculated by the ratio of added value between the tertiary and secondary industries. Other indicators can be directly queried from Chinese Statistical Yearbooks or research reports proposed by official institutions. The comprehensive score of enterprise performance is also calculated by using the entropy weight method, and the detailed procedures refer to the calculation of explanatory variable.
This research selected data from 31 provinciallevel administrative regions in China, excluding Hong Kong, Macao, and Taiwan, from 2014 to 2023
Table 2
Evaluation system for industrial enterprise performance
|
Dimensions |
Indicators |
Indicator attribute |
|
Economic Benefits |
Profit margin of industrial enterprises |
Positive |
|
Labor productivity of industrial enterprises |
Positive |
|
|
Return on Assets of Industrial Enterprises |
Positive |
|
|
Social Benefits |
Proportion of employment in the industrial sector |
Positive |
|
Average wage of industrial employees |
Positive |
|
|
Proportion of industrial output value to GDP |
Positive |
|
|
Enviromental Benefits |
Energy consumption per unit of industrial added value |
Negative |
|
Sulfur dioxide emissionsper unit of industrial added value |
Negative |
|
|
Utilization rate of solid waste treatment |
Positive |
|
|
Innovation Ability |
R&d investment in industrial enterprises |
Positive |
|
R&d personnel investment in industrial enterprises |
Positive |
|
|
Number of effective invention patents for industrial enterprises above designated size |
Positive |
|
|
Industrial Upgrading |
Rationalization of industrialstructure |
Negative |
|
Advancement ofindustrialstructure |
Positive |
|
|
Proportion of productive service industry |
Positive |
Note. Compiled by the author based on the results of the research.
as samples. The data is sourced from the China Statistical Yearbook, China Population and Employment Statistical Yearbook, China Industrial Economic Statistical Yearbook, China Science and Technology Statistical Yearbook, and statistical yearbooks from various provinces. In order to overcome the influence of extreme values and outliers, the empirical analysis performed on each variable a 1% truncation process after standardization. Linear interpolation was used to fill in the missing data. The results of the correlation analysis between variables are shown in Table 4.
According to Table 4, there is a strong correlation between digitalization level and enterprise performance. Meanwhile, the control variable and the dependent variable have a certain correlation as well. There is no strong correlation between the explanatory variable and the control variable; therefore, subsequent regression analysis and hypothesis testing can be conducted.
In order to examine the impact of digitalization on corporate performance, the Hausman test was conducted on the regression results of fixed effects and random effects models as shown in Table 5. Based on the test results, the following empirical analysis will prioritize the use of the fixed effects model (FE model).
The benchmark regression results are shown in Table 6. Model 1 and Model 3 are the regression results of the FE model and the two-way fixed effects
Table 3
Definition and description of main variables
|
Variable category |
Variable items |
Variable Symbol |
Variable Definition |
|
Explanatory variable |
Digitalization |
Dig |
Industrial digitalization level calculated based on entropy method |
|
Explained variable |
Performance |
Per |
Comprehensive performance of industrial enterprises calculated based on entropy method |
|
Control variables |
Economic development level |
Edl |
Per capita GDP |
|
Talent development potential |
Tdp |
Per capita education expenditure |
|
|
Degree of openness |
Doo |
Total import and export volume of goods |
|
|
Financial development level |
Fdl |
Digital financial inclusion index |
|
|
Year |
Year |
Corresponding year for statistics |
|
|
Region |
Reg |
Corresponding region for statistics |
Note . Compiled by the author based on the results of the research.
Table 4
Correlation coefficient
|
Varaible |
Per |
Dig |
Edl |
Tdp |
Doo |
Fdl |
|
Per |
1 |
|||||
|
Dig |
0.426*** |
1 |
||||
|
Edl |
0.290*** |
0.212** |
1 |
|||
|
Tdp |
0.285** |
0.191* |
0.887 |
1 |
||
|
Doo |
0.240*** |
0.113 |
0.671 |
0.577* |
1 |
|
|
Fdl |
0.160** |
0.150 |
0.916* |
0.824 |
0.684 |
1 |
* p < 0.1, ** p < 0.05, *** p < 0.01
Note. Calculated by the author based on the results of the research.
Table 5
Hausman test
|
Type |
Purpose |
Test |
Conclusion |
|
F Test |
Comparison of FE Model and POOL Model |
F (30, 278) = 57.567 p = 0.000 |
FE Model |
|
BP Test |
Comparison of RE Model and POOL Model |
χ2 (1) = 908.844 p = 0.000 |
RE Model |
|
Hausman Test |
Comparison of FE Model and RE Model |
χ2 (1) = 53.043 p = 0.000 |
FE Model |
Note . Calculated by the author based on the results of the research.
model, respectively, without controlling variables. Model 2 and Model 4 introduce control variables. It can be seen that the coefficient of the impact of digitalization level on the enterprise performance is significantly positive at a confidence level of 1%, which indicates that digitalization can improve the performance level of enterprises.
However, digital transformation is a long-term and dynamic process. Enterprises need to continuously invest funds and manpower [Yang R.F., Yang M.J., 2025]. Further research is needed to determine the extent to which it can ultimately bring positive effects to the enterprise’s performance. In order to separate the sample into high-level and low-level digital transformation, this study employs the median of the comprehensive score of digitalization level as the dividing line. The regression results are shown in Table 7.
According to the table above, enterprises with high digitalization levels have higher regression coefficients and positive significance than those with low levels of digitalization. That is to say, only when the degree of digital transformation is high can digital transformation release strong positive effects and
Table 6
Benchmark regression
|
Variables |
Model 1 |
Model 2 |
Model 3 |
Model 4 |
|
Constant |
0.145** (4.775) |
0.230*** (0.637) |
0.198*** (9.892) |
–0.043*** (–1.300) |
|
Dig |
0.307*** (4.124) |
0.358*** (3.372) |
0.113*** (1.560) |
0.342*** (3.680) |
|
Edl |
0.068** (1.797) |
0.088 (1.222) |
||
|
Tdp |
0.087 (1.720) |
0.082** (2.912) |
||
|
Doo |
0.262* (2.075) |
0.570* (2.092) |
||
|
Fdl |
0.172* (2.382) |
0.206 (1.784) |
||
|
R-squared |
0.181 |
–0.073 |
0.109 |
–0.584 |
|
R-squared (within) |
0.258 |
0.349 |
0.110 |
0.547 |
|
N |
310 |
310 |
310 |
310 |
|
Test |
F (1, 308) = 17.006, p = 0.000 |
F (5, 274) = 24.671, p = 0.000 |
F (1, 269) = 24.34, p = 0.000 |
F (5, 274) = 31.802, p = 0.000 |
|
Time effect |
No |
No |
Yes |
Yes |
|
Regional effect |
No |
No |
Yes |
Yes |
|
*p < 0.05, ** p < 0.01, *** p < 0.001 |
||||
Note. Calculated by the author based on the results of the research.
Table 7
Regression results of different digitalization levels on enterprise performance
|
Variables |
High digitalization level |
Low digitalization level |
|
Dig |
0.266** (2.839) |
0.121* (2.199) |
|
Edl |
0.151 (1.784) |
–0.344 (–1.547) |
|
Tdp |
0.084** (2.771) |
0.247 (1.815) |
|
Doo |
0.649* (2.072) |
0.089 (0.278) |
|
Fdl |
0.142 (1.070) |
0.236* (2.324) |
|
n |
–0.848 |
0.061 |
|
R-squared |
0.559 |
0.365 |
|
Adjust R-squared |
249 |
61 |
|
F |
F (5, 213) = 26.827, p = 0.000 |
F (5, 46) = 12.904, p = 0.000 |
|
* p < 0.05, ** p < 0.01 |
||
Note. Calculated by the author based on the results of the research.
significantly enhance the enterprise’s performance. Thus, the hypothesis proposed in this research has been validated.
To prevent errors in benchmark regression results, which may lead to unreliability of research results, robust and endogeneity tests need to be conducted. The benchmark regression results show that the higher the level of digitalization, the greater its impact on performance. To ensure the robustness of the conclusions, this research will validate the previous research findings through three methods: replacing core explanatory variables, changing measurement methods, and removing some annual data, as seen in Table 8.
Model 5 replaces the core explanatory variables. In order to prevent errors in the replaced variables, this research lagged the explanatory variable by one period before conducting regression. According to model 5, the level of digitalization still has a significant positive impact on enterprise performance at the 1% level, with a coefficient of 0.205, which indicates that the empirical results are robust.
Model 6 is a transformation metric method. To test the robustness of the research results after model transformation, this research uses the least squares method for regression again. The result indicates that digitalization level still has a significant positive impact on enterprise performance at the 1% level, with a coefficient of 0.257, which proves that the regression results of the main effect are very robust.
Model 7 excludes some research intervals. Since the outbreak of the COVID-19 pandemic in 2020, it has had a huge impact on the development of various industries, especially on industrial enterprises that were undergoing digital transformation at that period. Therefore, regression analysis will be conducted again after deleting the sample data from the years 2020 to 2021. According to the test results, the level of digitalization is still significantly positive for the enterprise performance at the 1% level, with a coefficient of 0.311. The results are robust.
In empirical research, there may be endogeneity issues between explanatory variables and explained variables; that is, the level of digitalization can promote the increase of enterprise performance. Similarly, the improvement of performance may in turn influence the digitalization level. To solve the issue of mutual influence between variables, this research uses a lagged explanatory variable for one period as an instrumental variable for endogeneity testing. The test results are shown in Tables 9 and 10.
In the first stage, the coefficient of the instrumental variable is 0.249, which is significant at the 1% level. This indicates a significant correlation between the instrumental variable and the explanatory variable. In the second stage, the coefficient of the explanatory variable is 0.845, which is also significant at the 1% significance level, indicating that the improvement of digitalization significantly enhances the innovation performance of manufacturing enterprises. In addition, the p -value in both the Durbin test and the Wu-Hausman test is greater than 0.05, which indicates that all explanatory variables are exogenous and there is no endogeneity problem.
Due to the differences in economic development, business environment, and policy orientation in different regions in China, it may have varying impacts on the digitalization and performance levels of enterprises [Lu, Liu, Sun, 2021]. According to the latest definition by
Table 8
Robust test
|
Variables |
Model 5 |
Model 6 |
Model 7 |
|
L. Dig |
0.205** (2.844) |
||
|
Dig |
0.257*** (8.194) |
0.311** (2.808) |
|
|
Edl |
0.294** (1.141) |
0.362** (2.811) |
0.094** (0.824) |
|
Tdp |
0.152 (1.351) |
0.132 (1.531) |
0.066 (1.920) |
|
Doo |
0.190** (0.854) |
0.164* (2.032) |
0.548* (2.378) |
|
Fdl |
0.451* (1.464) |
0.463*** (3.871) |
0.268* (2.362) |
|
* p < 0.05, ** p < 0.01, *** p < 0.001 |
|||
Note. Calculated by the author based on the results of the research.
the National Bureau of Statistics (2025), this research divided the sample into three regions based on geographical location: Eastern China, Central China, Western China, and Northeast China. The corresponding regression analysis results are shown in Table 11.
The regression results for all three regions are significantly positive at a confidence level of 1%, and the heterogeneity issue doesn’t exist. From the comparison of coefficients, Eastern China has the highest coefficient and the most significant confidence level, which indicates that digital development has the
Table 9
Endogeneity test
|
Variables |
First stage |
Second stage |
|
L. Dig |
0.249** (5.996) |
|
|
Dig |
0.845*** (28.337) |
|
|
Edl |
0.053 (0.525) |
0.364*** (3.534) |
|
Tdp |
0.087 (0.605) |
0.134 (1.696) |
|
Doo |
–0.018 (1.303) |
0.165** (2.856) |
|
Fdl |
–0.045 (–0.372) |
–0.467*** (–5.282) |
|
n |
310 |
310 |
|
R-squared |
0.296 |
0.742 |
|
Adjust R-squared |
0.284 |
0.738 |
|
F |
F (5, 303) = 113.196, p = 0.007 |
F (5, 303) = 174.137, p = 0.000 |
|
** p < 0.01, *** p < 0.001 |
||
Note. Calculated by the author based on the results of the research.
Table 10
Durbin-Wu-Hausman test of exogeneity
|
Test |
Null Hypothesis |
Result |
Conclusion |
|
Durbin Test |
All explanatory variables are exogenous (no endogenous variables) |
χ2 (1) = 0.118, p = 0.732 |
Accept the null hypothesis |
|
Wu-Hausman Test |
All explanatory variables are exogenous (no endogenous variables) |
F (1, 302) = 0.115, p = 0.735 |
Accept the null hypothesis |
Note. Calculated by the author based on the results of the research.
Table 11
Regional heterogeneity test
|
Variables |
Eastern China |
Central China |
Western China |
|
Dig |
0.311*** (2.735) |
0.191** (1.923) |
0.220* (2.214) |
|
Edl |
0.119 (0.830) |
0.157 (0.472) |
0.178 (1.366) |
|
Tdp |
0.093* (2.082) |
0.098 (0.646) |
0.090 (1.117) |
|
Doo |
0.686 (1.868) |
0.528* (2.345) |
0.085 (1.107) |
|
Fdl |
0.048* (0.239) |
1.005* (2.428) |
0.316** (3.137) |
|
R-squared |
–0.952 |
–1.322 |
–0.111 |
|
R-squared (within) |
0.564 |
0.624 |
0.500 |
|
n |
130 |
60 |
120 |
|
Test |
F (5, 112) = 16.381, p = 0.000 |
F (5, 49) = 16.260, p = 0.006 |
F (5, 103) = 24.985, p = 0.029 |
|
* p < 0.05, ** p < 0.01 |
, *** p < 0.001 |
Note. Calculated by the author based on the results of the research.
greatest impact on enterprise performance. The central region is the second, while the western region ranks last. This result is in line with China’s current economic development situation of being strong in the east and weak in the west. As the core engine of Chinese economic development, the eastern region accounts for over 50% of the country’s total economic output, and the financing scale of the capital and financial markets accounts for 80% of the country’s total. The vast majority of high-tech enterprises with large scale, good profit, and a high degree of digitization are located in eastern China.
Through this research, it has been found that digitalization significantly promotes enterprise performance, and the positive effect is stronger as the degree of digital transformation increases. To further enhance the positive impact of digitalization on the enterprise’s performance and development, industrial enterprises should strive to deeply implement the digital transformation strategy, build an efficient dynamic digital information-sharing platform, and achieve effective integration of digitalization with the industrial chain and partners, thereby maintaining their core competitiveness and achieving high-quality development.
