Implications of the use of liquefied natural gas for marine transportation in the Arctic

Author: Alеksei I. Patonia
Journal: Arctic and North @arctic-and-north
Section: Economics, political science, society and culture
Article in issue: 21, 2015.
Free access
The transition from the use of bunker fuel to the use of the liquefied natural gas (LNG) for the Arctic marine transportation has various consequences. The author is interested to present the issue in the political, economic, environmental, marine legal perspectives. Implementing the regime efficiency and niche selection approach as well as the Environmental Kuznets Curve, the paper demonstrates potential benign interdependence of the Arctic countries after they have transferred their vessels to LNG. In such circumstances, Norway, Canada and the US are shown as the most benefiting nations. The second part of the article is devoted to the significant environmental improvement after the transition with a particular attention to the dramatic decrease of black carbon (soot) which leads to increase of albedo. Finally, the paper examines the existing legal provisions regulating the transition to LNG and modulates a further development scenario based on the theory of the lifecycle of a norm.
Liquefied natural gas, Environmental Kuznets Curve, arctic amplification, albedo, black carbon, benign interdependence, UNCLOS, Norway, the USA
Short address: https://sciup.org/148318689
IDR: 148318689 | UDC: 334.02/338.001.36 | DOI: 10.17238/issn2221-2698.2015.21.52
Text of the scientific article Implications of the use of liquefied natural gas for marine transportation in the Arctic
Even though there are both proponents and opponents of the global warming concept observations show us that in the past decades ice coverage in the Arctic happened to be less intense when compared to the preceding decades. According to the National Snow and Ice Data Center (NSIDC) [1, 2012] in 2012 the sea ice extent in the Arctic reached its historical minimum from the first satellite record in 1979. In such circumstances global shipping industries are enthusiastically considering Northern Sea Route (NSR) and Northwest Passage (NWP) as more economically attractive alternatives to the traditional transportation ways through the Suez and Panama Canals since, in the opinion of such researchers as Schøyen and Bråthen [2, 2011], it has more than doubling effect on the vessels’ energy efficiency performance. Even though Ragner [3, 2008] and Humpert [4, 2013] are rather skeptical about the prognoses for both passages to gain extreme popularity capable of replacing old transportation corridors greatly because of shipping seasonality and current dilution of the Chinese and Indian exports and imports with non-European venues (e.g. Africa, Latin America etc.), the Arctic marine transportation statistics provided by the Northern Sea Route Information Office shows that the number of vessels in the NSR in 2013 almost doubled that of 20111.
Apart from potentially positive economic impact on costal states increased maritime traffic in the region bears a number of challenges with environmental concerns to be among the most vivid ones: Namely, greater number of vessels poses more substantial threat of environmental pollution. In addition to that, the very use of residual oil as a propellant for the marine transportation mode in general, and heavy fuel oil as the most commonly used one, in particular, stimulates Arctic amplification because of the great amount of greenhouse gases and other pollutants discharged on the way (e.g. sulfur and nitrogen oxides, soot etc.). According to the World Wide Fund for Nature (WWF) [5, 2015], maritime transportation is the cause of about ten percent of global emissions of sulfuric acid. In this connection significant attempts have been made to replace residual oil with more environmentally-friendly alternatives with liquefied natural gas (LNG) being one of the most promising ones.
Implications
This paper aims at representing multifaceted consequences of the ultimate transition from bunker fuel to LNG as the main transportation fuel in the Arctic. According to the WWF [5, 2015], this will have tremendously positive effect on environment cutting overall pollution almost by ninety percent. Apart from that, it will definitely influence economic and political environments of the coastal and flag states. Finally, such a transition may potentially have repercussions for the Law of the Sea. Thus, the objectives of the current paper are to investigate and view the consequences of the researched transition from the political, environmental and legal perspectives.
As most of the scholars covering LNG use for marine transportation focus either on the economic effect of this issue or its environmental ramifications, this research will implement Environmental Kuznets Curve (EKC) to illustrate the relationship between environmental quality and economic development of the Arctic nations with respect to the use of LNG technology for maritime transport. Since this illustration reveals certain stratification in the economic development of the engaged states the concepts of regime effectiveness and regional niche selection mentioned by Stokke [6, 2013] are applied to modulate benign interdependence between them in the future as they help to explain cooperation policies of the coastal states in implementing LNG transportation technology through the prism of economic rationale.
Part 2. covering natural science focuses on environmental constituent of the EKC showing evidence of affirmative environmental impact of the researched transition. Here, the statistics provided by various institutions and illustrating pollution by different substances associated with bunker fuel shows how Arctic shipping is influencing the regional environment. The respective comparative indicators of LNG-related maritime transportation show the affirmative change that could have been achieved after the transition. Apart from comparing nitrogen and sulfur oxides specific attention is drawn to black carbon (soot) as the main contributor to the reduced albedo and Arctic amplification.
Finally, adapting ship-building industry to LNG standards may have important repercussions for legal regulations of the maritime transport in the Arctic. This paper examines the already-existent provisions of the international law of the sea for their applicability to the researched change in the core marine fuel. Apart from that, the author implements the concept of international norm dynamics and political change (the so-called ‘norm life cycle’) introduced by Finnemore and Sikkink [7, 1998] to illustrate the tendencies taking place in marine fuel industry.
Implications for politics and economics
A number of writers have already assessed the issue of the development of national hydrocarbon industries and environmental conditions accompanying such development. For example, Saboori and Sulaiman [8, 2013] viewing the example of Malaysia bind oil production to environmental degradation whereas natural gas development — to the mitigation of these consequences. According to the authors, this also coincides with per capita income in the country which perfectly goes in line with the EKC.
In their research Peters et al [9, 2011] modulate future emissions from shipping in the Arctic presupposing increase in marine traffic within the conditions of retreating Arctic ice. Quite predictably, the researchers assume greater emission of CO 2 , soot, sulfuric and nitrogen acids to escort this increase. At the same time, they do not mention potential switch to new forms of marine fuel such as LNG. In this connection Æsøy and Stenersen [10, 2013] provide evidence supporting the idea that gas-propelled vessels may decrease the overall pollution by at least 25 per cent. In that sense, LNG use can be associated with environmental revival, whereas implementation of residual oil — with environmental decay.
Recent national data on the launch of LNG-propelled Arctic vessels supports this idea illustrating another interesting trend: LNG use for marine transportation purposes is instigated by the countries with greatest income per capita rather than the ones solely relying on the abundance of domestic deposits of natural gas. For example, apart from Norway — an Arctic country with significant natural gas reserves that launched LNG-propelled shipbuilding — Brenntrø, Garcia Agis and Thirion [11, 2013] mention Finland and Canada. Quite surprisingly, Russia — the country with the greatest natural gas reserves — is not in the list of LNG enthusiasts.
Illustration of the coastal states’ interest in marine LNG fuel initiatives paralleled with their natural gas deposits and GDP per capita gives us the following picture:
Table 1
|
Arctic states |
GDP per capita in USD |
Proved natural gas reserves in m 3 |
Expressed interest in LNG-propelled maritime vessels |
|
Canada |
50,231 |
1,889,000,000,000 |
Significant interest for internal and internal transportation purposes |
|
Denmark |
60,634 |
43,010,000,000 |
Firm interest with governmental support, but potential technology importer |
|
Finland |
49,541 |
0 |
Own shipbuilding projects for LNG-propelled vessels (with key industry pioneering companies — e.g. Wärtsilä) — potential technology exporter |
|
Iceland |
52,111 |
0 |
Expressed interest, but absence of technology |
|
Norway |
97,963 |
2,090,000,000,000 |
Extremely high interest with own technologies and projects |
|
Russia |
12,735 |
47,800,000,000,000 |
No expressed interest and absence of technology |
|
Sweden |
58,887 |
0 |
Interest in building LNG infrastructure, but potential technology importer |
|
USA |
54,629 |
8,734,000,000,000 |
Sound business interest |
|
Sources |
World Bank2 [13, 2014]) |
CIA [14, 2014] 3 |
Brenntrø, Garcia Agis & Thirion [12, 2013] |
In graphic terms this could be represented as follows:
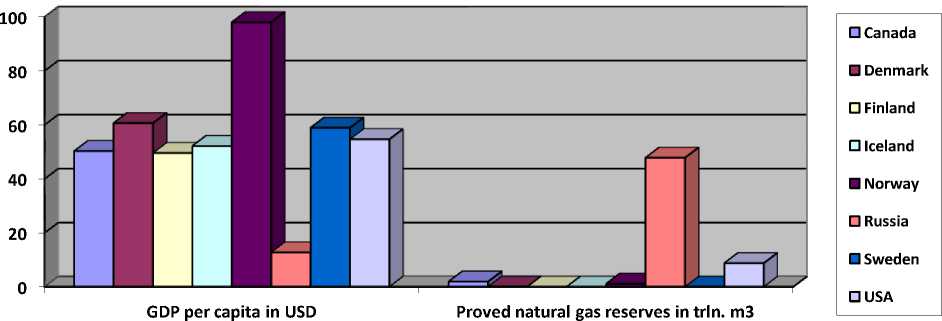
As we see on the example of the Arctic nations, there is strong discrepancy between the amount of natural gas reserves in such countries as Russia and their interest in transition to LNG, whereas high GDP per capita almost necessarily means LNG enthusiasm. Applicably to the EKC this could be represented as follows:
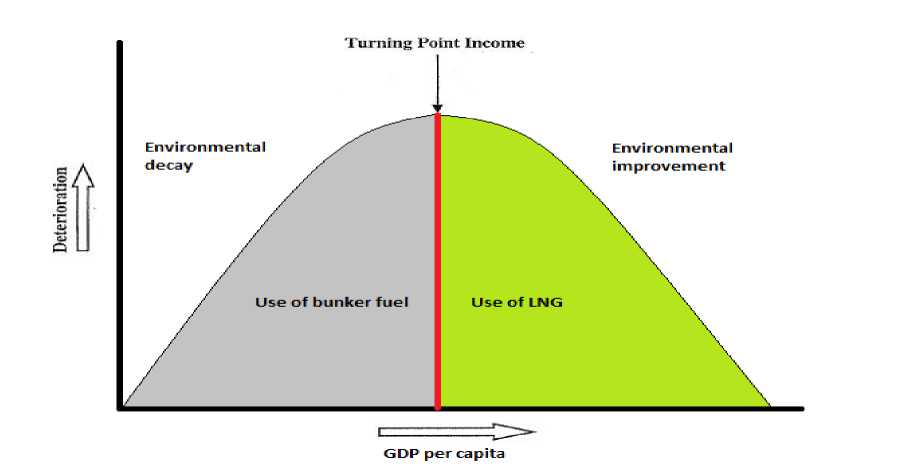
Picture 1. Use the Environmental Kuznets Curve
At the same time, however, GDP per capita does not necessarily need to be the only driver of LNG popularity: e.g. Finland with lower per capita income in comparison to Iceland happens to be more progressive in this respect. Here, in the opinion of author, technology availability should be mentioned as a supplementary factor.
In this connection, regional niche selection principle mentioned by Stokke [6, 2013] could be applied to the future prognosis of the situation in the region. Here, such countries as Norway and Finland being most technologically advanced could play the role of technology suppliers to such nations as e.g. Russia, whereas the latter ones can be regarded as fuel suppliers. Such affirmative cooperation illustrates potential benign interdependence as Finnish and Norwegian companies will presumably be interested in coming to Russia with immense LNG potential. With the ‘traffic light system’ indicating resource- and technology-recipients with ‘red’, technology/resource suppliers — with ‘yellow’ and the suppliers of both resources and technology — with ‘green’, we could represent the overall future prognosis in the following way:
Table 2
|
Country |
Potential niche in the future |
Argumentation |
Source |
|
|
Canada |
Probable stake in both technology-and resource-supplying niches. |
Already launched own LNG-propelled vessels and infrastructure building projects (round 15 LNG terminals in British Columbia) |
ABC4 |
|
|
Denmark |
LNG-bunkering terminal – technology-supply niche |
Absence of resource with developing infrastructure |
Danish Maritime Authori-ty5 |
|
|
Finland |
Technology-supplier for building both LNG-propelled vessels and bunker terminals |
Well-developed infrastructure and industry with absence of resource |
||
|
Iceland |
Technology and fuel recipient |
Absence of resources and technology |
Jónsdóttir [12, 2013] |
|
|
Norway |
Both technology- and fuel-exporter because |
Great number of natural gas deposits, available technology for building LNG-driven vessels and LNG-bunkering terminal |
Danish Maritime Authority |
|
|
Russia |
Resource-supplier |
Abundance of natural gas, but absence of technologies |
Paltsev [13, 2014] |
|
|
Sweden |
Potential supplier of technology |
Relative development of infrastructure and technology |
Danish Maritime Authority |
|
|
USA |
Potential supplier of both resource and technology |
Point Nikiski LNG terminal for bunkering in Alaska and a number of launched LNG-propelled vessels |
ABC |
|
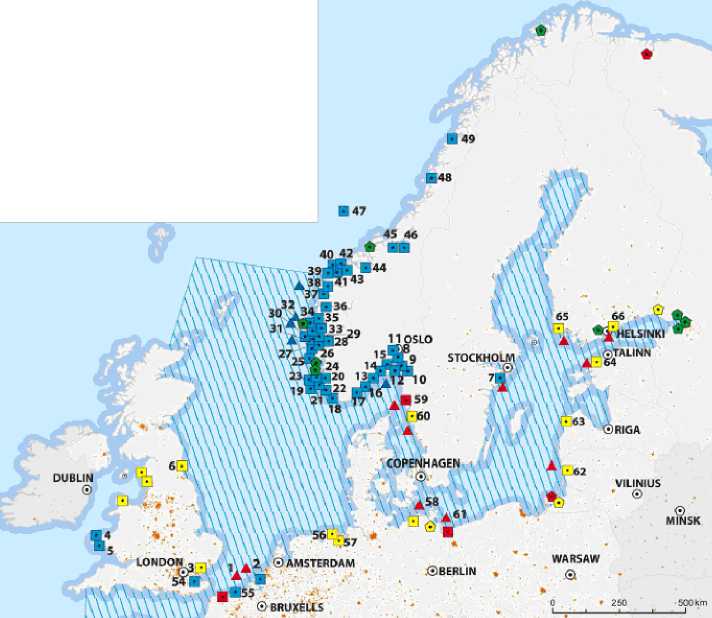
As we see from the table, all the Arctic countries except from Iceland could take either the technology/resource supplier niche (e.g. Denmark, Finland, Russia and Sweden) or the one of relative self-sufficiency in this respect supporting themselves and others with both resources and technology (Canada, Norway and the United States). This future trend can be proved by the current situation with LNG industry in Europe (pic. 2).
W Existing LNG Production Plants
W Planned LNG Production Plants ф Proposed LNG Production Plants
A Existing small scale export/bunkering facilities
A Planned small scale export/bunkering facilities
-
• Existing LNG Terminals
-
■ Planned and decided LNGTerminals
Q Planned but not decided LNG Terminals
Ws SEGA Area
• Urban areas
@ Capital
(estrel Energy - Downeast LNG)
)n LNG)
I (Cheniere - Corpus Christi LNG)
«port LNG Dev/Freeport LNG
I)
fd (Cheniere - Corpus Christi LNG)
>rdan Cove Energy Project)
i (Southern Union - Trunkline LNG) iempra - Cameron LNG)
(Dominion - Cove Point LNG)
egon LNG)
(Excelerate Liquefaction) LIDENTIFIED BY PROJECT ache Canada Ltd.)
Bcfd (BC LNG Export Cooperative)
TIFIED BY PROJECT SPONSORS
I (Gulf Coast LNG Export)
I (Gulf LNG Liquefaction)
I (Southern LNG Company)
i (ExxonMobil - Golden Pass)
1.07 Bcfd (CE FING)
6 Bcfd (Waller LNG Services) (Pangea LNG (North America))
s IDENTIFIED by project
!: 1.0 Bcfd (Sheil Canada)
(Pieridae Energy Canada)
source: [16,2014]
Picture 2. LNG industry in Europe
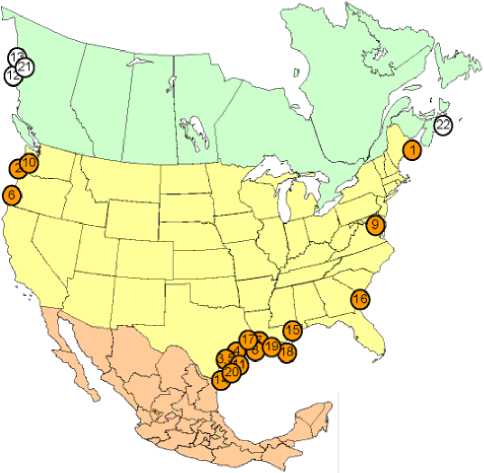
Similarly, the situation in North America could be represented as follows (pic 3).
Import Terminal
PROPOSED TO FERC
-
1. Robbins ton, ME: 0.5 Bcfd (Kestrel Energy - Downeast LNG)
-
2. Astoria, OR: 1.5 Bcfd (Oregon LNG)
-
3. Corpus Christi, TX: 0.4 Bcfd (Cheniere - Corpus Christi LNG)
О FERC
Q MARAD/USCG
-
4. Freeport, TX: 1.8 Bcfd (Freeport LNG Dev/Freeport LNG Expansion/FLNG Liquefaction)
-
5. Corpus Christi, TX: 2.1 Bcfd (Cheniere - Corpus Christi LNG)
-
6. Coos Bay, OR: 0.9 Bcfd (Jordan Cove Energy Project)
-
7. Lake Charles, LA: 2.4 Bcfd (Southern Union - Trunkline LNG)
-
8. Hackberry, LA: 1.7 Bcfd (Sempra - Cameron LNG)
-
9. Cove Point, MD: 0.75 Bcfd (Dominion - Cove Point LNG)
-
10. Astoria, OR: 1.30 Bcfd (Oregon LNG)
-
11. Lavaca Bay, TX: 1.38 Bcfd (Excelerate Liquefaction) PROPOSED CANADIAN SITES IDENTIFIED BY PROJECT
-
12. Kitimat, BC: 0.7 Bcfd (Apache Canada Ltd.)
-
13. Douglas Island, BC: 0.25 Bcfd (BC LNG Export Cooperative)
-
14. Brownsville, TX: 2.8 Bcfd (Gulf Coast LNG Export)
-
15. Pascagoula, MS: 1.5 Bcfd (Gulf LNG Liquefaction)
-
16. Elba Island, GA: 0.5 Bcfd (Southern LNG Company)
-
17. Sabine Pass, TX: 2.6 Bcfd (ExxonMobil - Golden Pass)
-
18. Plaquemines Parish, LA: 1.07 Bcfd (CE FLNG)
US Jurisdiction
-
19. Cameron Parish, LA: 0.16 Bcfd (Waller LNG Services)
-
20. Ingleside, TX: 1.09 Bcfd (Pangea LNG (North America))
-
21. Prince Rupert Island, BC: 1.0 Bcfd (Shell Canada)
-
22. Goldboro, NS: 0.67 Bcfd (Pieridae Energy Canada)
Export Terminal
PROPOSED TO FERC
SPONSORS
POTENTIAL U.S. SITES IDENTIFIED BY PROJECT SPONSORS
POTENTIAL CANADIAN SITES IDENTIFIED SY PROJECT SPONSORS
source: [29, 2012]
According to the United States Energy Information Administration6, the situation in Alaska is as follows (pic 4.).
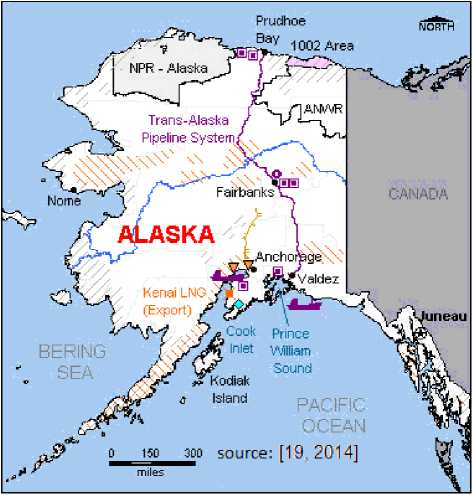
Picture 4. LNG map of Alaska
As we see, no significant LNG projects have been launched in the Canadian Arctic while the
US has only one LNG plant in Alaska. According to the Asia Pacific Foundation of Canada (APFC) [14,
2015], the situation in Russia looks quite similar (pic. 5.).
Summer
Baltic LNG 10 mtpa Gazprom
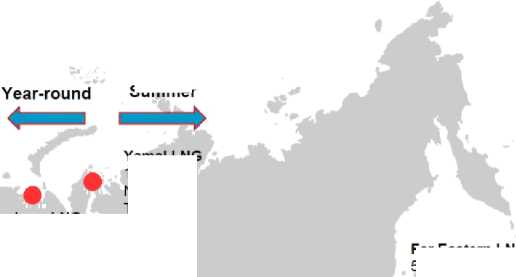
Sakhalin-2 10-15 mtpa
Pechora LNG 10 mtpa Rosneft/Alltek
Yama! LNG 16.5 mtpa Novatek Total CNCP
Far Eastern LNG 5-10 mtpa Rosneft/ExxonMobil
38 bcma Power of Siberia
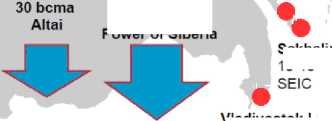
Vladivostok LNG 10-15 mtpa Gazprom
Picture 5. LNG industry in Russia
source: [20, 2015]
Here on the map only Baltic, Vladivostok and Sakhalin-2 projects have been completed leaving the Russian Arctic out of the infrastructure coverage [14, 2015].
In such circumstances only Norway happens to be a true ‘versatile performer’ possessing all the important factors for the future dominance in the LNG-propelled maritime transportation and the highest level of regime effectiveness: natural gas, vessel- and plant-building technology and already developed infrastructure.
Implications for the environment
According to Æsøy and Stenersen [10, 2013], the use of LNG as a main transportation fuel will have a tremendously positive environmental effects not only in terms of CO2 reductions, but also in terms of almost complete elimination of nitrogen and sulfur acids. Since this research focuses on the ecological implications for shipping in the high Arctic, no fishing activities are examined. Instead, the NSR and NWP are taken as examples to demonstrate the effect of fuel transition.
Since the International Chamber of Shipping (ICS) estimates average oil tanker to produce 5,9 grams of CO2 per tonne-km and a bulk carrier — 7,9 grams of CO2 per tonne-km7., we can calculate the mean average emission of such vessels operation in the Arctic, which is 6.9 grams of CO2 per tonne-km:
(5,9 + 7,9)/2 = 6.9.
As the ICS (2014) indicates the average carrier vessel to carry between 10,000 and 120,000 dwt, the mean average deadweight tonnage of such vessels would be 65,000 dwt:
(10,000 + 120,000)/2=65,000.
In a similar way we can calculate the average distance of the NSR, knowing that the distance from Yokohama, Japan to Kirkenes, Norway is 5,750 n.m. and the distance from Shanghai, China to Kirkenes, Norway is 6,500 n.m. [5, 2015]:
(5,750 + 6,500)/2 = 6,125.
6,125 n.m. equals to 11343,5 km.
When it comes to the NWP, the Enciclopædia Britannica indicates its distance to range between 6,500 and 7,500 n.m8. which means that the average one is as follows:
(6,500 + 7,500)/2 = 7,000.
This equals to 12,964 km.
Now, knowing the annual number of vessels using each of the routes we can calculate the
average annual CO2 emission for each of them:
CO2 emissions in tonnes forthe NSR
Annual number of __ shin cruises X 6'9 6r/tkm X ^«.S km X 65,000 dwt Dlll|J UUIjCj
1,000,000 gr
CO2 emissions in tonnes
Annual number of „ , , „ „ shin cruises X 6 9 gr/tkm X 12'964 krn X 65'000 dwt
for the NWP
1,000,000 gr
From 2011 till 2013 the situation looks in the following way9 (table.3.).
Table 3
|
Year |
Number of NSR cruises |
Number of NWP cruises |
Average total CO2 emissions for the NSR (in tonnes) |
Average total CO2 emissions for the NWP (in tonnes) |
Average total CO2 emissions for both routes |
|
2011 |
41 |
7 |
208,589.95 |
40,700.48 |
249,290.43 |
|
2012 |
46 |
9 |
234,027.75 |
52,329.19 |
286,356.94 |
|
2013 |
71 |
8 |
361,216.74 |
46,514.83 |
407,731.57 |
|
Sources |
NSRIO |
McFarlane [15,] Headland [16] |
Calculations conducted by the author using the formulas represented above |
||
* - yachts are not included in the calculation as they are partially propelled by sails.
At this moment, knowing the average annual CO2 emissions of vessels in the Arctic and the percentage of CO2 emission reduction through the use of LNG-propelled ships we can illustrate the impact of such transition assuming all the carriers were transformed into LNG-driven ones. Since according to Æsøy and Stenersen [11, 2013], the CO2 emissions are reduced by 25 percent in such a case, the comparative Arctic transit shipping using two different fuels could be represented as follows:
Table 4
|
Years |
Annual CO2 emissions with the bunker fuel (in tonnes) |
Annual CO2 emissions with LNG (in tonnes) |
|
2011 |
249,290.43 |
186,967.82 |
|
2012 |
286,356.94 |
214,767.71 |
|
2013 |
407,731.57 |
305,798.68 |
|
Sources |
Calculations conducted by the author and represented in the previous table |
Calculations conducted by the author with the values representing 25 percent of the ones shown in the columns on the left side |
Not included because they are partly moved by the sails
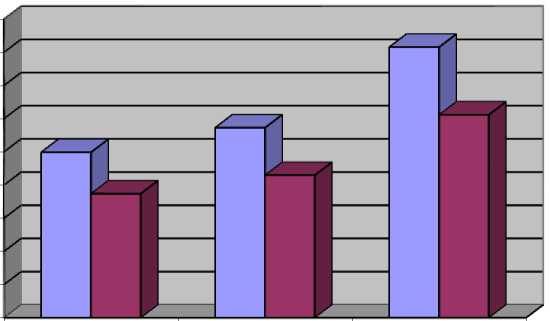
□ Annual CO2 emissions with bunker fuel
□ Annual CO2 emissions with LNG
2011 2012 2013
Even though we observe quite a significant reduction of carbon dioxide, Peters et al [9, 2011] provide quantitative evidence that the CO2 emissions in the Arctic are only a minor contributor to the thawing ice in the region and global warming, in general. In the opinion of the authors, this is primarily due to the fact that Arctic shipping constitutes only less than 5 percent of the global maritime transportation. Thus, even though regional traffic is growing mid- and low-latitude shipping is assumed to have a greater impact on high latitudes because of the Arctic amplification factor and oceanic oscillation10.
Similarly, nitrogen and sulfur oxides and soot emitted by vessels using bunker fuel are greatly reduced after the transition to LNG. In particular, Æsøy and Stenersen [10, 2013] provide evidence of 90-percent reduction of NOx and 95-percent reduction of SOx and black carbon (BC). As Winther et al [17, 2014] represent statistic data showing the emissions of each ship type of vessels per kg fuel, we can calculate the approximate annual emission for the high Arctic knowing the fuel consumption per day and the average distance of NSR and NWP in days:
According to NSRIO, it may take between 10 and 35 days to cross the NSR. Similarly, MacFarlane [15, 2013] mentions 15—35 days to cross the NSR. Thus, the average number of days used for crossing the NSR is 22.5, and the one for the NWP — 25.
According to Æsøy and Stenersen [10, 2013], the average emission of NOx per average shipping vessel is 96.2 g/kg fuel, whereas the emission of SOx — 31,5 g/kg fuel, and soot — 0.35 g/kg fuel.
Finally, average ship operating in the Arctic uses between 150 and 225 tonnes of fuel per day, making the average consumption 187.5 t/day.
Knowing these results we can calculate the average annual emission of each component using the following formulas:
|
NOx emissions in kg for the NSR |
_ Annual number of __ „ „ - ship cruises X 187 5 ^аУ X 22 5 X 1000 X 96.2 g/kg fuel |
|
SOx emissions in kg for the NSR |
_ Annual number of „ „ „ - ship cruises X 187"5 ^ X 22 5 X 1000 X 31.5 g/kg fuel |
|
BC emissions in kg forthe NSR |
■ Annual number of „ „ „ - shin cruises X 187.5 t/day X 22.5 X 1000 X 0.35 g/kg fuel |
|
NOx emissions in kg forthe NWP |
_ Annual number of „ „ „ - ship cruises X 187.5 t/day X 25 X 1000 X 96.2 g/kg fuel |
|
SOx emissions in kg for the NWP |
_ Annual number of „ „ „ - ship cruises X 187.5 t/day X 25 X 1000 X 31.5 g/kg fuel |
|
BC emissions in kg forthe NWP |
_ Annual number of - shin cruises X 187.5 t/day X 25 X 1000 X 0.35 g/kg fuel |
Table 5
|
Years |
Average annual emissions for the NSR (in kg) |
Average annual emissions for the NWP (in kg) |
||||
|
NOx |
SOx |
BC |
NOx |
SOx |
BC |
|
|
2011 |
16,639,593,750 |
5,448,515,625 |
60,539,062.5 |
3,156,562,500 |
1,033,593,750 |
11,484,375 |
|
2012 |
18,668,812,500 |
6,112,968,750 |
67,921,875 |
4,058,437,500 |
1,328,906,250 |
14,765,625 |
|
2013 |
28,814,906,250 |
9,435,234,375 |
104,835,937.5 |
3,607,500,000 |
1,181,250,000 |
13,125,000 |
|
Source |
Calculations conducted by the author using the formulas represented above |
|||||
Now, knowing the annual emissions for each route, we can deduce the joint one for the high Arctic (table 6).
Table 6
|
Average annual emissions for both routes (the NSR and the NWP) (in kg) |
|||
|
Years |
NOx |
SOx |
BC |
|
2011 |
19,796,156,250 |
6,482,109,375 |
72,023,437.5 |
|
2012 |
22,727,250,000 |
7,441,875,000 |
82,687,500 |
|
2013 |
32,422,406,250 |
10,616,484,375 |
117,960,937.5 |
|
Source |
Calculations conducted by the author represent a sum of annual emissions of each component for both routes |
||
As Æsøy and Stenersen [10, 2013] provide percentage of emission decrease for each pollu- tant, we can now represent the difference between using the bunker fuel and LNG (table 7).
Table 7
|
Years |
Average annual emissions for both routes with the use of residual oil (in kg) |
Average annual emissions for both routes with the use of LNG (in kg) |
||||
|
NOx |
SOx |
BC |
NOx |
SOx |
BC |
|
|
2011 |
19,796,156,250 |
6,482,109,375 |
72,023,437.5 |
1,979,615,625 |
324,105,468.75 |
3,601,171.875 |
|
2012 |
22,727,250,000 |
7,441,875,000 |
82,687,500 |
2,272,725,000 |
372,093,750 |
4,134,375 |
|
2013 |
32,422,406,250 |
10,616,484,375 |
117,960,937.5 |
3,242,240,625 |
1,621,120,312.5 |
5,898,046.875 |
|
Source |
Calculations of the average annual emissions for both routes with the use of LNG are conducted by the author through the deduction of the percentage of emission decrease in each pollutant represented by Æsøy and Stenersen [10, 2013] |
|||||
Graphically, the emission reduction through the use of LNG (represented in kg/year) is vivid:
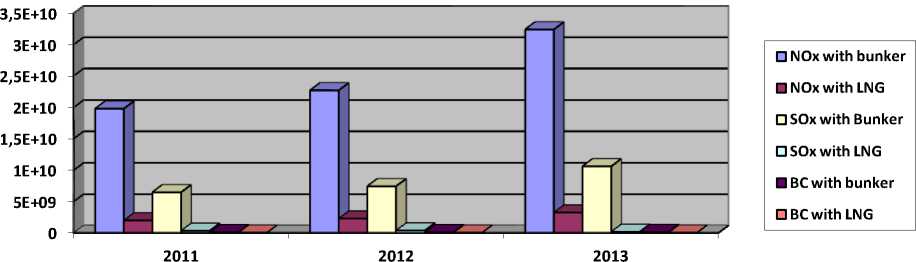
As we see, complete eradication of the bunker-fueled vessels and their replacement on the LNG-driven ones could have significantly influenced the environment. According to Peters et al [9, 2011], when mixing with seawater, carbon dioxide, nitrogen and sulfur oxides lower the pH diminishing the carbon-storage capacity. In the opinion of Woods Hole Oceanographic Institution (WHOI) 11, this not only leads to the acidification of the Arctic waters, but influences the aquatic life. Here, the plankton happens to be the most vulnerable species as the exoskeletons are not able to gain required hardness. In the Barents Sea lost survivability of plankton may lead to temporary increased stock of capelin spurring the breeding of herring and cod. In consecutive years, however, this may lead to the dramatic decrease in population of all of them.
At the same time, however, Peters et al [9, 2011] indicate sulfur and nitrogen oxides’ dispatch in the Arctic to be of minor importance because of the overall comparative insignificance of the current Arctic shipping. In this case black carbon in a form of soot happens to be the most crucial substance stimulating Arctic change. In particular, Sand et al [18, 2013], provide empirical evidence showing gradually decreasing albedo due to the sunlight attracted by soot dispersed on ice and snow. In this connection, increased marine traffic using conventional fuels will cause further ice and snow melt enhancing Arctic amplification.
Nevertheless, transition from residual oil to LNG solely for the Arctic transportation purposes is not sufficient for the overall win over warming Arctic — this is possible only if all other transportation vessels use this fuel on stable basis.
Implications for the Law of the Sea
United Nations Convention on the Law of the Sea of 1982 (UNCLOS) does not specifically regulate the issue of transition from bunker fuel to LNG. At the same time, however, Article 194 obligates all the states to prevent, reduce and control pollution of any source. More precisely, paragraph 3 of Article 194 urges the States to take measures in order to minimize ‘the release of toxic, harmful or noxious substances…’, and also ‘pollution from vessels...’ so that fragile and rare ecosystems can be preserved. This also relates to the design, construction and operation of maritime vessels. In this connection, transition from a less environmentally-friendly fuel (residual oil) to a more environmentally-friendly one (LNG) complies with the provisions of the basic document regulating maritime activity in the Arctic.
With respect to the attempts of addressing plausible Arctic pollution incidents, Jensen [19, 2008] refers to the International Convention for the Safety of Life at Sea to which specific amendments were proposed after the infamous case of Exxon Valdez. Even though these legal inclusions relate primarily to the hull-strengthening construction of the vessels operating in inhospitable waters the basic idea was transferred to the International Code for Ships Operating in polar Waters (Polar Code) adopted by the International Maritime Organization (IMO) 12.. Polar Code demonstrates succession from the UNCLOS since Section 8 of the latter relates to the ice-covered areas. In this sense Polar Code is a more specified document dealing with the Arctic maritime traffic as Article 234 of the UNCLOS only indicate the right of the coastal States to ‘adopt and enforce non-discriminatory laws and regulations from the prevention, reduction and control of marine pollution from vessels’.
Even though Polar Code was specifically designed to address the issues related to the Arctic shipping, it does not cover transition from bunker fuel to LNG. At the same time, however, Chapter 1 of the section called Pollution Prevention Measures indicates that any discharge of ‘oil or oily mixtures from any ship should be prevented’. This contingently stimulates flag States to LNG-propelled vessels because of their greater safety in this respect. Besides, Chapter 6 of the Polar Code urges all the machinery of the ships operating in the region to be capable of dealing with ice and snow acceleration. In this connection, Æsøy and Stenersen [10, 2013] mention specific features of LNG utilization such as cold temperatures which are favorable for its transportation etc. Hence, new fuel of such characteristics could be specifically suitable for the Arctic.
In sum, none of the currently existent international legal frameworks is capable of regulating global transition from residual oil to LNG. At the same time, however, such countries as Norway and Finland actively promoting this new propellant may cause a precedent urging new countries to follow the trend. With already-existent regulations of 17 July 2002 No. 644 on cargo ships with natural gas fueled internal combustion engines and of 9 September 2005 No. 1218 concerning construction and operation of gas-fueled passenger ships, Norway appears to be the leader in this trade.
If we represent the life cycle of this norm that might potentially become international in compliance with the concept of Finnemore and Sikkink [7, 1998], current interest of such countries as the US and Canada in building LNG-propelled vessels and relevant infrastructure (see: II.1. Implications for politics and economics) can be viewed as a start of ‘cascading’ before the final stage of ‘internalization’:
Internalization
'Norm cascade'
Norm emergence
USA Canada Sweden Denmark
Norway
Finland
Nevertheless, ultimate transition from bunker fuel to LNG for marine transportation in the Arctic does not seem to be possible without universal recognition of this propellant as the only one (perhaps apart from the nuclear fuel in case of icebreakers) eligible for utilization in the region — i.e. the final ‘internalization’ stage of the ‘norm lifecycle’. In the opinion of the author, in the current conditions of increasing Arctic shipping this can only become possible after the overall transition of the majority of maritime nations to the LNG-driven vessels so that norm becomes inherent to the local legal tradition. With relative scarcity of natural gas and its greatest deposits located in Russia – a country currently under the international sanctions — such ‘internalization’ does not seem to be a matter of the foreseeable future.
Conclusion
The current paper represented the attempt to examine plausible consequences of transition from bunker fuel — the main maritime propellant — to the LNG for marine transportation in the Arctic.
As it might reasonably seem, affirmative environmental effects happen to be some of the most important consequences. In particular, the transition from residual oil to gas will almost totally eliminate NOx and SOx as well as soot. Since the latter pollutant is assumed to be among the core hazards to the albedo in the Arctic, eradication of black carbon will significantly slow down Arctic amplification. In addition to that, CO2 emissions will also decrease by some considerable percent which is presupposed to be round a quarter of the current amount of carbon dioxide emissions faced in the region these days.
At the same time, however, black carbon is assumed to be the key substance the elimination of which will have its significant say in terms of improving Arctic environment to some important extent since the remaining substances (CO 2 , NOx and SOx) do not have that fast ecologic effect in the region because of their lesser comparative amount being dispersed in the atmosphere over there. Indeed, comprehensive move from bunker fuel to LNG seems to be the only means to get a global impact on that problem as ocean waters and air masses can transport these pollutants from lower latitude towards the Arctic much more effectively than e.g. soot.
Apart from predictable positive effects on environment, such a shift may also have significant consequences for political and legal spheres:
In particular, through the implementation of the EKC the study demonstrated the key interest groups of the Arctic states benefiting from such a transition. Here, the concept of regime effectiveness and benign interdependence augmented niche-selection approach. As the research demonstrates, Norway — the resource-, technology-, and infrastructure-possessing party happens to be the country taking the greatest advantages from the transition to LNG than the rest of the Arctic nations. For example, Iceland and Russia currently developing their infrastructure and experiencing technology insufficiencies may greatly benefit when following the path of Norway even when this path does not seem to be completely feasible for the former. On the other hand, however, Canada and the US appear to be the runners-up gradually building-up their technology and infrastructure potential and definitely possessing sufficient resources.
In general, the situation when some countries boast technological know-how ready to be exported whereas others are eager to sell resources is ideal for the formation of benign interdependence when mutually-beneficial cooperation drives the progress of each of the participants. Here, Norwegian technological support could potentially augment Russian to-be-built LNG industry. At the same time, however, in the current conditions of international tensions between Russia and the West, such a benign interdependence does not seem to be possible at the moment.
Finally, the legal dimension of the transition from bunker fuel to LNG does not happen to be elaborated to the extent directly regulating this process and all its implications. In particular, neither UNCLOS nor Polar Code — i.e. none of the core documents addressing marine transportation in the Arctic — deals with any specific fuel-related prescriptions that could be potentially in- terpreted as those relating to the use of LNG. On contrary, partially covering fuel and environmental safety issues they address the problems of spills basically viewing residual oil as the main propellant. In this connection, newly-elaborated and adopted international norms will have to view pollution not related to spills in greater detail. Apart from that, the very specific type of LNG-fuelled vessels should get its reflection in the international law. In this context, Norway being the pioneer in adopting legal documents regulating LNG-fuelled vessels with its regulations No. 644 and No. 1218 may serve as an example and instigator for the consecutive ‘norm cascade’ and ‘internalization’ by the remaining Arctic nations and the rest of the world.
References Implications of the use of liquefied natural gas for marine transportation in the Arctic
- Beitler J Arctic sea ice extent settles at record seasonal minimum. Available at: http://nsidc.org/arcticseaicenews/2012/09/arctic-sea-ice-extent-settles-at-record-seaso-nalmini-mum/ (Accessed: 19 September 2012).
- Schøyen, H., Bråthen, S. The Northern Sea Route versus the Suez Canal: Cases from bulk shipping, Journal of Transport Geography, 2011, 19 (4), pp. 977—983.
- Ragner, C.L. The Northern Sea Route. In: Hallberg, T. ed. Barents — ett gränsland i Norden.Stockholm: Arena Norden,2008. pp. 114—127.
- Humpert, M. The Future of Arctic Shipping: A New Silk Road for China? Available at: http://www.thearcticinstitute.org/2013/11/the-future-of-arctic-shipping-new-silk.html (Accessed:19 July 2015).
- Miller D. WWF study supports to phase out use of heavy fuel oil for Arctic shipping. Available at: http://wwf.panda.org/?247494/WWF-study-sup-ports-need-to-phase-out-use-of-heavy fueloil-for-Arctic-shipping (Accessed: 17 July 2015).
- Stokke O.S. Regime Interplay in Arctic Shipping Governance: Explaining Regional Niche Selection, International Environmental Agreements: Politics, Law and Economics, 2013. 13 (1), pp. 65—85.
- Finnemore M., Sikkink, K. International Norm Dynamics and Political Change, International Organization, 1998. No. 52 (4), pp. 887—917.
- Saboori B., Sulaiman J. Environmental Degradation, Economic Growth and Energy Consumption: Evidence of the Environmental Kuznets Curve in Malaysia, Energy Policy, 2013. No. 60 (3), pp. 892—905.
- Peters G.P. et al Future emissions from oil, gas, and shipping activities in the Arctic, Atmospheric Chemistry and Physics Discussions, 2011. No. 11 (2), pp. 4913—4951, DOI: 10.5194/acpd-11-4913-2011 (Accessed: 24 July 2015).
- Аsøy V., Stenersen, D. Low Emission LNG Fuelled Ships for Environmental Friendly Operations in Arctic Areas. In Proceedings of the International Conference on Offshore Mechanics and Arctic Engineering, Nantes, France, 9—14 June 2013. Trondheim, Norway: MARINTEK.
- Brenntrø J., Garcia Agis J.J., Thirion, A. Use of LNG in the Maritime Transport Industry. Available at: http://www.ipt.ntnu.no/~jsg/undervisning/naturgass/oppgaver/Oppgaver-2013/13Brenntroe.pdf (Accessed: 26 July 2015).
- Jónsdóttir G.J. (2013) LNG as a ship fuel in Iceland, Dissertation (MA), Reykjavik University, Skemman. Available at: http://skemman.is/stream/get/1946/16103/37689/1/LNG_as_a_ ship_fuel_in_Iceland.pdf (Accessed: 28 July 2015).
- Paltsev S. Scenarios for Russia’s natural gas exports to 2050, Energy Economics, 2014. No. 42 (3), pp. 262—270.
- Russia as a Natural Gas Supplier to the Asia-Pacific Region: A Conversation with Dr. Michael Bradshaw. Available at: https://www.asiapacific.ca/blog/russia-natural-gas-supplier-asia-pacific-region-conversation (Accessed: 28 July 2015).
- MacFarlane J.M. A List of the Full Transits of the Canadian Northwest Passage. Available at: http://nauticapedia.ca/Articles/NWP_Fulltransits.php (Accessed: 24 July 2015).
- Headland R.K. Transits of the Nortwest Passage top the end of the 2012 navigation season recorded by R.K: Headland. Available at: http://northwestpassage2013.blogspot.no/2013/05/transits-of-northwest-passage-to-end-of.html (Accessed: 29 July 2015).
- Winther M., et al. Emission inventories for ships in the Arctic based on satellite sampled AIS data, Atmospheric Environment, 2014.No. 91 (4), pp. 1—14.
- Sand M., Berntsen T.K., Seland O., Kristjansson J.E. Arctic surface temperature change to emissions of black carbon within Arctic or midlatitudes. Journal of geographical research: Atmospheres, 2013. No. 118 (14), pp. 7788—7798.
- Jensen Ø. Arctic shipping guidelines: Towards a legal regime for navigation safety and environmental protection? Polar record, 2008. No. 44 (229), pp. 107—114.
