Improved K-means Clustering based Distribution Planning on a Geographical Network

Author: Manju Mam, Leena G, N S Saxena
Journal: International Journal of Intelligent Systems and Applications(IJISA) @ijisa
Article in issue: 4 vol.9, 2017.
Free access
This paper presents a distribution planning on a geographical network, using improved K-means clustering algorithm and is compared with the conventional Euclidean distance based K-means clustering algorithm. The distribution planning includes optimal placement of substation, minimization of expansion cost, optimization of network parameters such as network topology, routing of single/multiple feeders, and reduction in network power losses. The improved K-means clustering is an iterative weighting factor based optimization algorithm which locates the substation optimally and improves the voltage drop at each node. For feeder routing shortest path based algorithm is proposed and the modified load flow method is used to calculate the active and reactive power losses in the network. Simulation is performed on 54 nodes based geographical network with load points and the results obtained show significant power loss minimization as compared to the conventional K-means clustering algorithm.
Distribution planning, kmeans, geographical network, modified load flow, improved kmeans, clustering, feeder routing
Short address: https://sciup.org/15010923
IDR: 15010923
Text of the scientific article Improved K-means Clustering based Distribution Planning on a Geographical Network
Published Online April 2017 in MECS
Automated distribution system expansion planning is an active field of research and attracted attention of researchers in the last decade. Switching to automated system due to various reasons has led to various benefits, like minimization of expansion cost, optimal placement of distribution system, and reduction in system’s failures/faults. The planning includes optimal routing of single/multiple feeders, optimize network design parameters such as network topology, branch conductor size and the reserve location for future placement of substations. The significant part of the investment cost is closely related to the size of the substation, length of feeder, losses in the network, and voltage drop subject to the distance between substation and the loads.
In this paper a new distribution system planning algorithm is developed to meet the following objectives:
-
1. Optimal placement of substation
-
2. Optimization of feeder length
-
3. Power loss minimization and
-
4. Voltage drop improvement
Improved K-means clustering algorithm is developed for the optimal placement of substation as well as to improve the voltage drop and is compared with the conventional K-means clustering algorithm. A new shortest path based feeder routing algorithm is proposed to optimize the feeder length while modified load flow method proposed by Das et. al. [1] is used to calculate the power losses in the network. The structure of the paper is organized as follows: Section II presents the related work, Conventional K-means clustering algorithm is presented in section III, while the improved K-means clustering algorithm is discussed in the section IV. Section V describes the process to find the optimal location of substation. Modified load flow method is presented in section VI. Section VII deals with the shortest path based single/multiple feeder routing algorithm. Results and discussions are presented and described in section VIII. Section IX contains the conclusion while references are provided at the end.
-
II. Related Work
Various approaches have been proposed in the past by researchers and scientists to:
-
1. Minimize the expansion cost
-
2. Place the substation optimally and,
-
3. Protect the system from failures.
In 1991 the method proposed by Ramirez-Rosado and T. Gonen [2] used the concept of pseudo dynamics to expand the power distribution systems. The method uses minimization of non-linear optimization problem to meet the objective. In the same year Nara and team [3] has developed a multi-year expansion planning model for distribution systems. The method uses decomposition algorithm based on branch exchange method in which n-years planning problem is decomposed into one-year planning problem, and one-year results are coordinated through.
In the previous decade, efforts have been made on multistage expansions like cost and complexity analysis when execution is performed at once and when performed in phase wise manner (5/10/20 years). Multistage problem is addressed by Ranjan et. al [4] in 2002 and Vaziri et. al [5] in 2004. A generalized optimization framework is designed by Ranjan to address the issue of substation planning, expansion cost, and optimal selection of branch conductor. The optimization framework incorporates heuristic rules and modified load flow [1], while the method presented by Vaziri used graph theory and numeral analysis technique to solve the complex mathematical non-linear optimization problem.
Many researches have been performed in the current decade to minimize the investment cost while considering the system security. A weighted K-means clustering method is developed by Peng and Liu [6] in 2009. The author’s goal is to minimize the investment cost while the system is protected by dividing the load points into small clusters. In 2010 Ouyang et. al [7] presented the concept of integration of distributed generation (DG) for distribution network planning. The author’s goal for the integration of DG is to cut the peak load to minimize the cost as well as to improve the efficiency of the network. Low utilization efficiency generally occurred during peak load in conventional distribution network which resulted in high risk and high investment. Later some mathematical models have been proposed by some researchers to solve distribution substation planning such as integer linear programming, mixed integer non-linear programming, and network flow programming.
C=∑ i=l ∑ Xj ∈ Di ( Xj -μ I )(1)
Where,
N is number of clusters
D[ is the data points in ith cluster and,
µ I is the mean point of centroid of all data points Xj ∈ D[ .
K-means clustering divides the complete data into N clusters either randomly or by using some pre-defined centers. After it calculates the mean of all data to find the centroid of each cluster set. Then the centroids are recalculated using the equation (2) and it repeats until the convergence criteria is met (i.e. centroid does not change).
m =∑ Xj ∈ Di | Б! | (2)
-
IV. Improved K-Means Clustering Algorithm
As discussed above that K-means forms the clusters on the basis of distance. Loads at nodes points are also an important factor in distribution network planning and plays a crucial role in minimizing the power losses in the system. In order to prioritize the load points, load weight factors ( wfj ) are given to all data points. The load weight factor is calculated by the iterative process and taken as 2.5% of the node’s load if the node’s load is greater than or equal to the mean of all loads. On the other hand, the load weight factor is taken as 2.8% of node’s load. The new objective for improved K-means clustering algorithm is given as:
C=∑ 1=1 ∑ Xj ∈ DtWfj ( Xj -μ i ) (3)
The centroid will be calculated from the following equation:
∑ WfjX£
∑ ∈ ^i | Dj | = ∑ Xj ∈ Dtwfj
-
III. K-Means Clustring Algorithm
Clustering technique is required in many different applications, such as data mining and knowledge discovery [8], pattern classification and recognition [9], and data compression and vector quantization [10]. K-means clustering is a simple and well known clustering algorithm and is closely related to number of other clustering and location problems [11]. K-means is more efficient and unsupervised learning algorithm for classifying observed data. Euclidean distances is the main factor in evaluating the distance between different points and are then grouped into clusters. In K-means clustering it assumes that object attributes are from a vector space [6]. The objective is to minimize the squared error function or total intra cluster variance as given in the equation below:
-
V. Optimal Location Placement Based on K-Means and Improved K-Means
Substation optimal location placement is a highly complex and challenging task. The capacity load, annual load growth as well as distance of load points from substation are an important factor in distribution network planning and play a crucial role in minimizing the power losses in the system. Author [4] considered the power loss minimization objective to find the optimum location of substation while Peng et. al [6] considered the weight factors to model their algorithm. Annual growth factor is an important aspect of future planning, hence annual growth factor, capacity load, distance between load points, and power loss minimization is considered in this paper. The algorithm has been applied on a system having 54 nodes points with geometric as well as load information [4]. In order to get the optimal substation location, the improved K-means algorithm runs iteratively varying weights. The location which gives minimum power loss is considered as best location. Complete approach is discussed in the algorithm below.
-
1. Initialize the network data
-
2. Randomly initialize the load weight factor
-
3. Calculate the annual load growth
-
4. while |P I о ss(i) - PI о ss( i - 1)| < to I er ance
wf =rand ();
ALG=L o ad x (1 + g )£
-
i. Calculate location using Improved K-means
clustering algorithm
-
ii. Compute the Power loss using load flow
method (Section V)
-
iii. w/=rand ();
-
5. Store the best location for t
-
6. Compute mean for optimal location of substation
Where, w= = load weight factor rand () = uniformly distributed random number between 0 and 1
PIoss (i) = System power loss at i th iteration to lerance = 0.001
ALG = Annual load growth g = 7% annual growth rate t = number of years (0, 1, 2, 3, ..., N)
-
VI. Modified Load Flow Method
Generally, the distribution networks are radial and have high ^ ratio. Due to high ^ ratio conventional load flow methods like Newton-Raphson [12-15] and fast decoupled (FD) load flow method gives inefficient result. Das [1] proposed a simple and efficient method for load flow solution of radial distribution network. If the voltage difference at every node in successive iteration is less than 0.0001 p.u. then the algorithm will be considered as converged. The solution methodology of the modified load flow method is as follows:
0.5|l-Ч1)|2)2 -
(R
2(1) + X 2(1))(P2(2) +
Q
2(2))]= -№(1) + Q(2)X(1) - 0.5|У(1)|2)} V 2 (7)
P (2) - j Q(2) = 7 * (2)I(1) (6)
From equation (5) and (6) |V(2)| is calculated as:
|У(2)| =[[(^Ч2Ж1) + Q(2Ж1)-
Where P (2) and Q (2) are total real and reactive power loads fed through node 2.
P (2) = sum of the total real power loads of all the nodes beyond node 2 plus the real power load of node 2 itself plus the sum of the real power losses of all the branches beyond node 2.
Q (2) = sum of the reactive power loads of all the nodes beyond node 2 plus the reactive power load of node 2 itself plus the sum of the reactive power losses of all the branches beyond node 2.
Equation (7) can be written in generalized form as:
Rm2)| = [BQ)-Л^')]1/2(8)
Where,
Л(j) = P(m2) * R(j) + Q(m2) * X(/) - 0.5 * |K(m1)|2(9)
Table 1. Branch number, sending nodes and receiving nodes of above figure
|
Branch Number |
Sending end node |
Receiving end node |
Branch Number |
Sending end node |
Receiving end node |
|
1 |
1 |
2 |
8 |
6 |
7 |
|
2 |
2 |
3 |
9 |
6 |
8 |
|
3 |
3 |
4 |
10 |
3 |
11 |
|
4 |
4 |
5 |
11 |
11 |
12 |
|
5 |
2 |
9 |
12 |
12 |
13 |
|
6 |
9 |
10 |
13 |
4 |
14 |
|
7 |
2 |
6 |
14 |
4 |
15 |
В (/) = [Лл2 (j ) - [RA2 (j ) + Хл2 (j )] x [Рл2 (m2) +
QЛ2 (m2)]}1/2(10)
j is the branch number, m1 and m2 are sending-end and receiving-end nodes respectively (m1 = IS(/) and m 2 = IR(/)).
Real and reactive power losses in branch 1 can be given by:
ШМ^РО+О^Р)]
( ) I^C2)|2 ( )
a)*^^)^^2)]
Q ( ) |y(2)| 2 ( )
I (1) =
|y(1)|zS(1)-|y(2)|zS(2) R (l)+]X(l)
Above equations can also be written in generalized
form as:
(j)*[P 2 (m2)+ Q2 (m 2)]
|V(m2 )|2
(j)*[P 2 (m2)+Q2 (m 2)] |V(m2 )|2
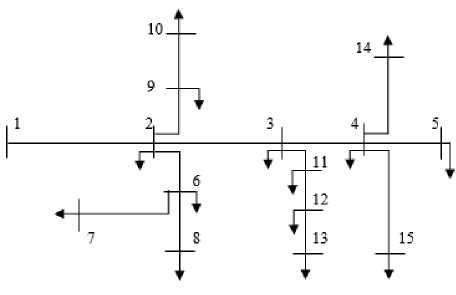
Fig.1. Single line diagram of existing distribution system
1^ 1 15 1 К 1) ^ l^ 2 l» 2
R (D+jX( 1)
Fig.2. Electrical equivalent of Fig 1
P (2), Q (2)
VII. Feeder Routing Using Shortest Path Based Algorithm
The main objective of feeder routing is to minimize the feeder length in order to decrease the cost and to minimize the losses. Resistance (R) and reactance (X) will be required to calculate the power losses in a network. Since R and X is closely dependent on distance as can be seen from the table 2, hence shortest distance based path selection is used to route the feeder throughout the network. Any load point at geometric position X and Y will be connected to its neighbor having minimum distance from the load point. Since the feeder will emerge from the substation so it will find the best neighbor on the basis of distance, and this neighbor will search for another. Once more than 1 node is connected then the node having minimum distance from any one of the connected nodes will be selected for further routing. Suppose we have 10 nodes and a substation as shown in the figure (3) then the substation will be connected to the node having minimum distance from the substation i.e. node 6. Next the node 6 will follow the same process and search its best i.e. node 2. While in the next step both the nodes 6 and 2 will search for the best node and will be connected to node 10 which is best for node 6 and so on. The connection is shown in the figure (4). At the end direction of connections will be stored in a matrix for load flow analysis.
Table 2. Technical information of conductors [18]
|
Conductor Type |
Cross Section ( m m2) |
Resistance () W |
Reactance (—) |
Price (—) vkm/ |
Max Current (Amp.) |
|
Squirrel |
12.9 |
1.376 |
0.3896 |
10^7 |
80 |
|
Weasel |
19.35 |
0.9108 |
0.3797 |
1.2x10^7 |
100 |
|
Rabbit |
32.26 |
0.5441 |
0.3673 |
1.5x10^7 |
120 |
|
Raccon |
48.39 |
0.3657 |
0.3579 |
1.7x10^7 |
150 |
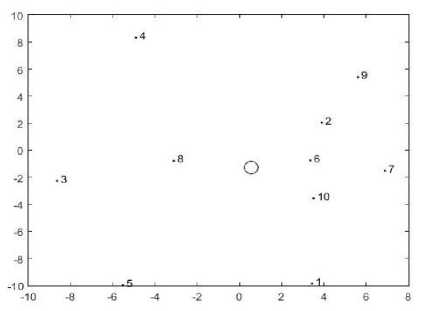
Fig.3. Examples test system having 10 nodes and a substation before connection
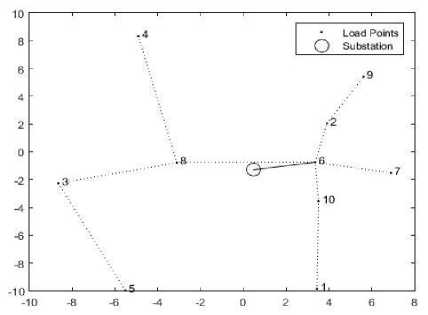
Fig.4. Examples test system having 10 nodes and a substation after connection
-
VIII. Results and Discussion
As discussed above the investment cost is directly proportional to length and power losses in the system. Length based shortest path algorithm is developed in order to minimize the power losses as well as the investment cost. In this paper 10 years of planning, single, and multiple feeder routing are considered. 7% of the annual growth factor is considered to model the 10 years of planning and can be achieved by the equation (15)
L о ad x (1 + g )£ (15)
The description of the terms used in the equation (15) are given in the improved K-means section. Power loss is calculated using the modified load flow method. Table 4
contains 54 nodes based geographical network with load points for the simulation and analysis purposes [13].
Case I. Single feeder routing and substation placement in initial phase:
In the initial phase only one feeder will emerge from the substation and route throughout the network. The routing will be performed according to shortest path based routing algorithm described in the feeder routing section. Optimal location of substation with single feeder routing with improved K-means and K-means clustering are shown in the figure (5) and figure (6). Total feeder length, active, and reactive power losses are obtained by applying modified load flow method. After modified load flow the results obtained by using both improved K-means and K-means clustering are shown in the Table 3.
Table 3. Substation location, feeder length, active, and reactive power losses in initial phase
|
Substation location |
Total feeder length (in KM) |
Active power loss (in kW) |
Reactive power loss (in kVAr) |
Algorithm |
|
|
X |
Y |
||||
|
9.0849 |
11.1226 |
98.5277 |
158.7545 |
44.9497 |
K-means clustering |
|
9.5874 |
11.6523 |
98.5814 |
11.6503 |
3.2987 |
Improved K-means clustering |
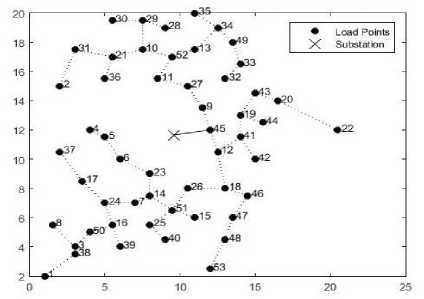
Fig.5. Substation placement and single feeder routing using improved K-means clustering
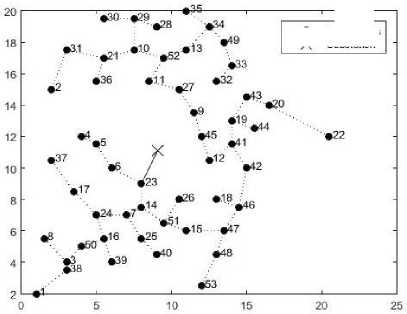
Fig.6. Substation placement and single feeder routing using K-means clustering
|
• |
Load Points |
|
x |
Substat ton |
Table 4. 54 nodes data points
|
Node Number |
X Coordinate |
Y Coordinate |
Load (kVA) |
|
1 (Substation) |
To be obtained |
To be obtained |
|
|
2 |
1 |
2 |
25 |
|
3 |
2 |
15 |
25 |
|
4 |
3 |
4 |
25 |
|
5 |
4 |
12 |
50 |
|
6 |
5 |
11.5 |
63 |
|
7 |
6 |
10 |
63 |
|
8 |
7 |
7 |
50 |
|
9 |
1.5 |
5.5 |
25 |
|
10 |
11.5 |
13.5 |
16 |
|
11 |
7.5 |
17.5 |
16 |
|
12 |
8.5 |
15.5 |
25 |
|
13 |
12.5 |
10.5 |
50 |
|
14 |
11 |
17.5 |
63 |
|
15 |
8 |
7.5 |
63 |
|
16 |
11 |
6 |
25 |
|
17 |
5.5 |
5.5 |
16 |
|
18 |
13.5 |
8.5 |
16 |
|
19 |
13 |
8 |
16 |
|
20 |
14 |
13 |
63 |
|
21 |
16.5 |
14 |
25 |
|
22 |
5.5 |
17 |
25 |
|
23 |
20.5 |
12 |
50 |
|
24 |
8 |
9 |
100 |
|
25 |
5 |
7 |
100 |
|
26 |
8 |
5.5 |
100 |
|
27 |
10.5 |
8 |
50 |
|
28 |
10.5 |
15 |
50 |
|
29 |
9 |
19 |
25 |
|
30 |
7.5 |
19.5 |
63 |
|
31 |
5.5 |
19.5 |
63 |
|
32 |
3 |
17.5 |
25 |
|
33 |
13 |
15.5 |
50 |
|
34 |
14 |
16.5 |
50 |
|
35 |
12.5 |
19 |
25 |
|
36 |
11 |
20 |
25 |
|
37 |
5 |
15.5 |
50 |
|
38 |
2 |
10.5 |
50 |
|
39 |
3 |
3.5 |
63 |
|
40 |
6 |
4 |
25 |
|
41 |
9 |
4.5 |
25 |
|
42 |
14 |
11.5 |
50 |
|
43 |
15 |
10 |
50 |
|
44 |
15 |
14.5 |
25 |
|
45 |
15.5 |
12.5 |
25 |
|
46 |
12 |
12 |
63 |
|
47 |
14.5 |
7.5 |
63 |
|
48 |
13.5 |
6 |
25 |
|
49 |
13 |
4.5 |
16 |
|
50 |
13.5 |
18 |
16 |
|
51 |
4 |
5 |
25 |
|
52 |
9.5 |
6.5 |
16 |
|
53 |
9.5 |
17 |
25 |
|
54 |
12 |
2.5 |
50 |
Case 2: Triple feeder routing after 10 years
After 10 years’ substantial amount of load will increase in the network and thus single/double feeders fail to fulfil the demand economically. In order to fulfil the demand economically more than two feeders will be required because total active and reactive power losses will increase up to 496.88% in K-means clustering while 453.31% in improved K-means clustering with single feeder. While in the case of double feeders the amount will increase up to 301.37% in K-means clustering while 275.149% in improved K-means clustering. In this case triple feeders are routed to minimize the active and reactive power losses in the network. The results thus obtained after load flow analysis for both the improved K-means and K-means clustering are shown in the Table 5. Triple feeder routing for both the cases are shown in the figure (7) and figure (8).
Table 5. Substation location, feeder length, active, and reactive power losses after 10 years
|
Substation location |
Total feeder length (in KM) |
Active power loss (in kW) |
Reactive power loss (in kVAr) |
Algorithm |
|
|
X |
Y |
||||
|
9.0849 |
11.1226 |
100.0692 |
67.5037 |
19.1130 |
K-means clustering |
|
9.5874 |
11.6523 |
100.2011 |
55.1342 |
15.6107 |
Improved K-means clustering |
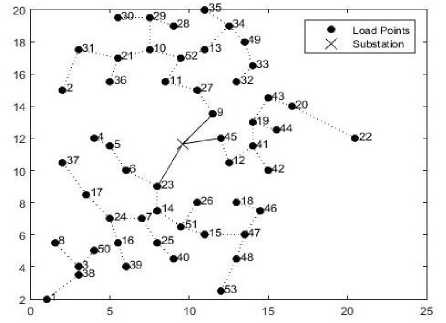
Fig.7. Triple feeder routing using improved K-means clustering

Fig.8. Triple feeder routing using K-means clustering
-
IX. Conclusion
References Improved K-means Clustering based Distribution Planning on a Geographical Network
- Das D, Kothari D P, Kalam A. Simple and efficient method for load flow solution of radial distribution networks. 1995:17(5):335-346
- Ramirez-Rosado I.J, Gonen T. Pseudo dynamic Planning for Expansion of Power Distribution Systems. IEEE Trans. on Power Systems. 1991:6(1):245-254
- Nara K, Satoh T, Aoki K, Kitagawa M, Yamanaka M. Multi-Year Expansion Planning for Distribution Systems. IEEE Trans. on Power Systems. 1991:6(3):952-958
- Ranjan R, Venkatesh B, Das D. A new algorithm for power distribution system planning. Electric Power System Research. 2002:62:55-65
- Vaziri M, Tomsovic K, Bose A. Numerical Analyses of a Directed Graph Formulation of the Multistage Distribution Expansion Problem. IEEE Trans. on Power Delivery. 2004:19(3):1348-1354
- Peng W, Liu W. A new method for substation planning problem based on weighted K-means. Conference: Advances in Neural Networks. 2009
- Ouyang W, Cheng H, Zhang X, Yao L. Distribution network planning method considering distributed generation for peak cutting. Energy Conversion and Management. 2010:51(12):2394-2401
- U.M. Fayyad, G. Piatetsky-Shapiro, P. Smyth, and R. Uthurusamy, Advances in Knowledge Discovery and Data Mining. AAAI/MIT Press, 1996.
- R.O. Duda and P.E. Hart, Pattern Classification and Scene Analysis. New York: John Wiley & Sons, 1973.
- A. Gersho and R.M. Gray, Vector Quantization and Signal Compression. Boston: Kluwer Academic, 1992.
- Kanungo D., Mount D. M., Netanyahu N. S., Piatko C.D., Silverman R., Wu A.Y. An efficient k-Means clustering algorithm: Analysis and implementation. 2002:24(7):881-892
- Tinney W F, Hart C E. Power flow solution by Newton's method. IEEE Trans. on PAS. 1967:PAS-86(11):1449-1460
- B Stott, Alsac O. Fast decoupled load flow. IEEE Trans. on PAS. 1974:PAS-93(3):859-869
- Stagg G W, El-Abiad A H. Computer methods in power system analysis. 1968 Tata McGraw Hill
- Nagrath I.J, Kothari D.P. Modern power system analysis. 1989 2nd edition Tata McGraw Hill
- Kalesar B.M, Seifi A.R. Optimal substation placement and feeder routing in distribution system planning using genetic algorithm. Elixir Elec. Engg. 2011:37:3908-3915
