Improving Boiler Performance Using Machine Learning: A Predictive Approach to Steam Demand Optimization

Author: Hermanus M. Scholtz, Hadi Harb
Journal: International Journal of Intelligent Systems and Applications @ijisa
Article in issue: 6 vol.17, 2025.
Free access
This paper explores the application of machine learning to enhance boiler efficiency and cost management at a Uranium Mine in Africa. The current steam control system relies on a feedforward loop, which adjusts based on slurry flow into the leach tank, and a feedback loop, which regulates steam to a setpoint. However, this method is inefficient, as it does not account for slurry temperature variations, leading to unstable control and suboptimal steam usage. To address these limitations, this study applies the Extra Trees algorithm to predict steam demand more accurately. The data-driven approach achieves a 6.6% reduction in steam consumption and a 2% decrease in heavy fuel oil (HFO) usage, resulting in cost savings and improved sustainability. Based on multiple evaluation metrics, the Extra Trees model proved to be the most accurate and consistent algorithm, achieving a 96.67% R-squared score and a Root Mean Square Error (RMSE) of 1131.37 kg, indicating minimal deviation between actual and predicted values. The findings highlight the shortcomings of traditional control strategies under fluctuating conditions and demonstrate how advanced feature engineering enhances predictive accuracy. By integrating machine learning into operational workflows, this research provides actionable insights to improve boiler performance, process stability, and overall efficiency.
Steam Predictions, Machine Learning, Data Driven Approaches, Boiler Efficiency, Extra Trees
Short address: https://sciup.org/15020098
IDR: 15020098 | DOI: 10.5815/ijisa.2025.06.01
Text of the scientific article Improving Boiler Performance Using Machine Learning: A Predictive Approach to Steam Demand Optimization
Published Online on December 8, 2025 by MECS Press
Industrial boilers play a pivotal role in mining operations, serving as a backbone for critical processes that require precise temperature control and continuous heat supply. At this Uranium mine, the process demands an uninterrupted supply of 25,000 kg of steam at 180°C to maintain operational efficiency, particularly in heating slurry before it is transferred to the Counter Current Decantation (CCD) section. This demand is met by three industrial boilers, each with a capacity of 16 tons per hour, designed to sustain leach tank temperatures at 90°C over a 36-hour cycle to optimize uranium extraction. However, the existing steam supply system suffers from inefficiencies due to poor demand forecasting and outdated control mechanisms, which rely on feedforward and feedback control, leading to excessive heavy fuel oil (HFO) consumption and increased operational costs.
The challenges are exacerbated by ambient temperature fluctuations, which impact the process's thermal stability. The current feedforward/feedback-loop-based steam control model adjusts steam flow solely to maintain the leach temperature at a setpoint while the feedforward loop adjust steam based on the slurry mass flow into the process circuit, disregarding the dynamic and predictive aspects of steam demand. This lack of foresight results in boilers operating in a suboptimal "always-on" mode to mitigate sudden demand spikes, further escalating fuel usage and emissions. Compounding these inefficiencies is the limited control over the heat recovery process, which recovers approximately 40°C from the heated slurry but fails to operate at its full potential.
With HFO consumption accounting for approximately 15% of the mine's operational expenses and daily fuel usage ranging between 25,000 to 60,000 liters, optimizing boiler efficiency is imperative. Accurate steam demand forecasting can enhance operational efficiency, reduce environmental impact, and contribute to significant cost savings. This paper addresses these critical gaps by leveraging machine learning techniques to predict steam demand accurately, enabling informed decision-making and optimizing boiler performance.
This study focuses on evaluating the steam demand required for the process. By analyzing existing steam control models, this research aims to identify inefficiencies that compromise reliability and long-term performance. A key aspect of this study is the application of machine learning techniques to predict and regulate steam demand, ensuring a more stable and optimized supply. By accurately forecasting future steam requirements, machine learning-driven strategies can enhance boiler operations, improve energy efficiency, reduce costs, and strengthen process stability. Managing steam demand effectively will lead to a more responsive and efficient boiler system, minimizing unnecessary fluctuations and ensuring a balanced supply-demand relationship. This research ultimately seeks to integrate data-driven approaches to enhance decision-making, sustainability, and overall operational effectiveness in industrial mining processes.
Lastly this paper is structured to provide a comprehensive analysis of boiler efficiency optimization using machine learning. The Introduction outlines the critical role of boilers in mining operations, with a focus on the Uranium Mine, and highlights the challenges in steam demand management due to outdated control mechanisms. The Literature Review explores previous research on machine learning applications in energy optimization, comparing various predictive models and their effectiveness in industrial settings. The Methodology section details the process description, feature selection, model training, and validation approach, emphasizing the selection of the Extra Trees algorithm for steam demand prediction. The Results present an in-depth analysis of model performance, comparing predicted steam demand with actual and theoretical values while assessing cost savings through reduced heavy fuel oil (HFO) consumption. The Discussion and Conclusion synthesize the key findings, underscoring the advantages of machine learning in predictive steam management and suggesting future enhancements to improve stability and broader applicability in industrial processes
2. Literature Review
Machine learning approaches have demonstrated significant potential in predicting energy consumption and improving operational efficiencies in various industries. Notable studies have showcased the capabilities of diverse models in accurately forecasting demand, optimizing resource use, and reducing environmental and operational costs.
Gradient Boosting Machines (GBMs) have been particularly effective in predicting steam consumption. One study [1] achieved an impressive R² accuracy of 98%, enabling the prediction of annual steam consumption with potential energy savings equivalent to 24,000 metric tons of steam. This underscores the model's capacity to enhance energy efficiency by providing precise consumption forecasts.
Another approach, the Adaptive Neuro-Fuzzy Inference System (ANFIS) with Gaussian membership functions, was employed to predict hour-ahead natural gas consumption at a city scale [2]. Incorporating variables such as weather data and lower calorific gas values, the model achieved a Coefficient of Determination (R²) of 0.99 and Mean Absolute Percentage Errors of 3.0% and 3.4%. These results highlight ANFIS's reliability and precision in managing complex, dynamic systems with both heating and non-heating regimes.
The Gaussian Process-Partial Least Squares (GP-PLS) method has proven adept at addressing the stochastic and multidimensional nature of large-scale industrial datasets [3]. This approach combines nonlinear modeling with intelligent data selection, resulting in accurate energy efficiency predictions and enhanced process optimization in chemical plants. The GP-PLS method's ability to identify key variables and improve data quality offers significant contributions to energy savings and operational improvements.
In another study, three machine learning methods were tested to predict VHP steam pressure in petrochemical facilities [4]. The Radial Basis Function (RBF) model emerged as the most accurate, achieving an R² value of 99.33% and an Average Absolute Relative Deviation (AARD) of 0.11%. Sensitivity analyses confirmed the model's robustness in forecasting steam pressure under varying operational conditions.
Artificial Neural Networks (ANNs), such as the three-hidden-layer neural network (40, 30, 20 neurons per layer), were utilized to study the effects of CO₂ and n-butane addition to steam in Steam Assisted Gravity Drainage (SAGD) systems [5]. The neural network accurately predicted oil recovery (R² = 0.98) and cumulative steam-oil ratio (R² = 0.95), demonstrating its effectiveness in optimizing resource utilization and reducing steam consumption in oil recovery processes.
A novel Multi-Layer Perceptron (MLP) ensemble method was tested for steam load forecasting [6]. By combining boosting tree techniques with correlation matrices, the study demonstrated the ensemble's superiority in predicting steam load during heating seasons, although cooling season accuracy was affected by limited data. The study suggested that operational improvements and enhanced data integration could further refine the model.
In the context of solar steam generation, a comparative study evaluated multiple machine learning models, including Decision Tree (DT), Support Vector Regression (SVR), and hybrid approaches [7]. The DT model exhibited exceptional accuracy in interfacial systems (R² = 0.9900), while combinations such as DT-SVR and DT-MLP achieved remarkable precision in predicting system efficiency under specific operating conditions.
Finally, Gaussian Process Regression (GPR) was applied to forecast short-term heat demand in district heating systems [8]. The GPR model, which leveraged historical data and precise temperature predictions, achieved a mean absolute normalized error of 2.94% and has been successfully implemented online in Slovenia's largest district heating system since 2019. Its adaptability and precision underscore its suitability for various heating systems.
To conclude, machine learning algorithms have been successfully applied to predict heat demand in a variety of processes. In this paper, we propose to predict the steam demand in a leaching process by using data driven methods.
3. Methodology 3.1 Process Description
Fig .1 depicts the leach process at the Uranium Mine, which is a meticulously designed operation that uses advanced thermal management and staged chemical processing to optimize uranium extraction. The process begins with the collection of uranium-rich slurry from two pre-leach thickeners. The underflow slurry has an average uranium concentration of 400 grams per ton. This slurry is directed to a condenser tank, which serves as a surge reservoir and can hold up to 12 hours of slurry. Such capacity ensures a consistent flow to the downstream leach section, even during upstream disruptions, ensuring uninterrupted operation. The slurry enters the condenser tank at around 25°C and is then transferred to a pre-heating tank at a similar temperature to prepare it for the subsequent heating stages.
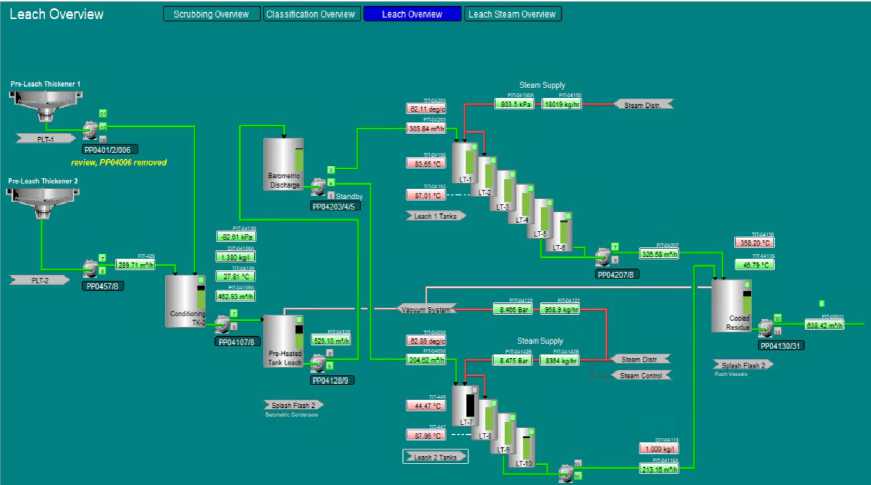
Fig.1. Leach process overview
The LHU leach process is distinguished by its innovative "flash splash" heat recovery system. After the initial leaching cycle, heat is reclaimed from the hot slurry using a vacuum flashing process. This recovered heat is transferred through a counter-flow mechanism, raising the slurry temperature by about 40°C and bringing it to around 65°C before it enters the barometer discharge tank. The heated slurry is then directed into one of two leach trains (Leach Train 1 or Leach Train 2), where it is exposed to 180°C steam, bringing the slurry temperature up to an optimal 90°C. This temperature is maintained for a 36-hour residence time, with sodium carbonate added at a concentration of 21 grams per litre to aid uranium leaching under controlled conditions. Following this extended period of thermal and chemical treatment, the uranium-enriched slurry exits the leach trains and undergoes further heat recovery via the flash splash process. The cooled slurry is then stored in a "cooled residue" tank before proceeding to the CCD section, where further recovery of the leached uranium occurs.
-
3.2. Feature Selection
The process engineers responsible for the leach circuit identified several critical variables that significantly impact the steam demand in the leaching process. These variables include:
-
• Slurry Flow Rate: The volumetric flow rate of slurry entering the leach circuit.
-
• Incoming and Outgoing Flash Splash Temperatures: The temperatures measured before and after the flash splash.
-
• Final Leach Tank Temperature: The temperature maintained within the leach tank.
These recommendations were further analysed and validated using Principal Component Analysis (PCA) to ensure their reliability and accuracy in predicting steam demand. The PCA results were used to confirm the coefficients associated with each variable, as presented in Table 1 and Table 2. The coefficients derived from PCA provide insight into the relative influence of each variable, with higher coefficients indicating a stronger impact on steam consumption in the leaching process. This validation approach ensures that the identified variables are both statistically and operationally significant, forming the foundation for process optimization strategies. Citing Table 2 it is evident that the slurry flow into leach has the most impact, followed by the recovered heat and leach temperature. The heatmap in Fig 2 summarise the findings.
Table 1. Selected Features- Inputs to the process
|
Feature |
Coefficient |
Abs Coefficient |
|
Leach1Tank01Temperature |
-811.85332912202 |
811.85332912202 |
|
cold_leach_temp |
-798.67674900306 |
798.67674900306 |
|
Leach1 Tonnes |
676.91361468574 |
676.91361468574 |
|
Flash_heat_Out_l1 |
-108.32576777110 |
108.32576777110 |
|
Flash_heat_out_l2 |
-18.44589891573 |
18.44589891573 |
Table 2. Featured engineered data
|
Feature |
Coefficient |
Abs Coefficient |
|
Heated_Slurry_to_Leach_1_Solids_Volume_Flow |
4047.624531 |
4047.624531 |
|
Recovered_Heat |
1572.368535 |
1572.368535 |
|
Leach_1_Tank_01_Temperature |
-635.8407324 |
635.8407324 |
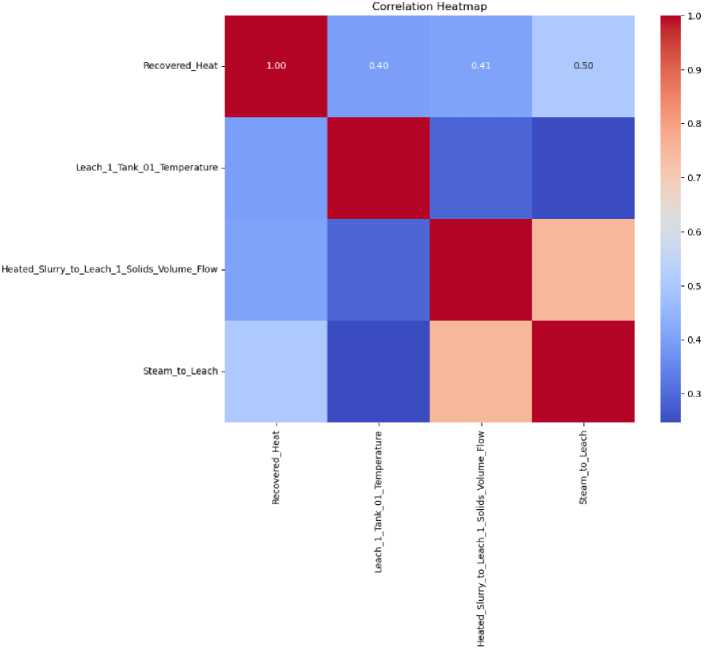
Fig.2. Correlation heatmap
To enhance predictive accuracy, the raw dataset underwent feature engineering to extract meaningful patterns and correlations relevant to steam demand in the leaching process. Data cleanup was performed using Python, which handled outliers and interpolated missing values by averaging adjacent data points, ensuring data consistency. Additionally, historical values were incorporated to construct a more robust feature vector for the model. The raw dataset, collected from the process historian at five-minute intervals, provided a high-resolution foundation for analysis. The training dataset was then feature-engineered to align with the variable structure outlined in Table 3, covering the period from July 11, 2024, to August 11, 2024. This structured alignment ensures a consistent basis for comparing the model’s predicted steam usage with actual steam demand. The analysis focuses on the newly generated "Predicted Steam to Leach" column, which is directly compared to actual steam usage to extract valuable insights. Beyond direct comparisons, supplementary analyses further assess the model’s predictive reliability and behaviour. Correlation analyses between actual and predicted steam values help evaluate the model’s responsiveness to changing process conditions, revealing time-series patterns that indicate potential leading or lagging tendencies in relation to real-time steam demand

Table 3. Feature selection data view
|
Date Time |
Recovered Heat |
Leach 1 Tank 01 Temperature |
Heated Slurry to Leach 1 Volume Flow |
Steam to leach |
|
2024 07 11 12:00:00 |
38,31 |
90,12 |
350,29 |
15509,88 |
|
2024 07 11 12:05:00 |
38,62 |
90,06 |
350,01 |
15489,42 |
|
2024 07 11 12:10:00 |
38,93 |
90,07 |
349,64 |
15484,91 |
|
2024 07 11 12:15:00 |
38,40 |
90,10 |
349,86 |
15487,08 |
|
2024 07 11 12:20:00 |
37,80 |
90,22 |
349,97 |
15487,70 |
|
2024 07 11 12:25:00 |
37,67 |
90,16 |
350,03 |
15480,41 |
Feature Vector Construction
-
• Recovered Heat
-
• Recovered Heat_12
-
* Recovered Heat_24
-
• Recovered Heat_36
-
* Recovered Heat_48
-
• Leach Tank Temperature
-
• Leach Tank Temperature_12
-
• Leach Tank Tempe rat ure_24
-
• Leach Tank Temperature_36
-
• Leach Tank Tempe rat ure_48
-
• Slurry Volume Flow
-
• Slurry Volume Flow_12
-
• Slurry Volume Flow_24
-
• Slurry Volume Flow_36
-
• Slurry Volume Flow_48
-
3.3. Model Training and Validation
-
3.4. Regression Model Selection-results of Training
Fig.3. Feature vector construction
The development of feature vector in Fig 3 for the predictive model is based on historical process data, leveraging lagged values to capture temporal patterns. Lagged features are denoted as _12, _24, _36, and _48, representing values recorded 1, 2, 3, and 4 hours prior, respectively. Key input parameters, such as Recovered Heat, Leach Tank Temperature, and Slurry Volume Flow, are transformed into a feature vector comprising these lagged values. This feature vector serves as the input for predicting the target variable, Steam to Leach. By training a regression model on this structured historical data, the objective is to derive insights into time-dependent relationships and trends within the process. The resulting predictive model enables real-time forecasting of steam demand, allowing for improved control and optimization of the leaching process.
This study employs various machine learning algorithms to model and predict steam demand in the leaching process. The dataset is partitioned into a training set comprising 30% and a validation set comprising 70% to facilitate effective generalization of the models to novel data. Anaconda with Jupyter Lab was chosen as the primary software environment for model implementation because of its flexibility, ease of library management, and comprehensive support for machine learning libraries. This configuration facilitates the integration of Python libraries, rendering it suitable for experimentation with various machine learning algorithms.
To evaluate the performance of various regression models and determine the most effective algorithm for forecasting steam demand in the leach process, a set of key evaluation metrics was employed. These metrics provide a comprehensive assessment by measuring different aspects of predictive accuracy, error minimization, and model reliability. The selected evaluation criteria include:
-
• Root Mean Squared Error (RMSE) – This metric quantifies the model’s overall prediction error by penalizing large deviations, making it useful for assessing the stability of forecasts.
-
• R-squared (R²) – This coefficient measures how well the model explains the variance in steam demand. A higher R-squared indicates a stronger correlation between predicted and actual values.
-
• Mean Absolute Error (MAE) – Unlike RMSE, which squares errors, MAE provides a direct measure of average prediction error, making it a useful metric for evaluating the model’s consistency.
Sum of Errors – This metric evaluates the total cumulative deviation between actual and predicted values, offering insights into long-term model stability and potential bias.
Each of these metrics plays a critical role in determining the most accurate and reliable predictive model. By analysing multiple error perspectives, this study ensures that the chosen model consistently captures the dynamics of steam demand in the leach process while minimizing deviations.
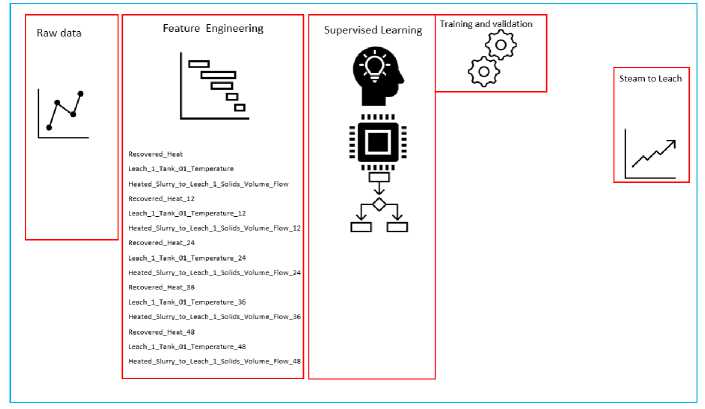
Fig.4. Block model diagram
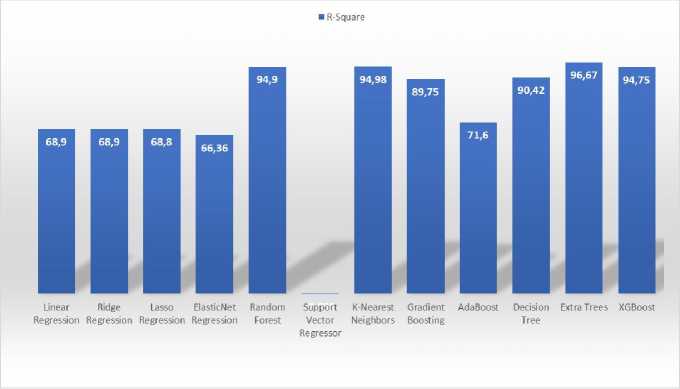
Fig.5. R square results
The analysis involved evaluating several machine learning models to assess their performance in minimizing errors. The models trained and assessed were
-
• Linear Regression
-
• Ridge Regression
-
• Lasso Regression
-
• Elastic Net Regression
-
• Random Forest
-
• Support Vector Regressor (SVR)
-
• K-Nearest Neighbors (KNN)
-
• Gradient Boosting
-
• AdaBoost
-
• Decision Tree
-
• Extra Trees
-
• XGBoost
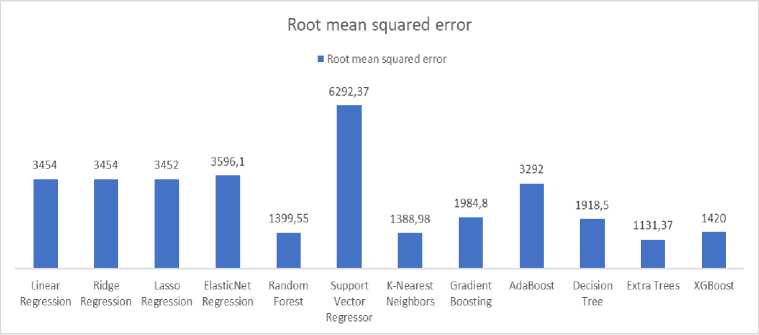
Fig.6. Root mean squared error
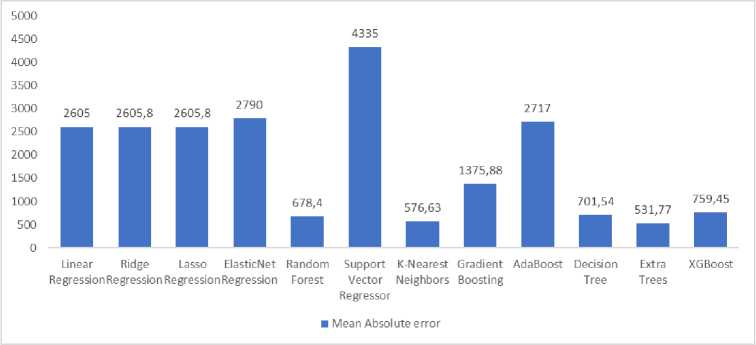
Fig.7. Mean absolute error
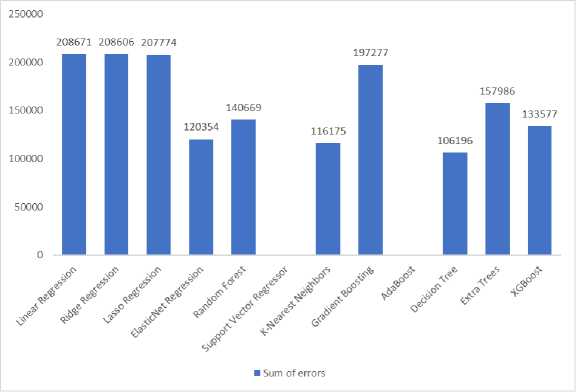
Fig.8. Sum of errors
Based on these evaluation criteria, the Extra Trees model emerged as the most accurate and consistent algorithm for forecasting steam demand. It achieved a 96.67% R² score, indicating a near-perfect fit to the data and explaining almost all variations in the target variable. The model demonstrated low prediction errors, with an MAE of 531.77 Kg and an RMSE of 1131.37Kg, ensuring minimal fluctuations between actual and predicted steam demand. Additionally, the Sum of Errors (157,986 Kg) confirmed that the model’s cumulative deviation remained small, reinforcing its dependability in identifying complex patterns within the dataset. These findings validate the Extra Trees model as a robust and highly reliable predictive tool, capable of optimizing steam demand forecasting and enhancing operational efficiency in the leach process.
4. Results 4.1. Experimental Setup- trained Model
This section highlights the real-world predictive performance of the trained Extra Trees model using actual production data. The production dataset spans from August 11, 2024 (00:00), to October 1, 2024 (00:00), 5 minutes intervals, and has undergone rigorous pre-processing as outlined earlier as the training dataset to fit the extra trees model.
This section will now evaluate the model ability to predicting the critical "Steam to Leach" variable using real plant data. It's crucial to note that the model was trained on historical data from July 11, 2024 (00:00) to August 11, 2024 (00:00). The following results will demonstrate how well it generalizes beyond its training set, providing insight into its accuracy and reliability in live production scenarios.
-
4.2. Feature Vector Time Series Plots
The time series charts illustrate data from August 11 to October 1, 2024, with the index reflecting this period. Initially, from index 0 to 6000, the data exhibit considerable instability and irregular behavior throughout the measured parameters. This variability indicates frequent interruptions at the plant during this first phase, perhaps attributable to operational difficulties or mechanical problems. Beginning with index 6000, there is a significant enhancement in stability across all parameters, suggesting that the process has become more consistent and reliable, either due to the implementation of corrective actions or the stabilization of plant operations.
-
4.3. Predicted and Actual Model Data
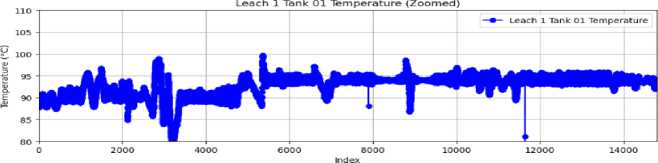
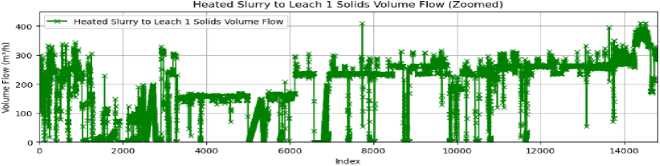
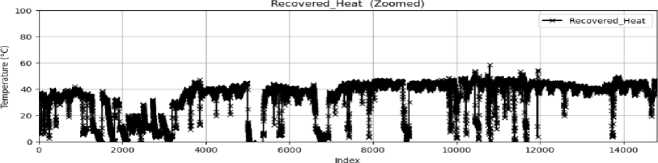
Fig.9. Time series plot of feature vectors
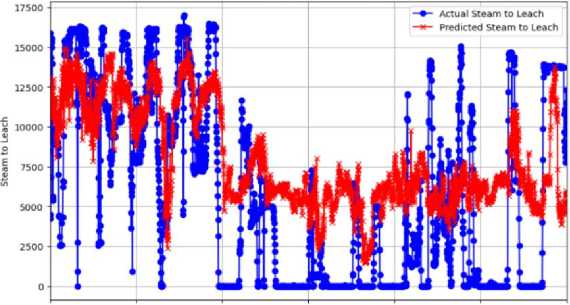
The time series figure illustrates that the blue graph signifies the actual process data for steam allocated to leaching, whereas the red line represents the predicted values generated by the Extra Trees model. The results clearly indicate significant fluctuations that affect the efficiency and overall steam generation of the process. The preliminary data from the model indicate that the anticipated fluctuations are negligible, suggesting a more stable output as represented by the algorithm relative to the actual data. This disparity indicates that although the algorithm forecasts a more stable process, the real process undergoes considerable oscillations that may impact operational efficiency.
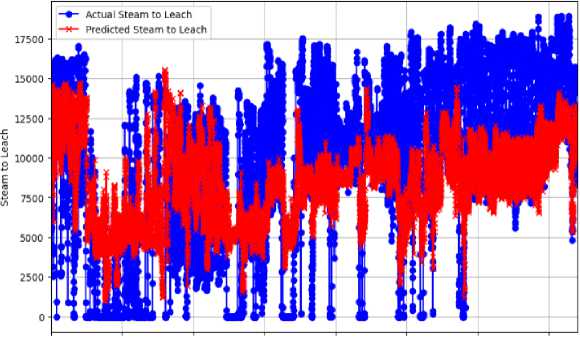
The plots for each steam to leach, both actual and predicted, are combined in the figure above. From index 0 to 6000, the process was unstable, as highlighted in Fig. 11. Typically, the algorithm is observed to exhibit disturbance and adhere to a pattern that is comparable to that of the actual steam. This similarity suggests that the algorithm effectively depicts the trends and fluctuations of the actual process, reflective of the periods of instability and variations in steam production, despite its noise.
The index range between 0 and 3000 is the primary focus of the presentation in the figure. It is crucial to emphasize that the algorithm never predicts a zero-steam demand for the leach circuit. This suggests that the algorithm is accounting for heat loss, hence the steam production should not drop to zero.
One can consider the predictions from the algorithm to be better than the actual demand. From an operational perspective, the significant oscillations in steam production, including dropping to zero, is suboptimal. Consequently, this suggests that the utilization of the algorithm’s predictions will allow the boiler’s outputs to be stable while following the process demand and its fluctuation.
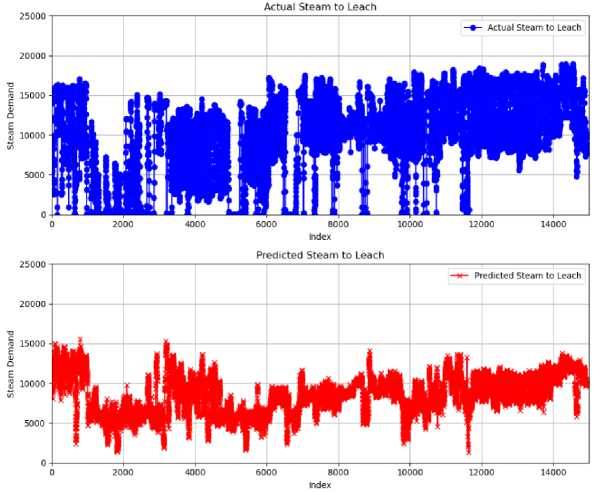
Fig.10. Actual and predicted data trends
Actual vs Predicted Steam to Leach
0 2000 4000 6000 8000 10000 12000 14000
index
Fig.11. Actual and predicted data trends- combined
Actual vs Predrcted Steam to Leach
0 500 1000 1500 2000 2500 3000
Index
Fig.12. Zoomed - Instability region
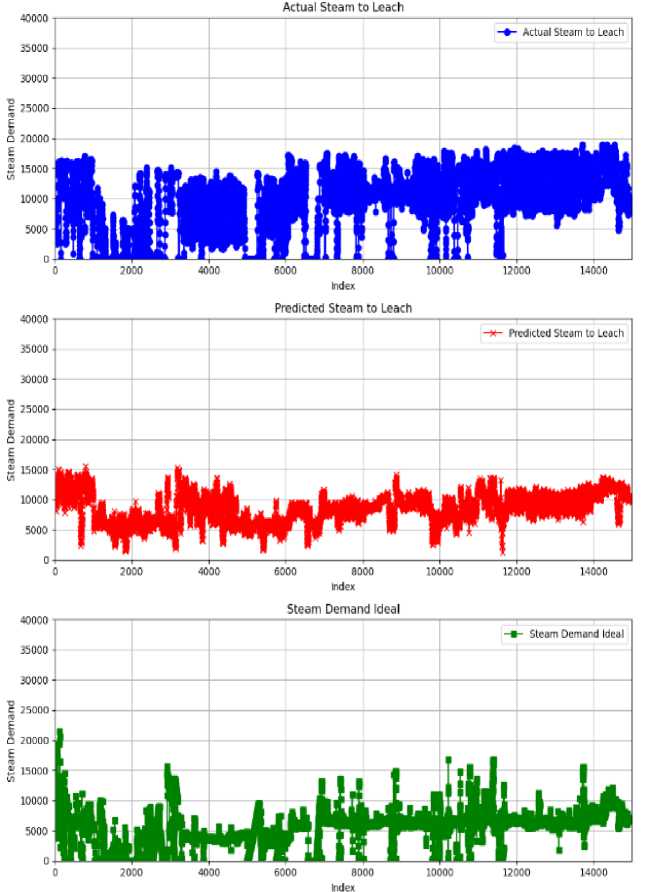
Fig.13. 1st principal steam demand
-
4.4. First Principle Steam Demand Model
It is essential to compare the estimated steam for leaching to a model based on basic principles to ascertain its adequacy in maintaining the temperature. The equation presented seeks to calculate the optimal steam demand, assuming no losses occur:
Ideal Steam De'mand = Ht
Leach Mass flow = Lm solids —% = sm%
Heat capacity of Solids = Cs
Heat capacity of water = Cw
Leach tank — 1 Temperature = TL
Flash Splash Temperature = t^o steam heat of condensation = Ccs
H i = [( L m *( S m % * C s ) + (1 - S m % * C w ))*( T — t f 0 )] / C cs
Equ. 1 is used to determine the requisite steam for the process under optimal conditions, disregarding any losses. This establishes a baseline for the theoretical steam necessary to sustain the desired temperature in the leach circuit.
Subsequently, on a time series plot, one contrast the ideal steam demand with the actual steam consumption and predicted steam values. This visual comparison will highlight periods where the actual and forecast values differ from the ideal, highlighting inefficiencies or overcompensations.
We evaluate whether the projected steam regularly satisfies or surpasses the optimal steam requirement. If the predicted values continually align with or exceed the optimal steam values without substantial overestimations, it’s an indication that the algorithm is proficiently mitigating process heat loss and sustaining leach temperatures.
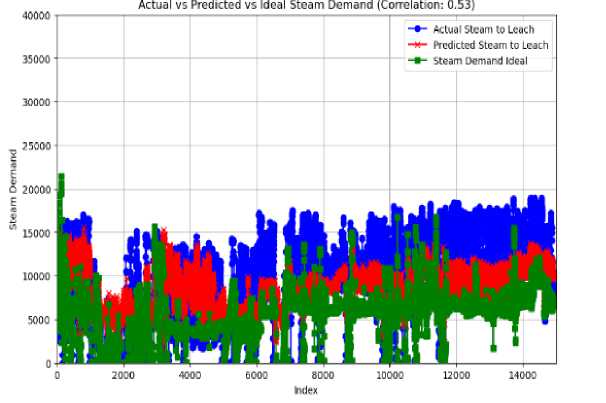
Fig.14. Actual, predicted and ideal combined
The output of the predictive algorithm in the presented time series plot is well positioned between the ideal steam demand and the actual steam measurements during the operation. This intermediate position implies that the predictive model not only closely follows the theoretical expectations of steam demand but also sufficiently considers the practical variabilities found in the real process operations.
The model's suitability in satisfying the process requirements is quantitatively supported by the fact that the predicted steam values constantly surpass the ideal demand. This kind of performance shows that the prediction algorithm is strong, thereby bridging the theoretical models' gap with practical operational requirements. It is quite clear that the predictive model's produced steam will be more than enough to maintain the leaching process under different operational settings.
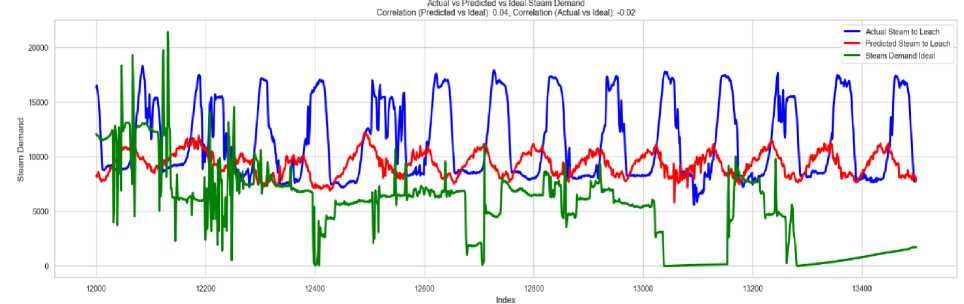
Fig.15. Zoomed view of the actual, predicted and ideal steam
The detailed analysis demonstrates that the predictive method successfully fulfills the process-critical heat requirements, particularly under stable operating conditions where its performance is most effective. The theoretical consumption is notably lower than the predicted usage, as it represents an ideal scenario without accounting for environmental losses. This comparison highlights the efficiency of the predictive algorithm, as the trained model compensates for these losses, ensuring optimal performance in practical applications.
-
4.5. Economics of the Process
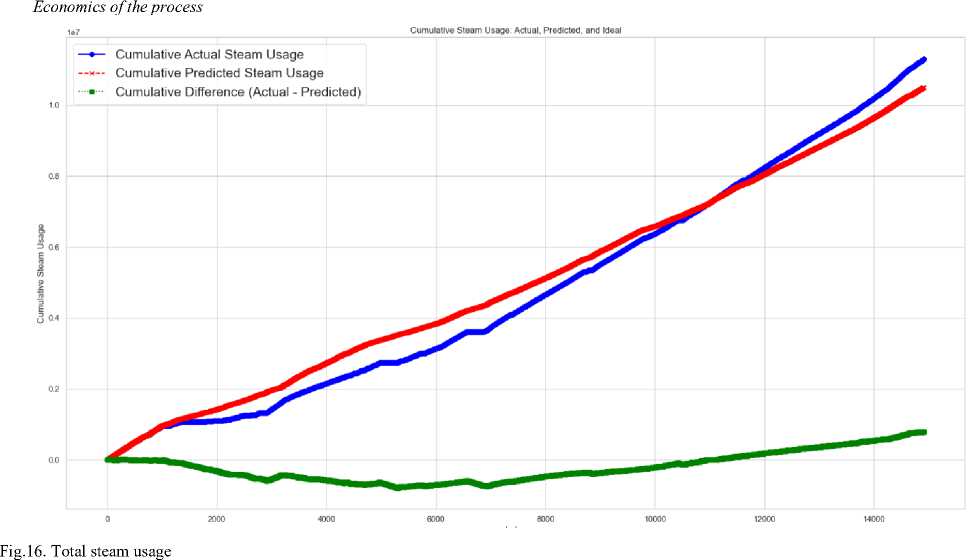
Last value of Cumulative Actual Steam (Zoomed): 11301265.291370794
Last value of Cumulative Predicted Steam (Zoomed): 10505726.590208346
Last value of cumulative steam Demand Ideal (zoomed): 6676154.632401564
Difference between Cumulative Actual and Predicted steam (zoomed): 795538.7011624482 Total energy required to produce 795538.7011624482 kg of steam: 2208415434.426956 kJ hfo required for 795538.7011624482 kg of steam: 50191.26 kg
Average (Actual - Predicted): 640.5386601067694
Energy Savings (kJ): 1780697.475096819
HFO Savings (liters per hour): 39.83663255250154
HFO Cost Savings (USD per Hour): 39.83663255250154
zoom Range Factor in hrs: 1250.0
Adjusted HFO Savings (liters): 49795.79069062693
Adjusted HFO cost savings (USD): 49795.79069062693
Fig.17. HFO savings
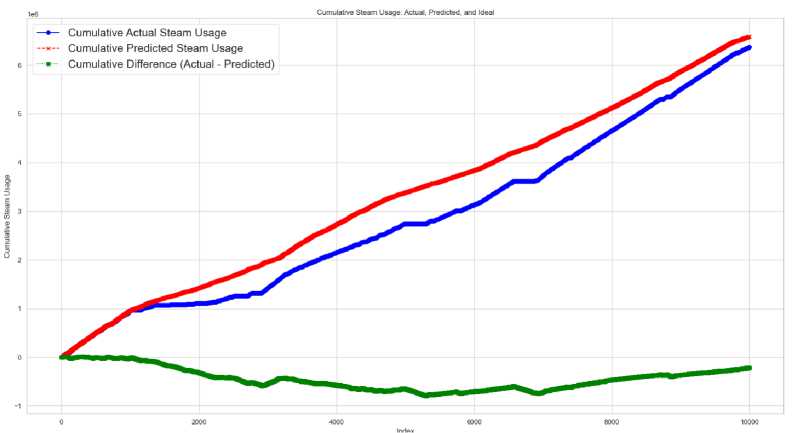
Fig.18. Unstable region- steam usage
The economic analysis of the process indicates a preference for improved HFO consumption, as demonstrated by the results presented at the graph's conclusion. The estimated savings of around 50,000 liters of HFO during the production data analysis indicate that the machine learning model is effectively optimizing fuel usage and enhancing operational efficiency. The measurable improvement highlights the model's potential to enhance environmental and economic sustainability in uranium extraction.
Fig 18 and 19 illustrate the conditions when the process operates in stable and unstable regions. It is important to note that the prediction algorithm can still achieve fuel savings without negatively impacting the process. In the unstable region, the graph shows a slightly higher-than-normal fuel usage, which is acceptable. However, the stable region delivers significantly greater overall savings compared to the unstable region.
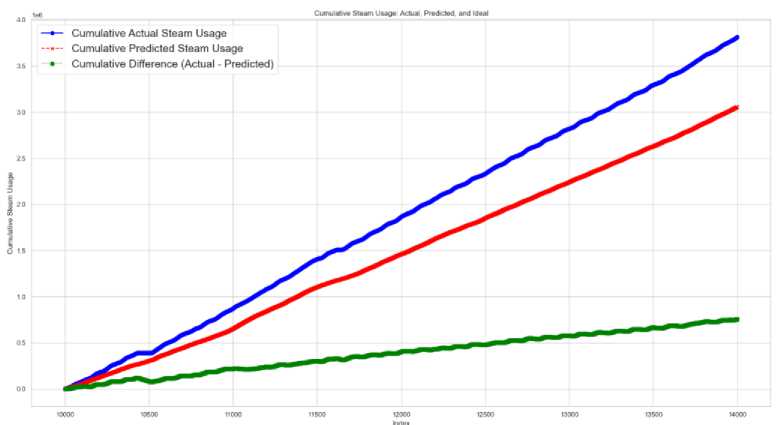
Fig.19. Stable region- steam usage
To improve model accuracy and reliability, particularly under dynamic and volatile conditions caused by plant breakdowns, Leach feed particle size distribution (PSD) and low-density slurry supply, it is crucial to address process instability. The predictive model’s ability to guide operations during unstable periods can significantly enhance decisionmaking and control strategies. One potential improvement is the introduction of additional features that capture fluctuations in key process variables like PSD and feed densities, allowing the model to better adapt to changing conditions. Another approach involves integrating a PLC-based algorithm to temporarily hold steam demand steady when rapid fluctuations occur, providing stability while the system readjusts. Future research could explore the development of novel metrics to quantify lead-lag relationships, refine feature selection methodologies, or incorporate real-time feedback mechanisms that dynamically adjust predictions based on current process conditions. These enhancements would not only improve model performance but also provide deeper insights into the complex interactions affecting steam demand, ensuring more robust and adaptive control strategies for industrial operations.
5. Discussions and Conclusions
The analysis of existing steam control models revealed substantial inefficiencies, particularly their inability to adapt to fluctuating process conditions. The examination of production data highlighted the challenges posed by volatility in steam usage, with traditional models failing to respond dynamically to changes in real time. These limitations underscored the need for advanced control strategies capable of addressing variability and ensuring consistent performance. The identification of these gaps served as the foundation for the development of a machine learning-based approach aimed at enhancing operational efficiency.
The application of the Extra Trees algorithm demonstrated its efficacy in forecasting steam demand. The model successfully optimized steam output, reducing waste and HFO consumption. This not only improved cost efficiency but also contributed to reducing environmental impacts.
To address these limitations, future research should focus on improving the model’s performance during unstable process conditions by incorporating additional variables, such as real-time pressure, densities of the process and flow rate fluctuations and testing the this on different fuel types of boilers. Expanding the model’s scope to include boiler load and efficiency parameters would enhance its prediction horizon and overall utility. These efforts would enable more comprehensive and proactive boiler management, ensuring resource efficiency and sustainability.
This paper highlights the transformative potential of machine learning in industrial boiler operations, offering significant advancements in cost savings, process reliability, and environmental sustainability. By addressing critical gaps in traditional steam control systems, the research establishes a strong foundation for future applications of predictive modelling in industrial engineering. This method can be seamlessly integrated into real-time operations by establishing a data pipeline between the process historian and an OPC server, which will interface with the machine learning server hosting the trained algorithm. The machine learning model will continuously process real-time data, predict future steam demand, and generate optimized steam setpoints. These predicted setpoints can then be sent back to the operation controllers managing the boilers, either as direct inputs for steam flow regulation or as offset adjustments integrated into the existing control logic.
The study's success is tempered by the distinctive features of the high alkalinity leaching process and the dependence on the Flash Splash heat recovery system, which restrict the model's applicability to alternative processes. Future research should concentrate on mitigating unstable process conditions by integrating supplementary features, including boiler load and efficiency parameters, to improve predictive accuracy and broaden the model's applicability. The proposed enhancements would enhance the model's adaptability across various industrial applications, thereby illustrating the potential of machine learning to promote efficiency, sustainability, and innovation in industrial processes.
Overall- The study applies the Extra Trees algorithm to accurately forecast steam demand, reducing inefficiencies and improving boiler stability. By optimizing steam control, the research demonstrates a 6.6% reduction in steam consumption, a 2% decrease in heavy fuel oil (HFO) usage, and estimated savings of up to 50,000 Liters of HFO, highlighting both economic and environmental benefits against current work practices. Furthermore, the predicted steam demand is benchmarked against a first principles-based model and current work practice, confirming that the machine learning approach effectively meets process requirements while minimizing unnecessary fuel.
