Improving classification by using MASI algorithm for resampling imbalanced dataset

Author: Thuy Nguyen Thi Thu, Lich Nghiem Thi, Nguyen Thu Thuy, Toan Nghiem Thi, Nguyen Chi Trung
Journal: International Journal of Intelligent Systems and Applications @ijisa
Article in issue: 10 vol.11, 2019.
Free access
At present, financial fraud detection is interested by many machine learning researchers. This is because of existing a big ratio between normal transactions and abnormal ones in data set. Therefore, a good result of prediction rate does not mean that there is a good detection result. This is explained that the experimental result might be effected by the imbalance in the dataset. Resampling a dataset before putting to classification process can be seen as the required task for researching in financial fraud detection area. An algorithm, so-called as MASI, is proposed in this paper in order to improve the classification results. This algorithm breaks the imbalance in the data set by re-labelling the major class samples (normal transactions) to the minor class ones basing the nearest neighbor’s samples. This algorithm has been validated with UCI machine learning repository data domain. Then, the algorithm is also used with data domain, which is taken from a Vietnamese financial company. The results show the better in sensitivity, specificity, and G-mean values compared to other publication control methods (Random Over-sampling, Random Under-sampling, SMOTE and Borderline SMOTE). The MASI also remains the training dataset whereas other methods do not. Moreover, the classifiers using MASI resampling training dataset have detected better number of abnormal transactions compared to the one using no resampling algorithm (normal training data).
Classification, Transaction Fraudulent Detection, Imbalanced Dataset, Resampling
Short address: https://sciup.org/15016628
IDR: 15016628 | DOI: 10.5815/ijisa.2019.10.04
Text of the scientific article Improving classification by using MASI algorithm for resampling imbalanced dataset
Published Online October 2019 in MECS
Classification to detect transaction fraud is one of the interesting issues for many business areas, in particular financial field recently. In some classifiers, an assumption of balanced distribution in the dataset has been used [1, 2, 3, 4,5]. Therefore, the experimental results were of high accuracies. But in the other sensitive rates such as sensitivities or G-means, they are not very high. This means that the high accuracies in prediction results have not shown the high meaning for users in particular to the financial fraud detectors.
The characteristic of financial data is that number of normal transaction is usually contributed with a high ratio compared to the abnormal ones. Both historical transaction types are used with data mining classification models to detect the abnormal prediction in the future [1, 2, 3-5]. The imbalanced ratio of distribution between normal and abnormal labels in output class is the main effective cause to classification results. This is because it might cause bias during classification process. In this process, the abnormal data might be considered as noise, or outliers. Therefore, these data are treated as the unknown or to be redundant observations in the classification process.
For instance, in the classification credit card fraudulent process, the ratio of the normal and abnormal data transaction as 1:10. Basically, if a normal classifier produces a rates of 99% accuracy. This means that many abnormal transactions have been treated as “normal” ones.
Therefore, a model with high rate of accuracy was not a good detector’s model. This is because the model cannot be used to predict minor class in the dataset. As results, the model cannot be trusted or used for business actions. To conclude, for imbalanced classification problems, there is a requirement of a special operations.
There is another characteristic in financial data domain. Financial data, especially that of banking transactions, is not shown in publication data domain. This is because of their privacy policies. In many banks, fraudulent detection has been performed manually by bank detective staffs. Therefore, enhancing the quality of checking fake or fraud transactions automatically is challenged to many banks and financial companies.
Researching papers, nowadays, have focused on the imbalanced problems like exploring the nature of alternative classes in the problems or building many possible solutions to deal with imbalanced data. Proper measures for evaluating classification performance are also studied [3, 6-7]. Further details in published papers on imbalanced problems can be seen in [4, 6, 8- 9].
In this paper, a new MASI (Moving to Adaptive Samples in Imbalanced dataset) algorithm proposed in [10] is used to resample the imbalanced dataset in the real domain in Vietnamese financial company. The main idea of MASI in [10] is that the algorithm enhances minor class samples by re-labeling some major class samples. These labels are based on data density distribution around the minor core samples (near border line) locating in training dataset. The difference of MASI compared to other methods is that the samples, whose labels are changed, are depended on the ratio between major and minor data samples in major and minor classes as well as a number of nearest neighbor samples located near the minor class. By changing the neighbors, the number of minor class samples will be increased whereas the data samples in major class will be reduced.
Moreover, by using MASI, the boundary, which divides two classes (major and minor) into two partitions, will be moved in order to separate clearly these two classes. There is no bias in new resampling dataset, as well as results, the classification learning process can be improved. This brings better classifier’s performance.
The paper structure is organized as follows: The general financial fraudulent is introduced in section 1. The overview of related works can be seen in section 2. Section 3 shows the resampling task in imbalanced data set as well as MASI algorithm validated with public data domain. A framework and experiment of using MASI for Vietnamese Financial data domain is shown in section 4. The conclusion is described in section 5.
-
II. Related Works
The popular machine learning techniques such as supervised learning of J48, Naïve Bayes, Support Vector Machine (SVM), etc. are usually used in various classification domains. They applied not only in a medical area with good classification performance such as predicting cancer [11] but also in other popular areas.
For example, a facial expression can be recognized by a model using SVM [12], classification of the fire station requirement can be used alternative algorithms of machine learning [13], or combination between machine learning and Gaussian in SMOreg to predict the sale of business [14]. However, according to [1], these techniques could not handle without the imbalanced dataset. The cause of miss-classifying in these techniques is that they deal the data domain in an assumption of balanced density in the major and minor classes. The inaccuracy rates of prediction are referred to the nature of imbalance distribution in data domain.
According to [6], the nature of class imbalance distribution might be divided into two situations as follows: It happens naturally such as credit card fraud or rare disease detection; secondly, it might be too expensive to acquire needed data for minority class learning such as occurrence of the failure of a spaceshuttle. In this paper, given data is in the first situation as the number of credit card fraud (abnormal transactions) is very small compared to the normal ones.
There exists a skewed data distribution between classes. Therefore, classifiers might have a bias of focusing only on major class during training process. Another factor also influences to the classification results such as small sample size, or overlapping at different levels in some feature space [1]. According to [15], if the dataset is small, the size of training set will be decreased. As results, the high error rate might happen. In the case of overlapping problem, if there is a small size of dataset, the discriminative rules are difficult to induce.
According to [16], resampling can be seen as statistical procedures that reuse the sample data for the purpose of statistical inference. Moreover, it can also be seen as a revolutionary methodology which departs from theoretical distributions and the inference is based upon repeated sampling within the same samples. There are some popular methods for resampling imbalanced dataset such as over-sampling and/or under-sampling techniques; and synthetic data generation. In the first method, techniques are used to compensate for imbalanced distributions in the original data sets whereas the second overcomes imbalance in the original data sets by artificially generating data samples.
General speaking, the imbalanced problem in classification process can be solved in following approaches: Data solving; Algorithm solving; Costsensitive learning; or Classifier Ensemble solving [3, 7-8].
In the first approach, the data distribution has been adjusted by trying to increase the number of minor data items whereas reducing the number of the major ones. Some of popular publications can be seen in [17-19], onesided selection [20-21], neighborhood cleaning rule [21], or expanding of Tomek links so-called as SMOTE (over sampling) [22-23]. The advantage of these method is enabling to use data flexibly in the training process [9, 18, 22]. Otherwise, the drawback is the number of samples is fitted in the models so that they are not adaptable to apply to the small size of data domain [9].
There are some methods of generating synthetic data such as SMOTE [2], Borderline-SMOTE1 [24], Borderline-SMOTE2 [23], Safe-level SMOTE [22], ADASYN [25]. Specially, ADASYN [25] method has an improvement of SMOTE that the number of synthetic sample is generated from using density distribution in the minor samples.
Another method of removing data samples from major class to the minor one. For example, in Random UnderSampling - RUS [6, 7, 26- 27], the number of minor samples is increasing by randomly removing from major class. However, this might cause ignoring some important information.
The combination between SMOTE Oversampling and Borderline Under-sampling so-called as SOS – BUS [28] has been proposed to identify the borderline instances of majority class and adds them to the output dataset, and remove the major data samples in the remaining data set to make the balance.
There are some other methods to make balance in dataset by using rough set theory. The advantage of these methods is resampling the major class to the minor one by using k-neighbor items nearest minor samples. More details about these can be seen in [29] or SPY [30].
The second approach focuses on adjustment in algorithm so that it can enhance the learning in minor class. The main point is assigning the higher cost for the miss- classification in minor class than the cost in the miss-classification in the major one. For instance, the adjustment in support vector machine can be done by putting a value of penalty for each sample in each class or adjusting the boundary separated classes basing on nuclear connection. The popular publications in this approach are the learning on one-side selection [20]. The methods defined the boundary of objective class instead of defining separated line between two output classes. The prediction is based on the similarity measurement of each sample to the objective class with model threshold. Other method showed that the classification performance will be increased and the classifiers will have more better in accuracy achieved measure if the features are selected and reduced [31].
The cost-sensitive learning method [3, 8] can be seen as the joint of data and algorithm approaches. This method not only deals with the data in pre-processing step but also assigns different miss-classified costs to the majority and minority class. Therefore, this might increase the performance of classifier.
In the last approach, the combination of individual classifiers is performed to classify a given instance. Then, it combines the decisions of multiple classifiers to give the final decision [5, 29]. For example, using hybrid models between AdaBoost and majority voting methods added some noise in the data samples [5] or the combination of red flag (which presented hints for unnormal behavior) and processing mining [4] showed that the results not only achieved about good accuracy rates but also improved significantly classification performance in the detection of fraud cases in credit cards.
-
III. Resampling in Imbalanced Dataset
-
A. Imbalanced dataset problems
In imbalanced dataset, the data in minor part occupies a small ratio. However, this data often contains many “interesting” events. For example, this ratio is number of fraudsters using credit cards, or corrupted server scanning its network, etc. The problem is almost machine learning algorithms do not work very well with imbalanced datasets as the bias during training process.
Most studies on the problem of imbalanced dataset focus on the development of solutions of classification [32]. The commonly adopted methods are the characterization of the problem from observations obtained with experimental results through specific learning algorithms. The imbalanced dataset means there is a lack of representativeness of the minority group in data domain. This can be seen as an important factor to be considered in learning with imbalanced classes. Therefore, almost imbalanced dataset problems can be seen as binary classification problems with major and minor classes.
Consider the following definitions in the binary classification context. The input observation, represented by a feature vector x(x1,x2 , — ,x 2n ) , will be assigned to one of two classes of major or minor (normal or abnormal transactions in financial data domain) of у = {0,1}. In general, it is assumed that Co and C1 and their associated labels, correspond respectively to the majority and minority classes. The classification objective is to construct a mapping (or decision rule) that describes the relationship between the input variables x and output у. This means the task is to build a function f(x) so that у = f(x) = {0,1} with alternative conditions.
For example, in Bayesian decision theory, a fundamental probabilistic model was proposed for building optimal decision rules such as Bayes Theorem (1). Let p(x) = Ер(х|у = к) and p(y = к) respectively are the conditional density and the probability of occurrence (a priori) for the class Ck . A posteriori of an example x belongs to the class Cc can be calculated as:
P • ' (1)
where p (x) = £ p(xly = k)p(y = k) is the (unconditional) density of the input x.
If it is a binary classification problem, the binary decision rule will separate the input space into two disjoint regions. The boundary between decision regions is known as decision (or separation) surface.
Another example is that under the formulation of statistical learning, given a finite set of examples (training set) as {(x t ,y t )eRn x {0,1}|i = 1,2,..n} , the classification problem is to find the optimal function f (decision rule) so that minimizes the probability of the global classification error (expectation rate) as
р ( err )= р ( X€Rr , ■у =0)+ р ( xeR0 , У =1) (2)
Where р ( xeRt , У = ) is the joint probability of x being assigned to class Су( =0⁄), its true class being Ск . The optimal function / is supported by learning machine algorithms such as neural networks, support vector machine etc.
Once the mapping above function is defined, such a rule can be used to predict the output values (which class) for a given input example (given X ).
Evaluation metrics
Normally, the metric used in the evaluation and selection of classification models is the accuracy (or error rate) estimated in relation to a given test set. This methodology is justified by the standard formulation of the problem of supervised learning that aims at minimizing the probability of global error (3). However, for highly unbalanced problems, the accuracy may not provide adequate information about a classifier's discriminating ability which is relative to a particular (interest) group.
Therefore, a representation of classification performance can be formulated by a confusion matrix with sensitivity (SE) and specificity (SP) rates (4,5). The minor class can be seen as positive whereas the major class can be seen as the negative ones.
=
TP+TN
TP+FP+TN+FN
sensitivity (SE) = recall T=(4)
J v J TP+FN specificity (SP) = recall F=(5)
G-mean=√ЅЕ∗ЅР(6)
In (6), G-mean is calculated basing on SE and SP. The SE reflects the rate of number of correcting predicted True samples in minor class and the other (SP) is the rate of number of correcting predicted False samples in major one. In here, G-mean is taken of the averages with 20 values of G-mean in each fold of cross-validation steps (10 times).
-
B. MASI Algorithm
The MASI (Moving to Adaptive Samples in Imbalanced dataset) algorithm, which is based on ADASYN [18], has been proposed in [6]. There is an improvement of MASI compared to ADASYN is that ADASYN will increase the size of the training set if it generated synthetic samples. Conversely, MASI still keeps the same size. MASI can do this because it will change labels of some major class data samples which are the nearest neighbours of the minor class samples. This method can be performed basing on data density distribution in feature space.
The number of data samples, which have to be changed their labels, depend on the ratio between the major and the minor classes. Many nearest neighbour samples belonged to the major will be changed if the rate is high. Otherwise, a large number of nearest neighbour samples belonged to the minor will be changed if the rate is low. Therefore, MASI will enhance the border line between the minor and the major classes and also reduces the imbalance issues in data domain.
Terms Definitions
Assume that ^mj and ^mi are the numbers of samples in the major class and minor one.
Assign β is the potential ratio (in percentage) of data samples in major class which will be selected to change their class labels. The ratio of 0.5 (50%) means there is an equal ratio between the major and the minor data samples.
Assign к as the number of nearest neighbour samples in major class to the minor samples.
Assume that g। is number of nearest neighbours in major class near the minor sample SP i.
MASI Algorithm
Input : Training data T, N mj, N mi , β, k.
Output : T’ – training dataset (after re-sampling)
Step 1 : Define number of data samples which are selected to have their labels to be changed. These samples are in major class:
G=( Nmj - ^mi )∗ β (7)
G >0 when the number of major class samples are greater than the number of minor ones. Conversely, the number of major class samples are smaller than the number of minor ones. An assumption of G >0 is used in this algorithm.
Step2 : For each data sample of SP[ in minor class:
-
• Find к nearest neighbours’ samples in
major class near SP[ . Values of к is taken from input.
-
• Define ri= , xi is number of data samples
in major class, which is in k nearest neighbours of S?t , i=1,2,.., N mi , т^е [0,1].
Step3: Calculate the data density distribution so-called as r i ’:
r ; = (8)
1 yNmir v 7
∑
Where ∑ i r ■ =1
Step 4 : For each data samples in minor class Calculate g i as:
gi =r ; ∗G (9)
Where G is derived from (7).
Step 5 : Change to minor class labels for all nearest neighbour data samples gi.
The data samples’ labels have to be re-labelled with the samples in SPi (minor class) as well as these samples are k neighbours’ points which belong to major class. The criterion of ri’ (∑ir I = 1) is set to automatically decide the number of points (samples) in minor class. From there, number of k neighbors major class samples can be defined.
The radius of neighbourhood around a minor point is performed as follows: Firstly, calculate all Euclidean distance between the core minor point and the others around. Then, sort the array of distances in the increasing order. Select first k points as nearest neighbors of the core (current minor point like g1 as shown in (9)). This means not all neighbour points of a minor data sample have labels to be changed.
In this algorithm, value of parameter k (number of nearest major data samples to the minor ones) is sensitive. The margin separated the major and the minor is linear. Therefore, if k is small, it is very difficult to define clearly the separated line between the minor and the major class. Otherwise, the minor class might also have unwanted major data samples. In this paper the chosen value of k is 5 after running alternative experiments.
The pseudo-code for resampling by re-labelling of nearest neighbour data samples.
For each i in number of minor samples dataset
-
# calculate the imbalanced rate:
g[i] = as.integer(r.d[i]*G)
-
# Re-label samples and produce NewTrain dataset.
Fig.1. Pseudo code to resample training dataset [6].
MASI Validation
The algorithm is validated with alternative machine learning data sets which derived from UCI Machine Learning Repository [33]. The alternative ratios of minor and major class are used to ensure the quality of the MASI (see in Table 1).
Table 1. UCI Dataset
|
Dataset |
Samples |
Features |
Ratio |
|
German Credit card |
1,000 |
20 |
1: 2.33 |
|
UCSD-FICO [34] |
500 |
19 |
1: 20.74 |
The algorithm is used with R language. Alternative assessment metric methods such as SE, SP, and G-mean have been used. The experimental results shown the advantage of using MASI compared to other methods of Random Over-sampling (ROS), Random Under-sampling (RUS), SMOTE, and Borderline SMOTE1 (BSO1). For example, MASI can achieve more than 74% in G-mean rates running with UCSD-FICO data set. These were compared to other methods of less than 70%. The same comparison was shown higher G-mean rates in MASI with German Credit card data set. Interestingly, the experimental results in UCSD-FICO dataset also shown a worst G-mean in the case of without re-balancing (original) data (0, 3.12, and 48.37 according to SVM, C50, and RF respectively) whereas MASI can achieved more than 70%. More details of experimental results and the comparisons can be seen in [10].
-
IV. Experiments
In this paper, beside the UCI datasets, we also tested a real credit card data set that from a financial institution in Vietnam in order to compare and evaluate our algorithm. It will be presented a detailed information in part B.
-
A. Experimental Framework
For example, in Fig. 2a, and Fig. 2b, the red dots mean the abnormal data items whereas the blues are assigned as the navy ones respectively. Fig. 2a shows the number of data samples in major class which will be changed labels of G=5, k is 5.
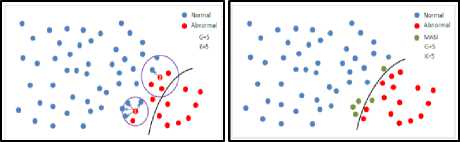
a) Original dataset (k=5) b) MASI dataset (green samples)
Fig.2. Example of using MASI (before and after).
The experimental framework is given as follows (Fig. 3):
-
• Step 1 : Secondary dataset is divided into training and testing datasets.
-
• Step 2 : The training set is applied with alternative resampling algorithms (published algorithms of ROS, RUS, SMOTE, BSO1 and proposal MASI).
-
• Step 3 : New resampling training datasets are used with alternative classifiers (SVM, C5.0, and RF). For comparison, original training dataset is also used.
-
• Step 4 : The classifiers’ models taken from step 3 are validated with the test sets in k-fold (k=10 here) and loop in 20 times. The assessment metrics particular G-mean will be used to measure the classifiers’ performance.
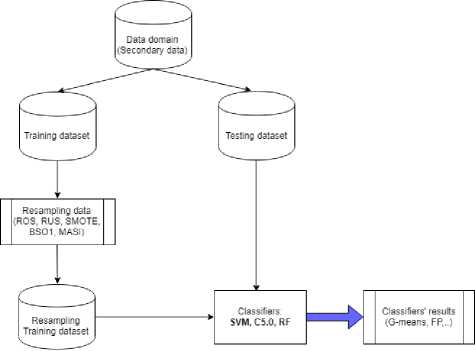
Fig.3. The experimental framework.
above classifiers for comparison purpose. Basing on the classifiers’ models taken from training, the test sets are used to validate the prediction results. The assessment metrics G-mean is used in Table 2 to compare the alternative results (classifiers’ results).
Table 2. Classifiers’ Results
|
Data |
SVM_G-mean |
C5.0_G-mean |
RF_G-mean |
|
Original data |
91.19% |
93.97% |
92.73% |
|
ROS |
95.10% |
95.96% |
95.27% |
|
RUS |
96.36% |
96.42% |
96.20% |
|
SMOTE |
96.12% |
96.09% |
94.78% |
|
BSO1 |
94.61% |
95.47% |
93.90% |
|
MASI |
96.44% |
96.41% |
95.82% |
-
B. Data Preparation
Data
The data is collected from 04/2017 to 05/2018 in a pilot project of Vietnamese Financial Company. Secondary Data domain contains 26 attributes about individual loan’s information (3358 records).
The main characteristics of the given data as:
-
• Redundant attributes: These are the date and time attributes, or personal id, code, or attributes with mostly null values; or explanatory attributes; and so on. These attributes bear little relevance to the experiments. Therefore, these attributes will be eliminated.
-
• Missing values: There is no missing observation in data domain.
-
• Noisy and inconsistent data: There is no noisy or inconsistent data in the domain.
-
• Transforming data: All numerical attributes is transformed into [0,1] with a linear normalisation formula. It is given by:
.. _ ^old - ^тт
Vnew = vmax v mm
After cleaning, transforming data the experimental dataset includes 11 features and 3358 observations. In here, the transaction shows the loan’s results of approval or not (0/1). The ratio of normal per abnormal is about 1:10. This means there are about 306 abnormal transactions over 3056 normal ones.
-
C. Experimental Results
The classifiers’ results for dataset can be seen in Table 2. The experiment is performed following the framework in Fig. 3. This means that original training data is resampled by using alternative resampling methods such as ROS, RUS, SMOTE, BSO1, and MASI. Then, all of new training datasets are used with alternative classifiers of support vector machine (SVM), decision tree (C5.0), and Random Forest (RF) in learning classification process. The original training data is also classified with
The evaluation for the resampling performance can be measured by using sensitivity rates (percentage of true positive prediction in minor class). These rates can be seen in Fig. 4.
In overall, the classifiers’ results for resampling dataset are higher than the original dataset (without using resampling algorithm). This shows the imbalance in data clearly affects to the prediction results.
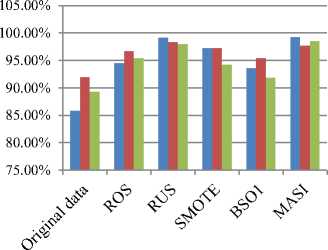
Fig.4. The sensitivity rates of SVM, C5.0, and RF classifiers
SE_SVM
SE_C5.0
SE_RF
The proposed resampling algorithm MASI supported classifiers to produce highest results except RF (95.82%) compared to other methods (about over 96%).
For more comparison to show the advantage of MASI with the normal in using classifiers, the depth investigation on fall positive (the abnormal transactions have been classified as normal ones) is performed. The results of accuracy classifiers’ rates and number of fall positive in each classifier can be seen in Fig. 5.
It is clear that, the classifiers’ accuracy rates before using MASI (normal training dataset) can achieve the better results compared to the ones after using MASI. However, the number of fall positive (abnormal transactions) is nearly triple higher than the ones using MASI. Note that, the number of fall positive values here means the abnormal transactions have to be miss-predicted as normal transactions. This can be seen as dangerous predictions in financial data domain. Therefore, the high classifiers’ accuracy rates do not mean the better classifier’s performance. One again, the MASI shows its essential role in the resampling task to reduce the bias in classification learning process.
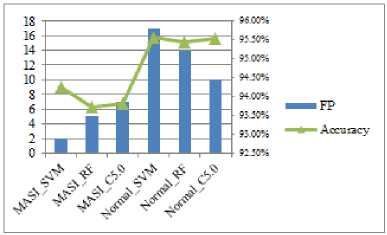
Fig.5. The classifiers’ accuracy rates and number of FP before (normal training dataset) and after using MASI.
-
V. Conclusions
Imbalanced dataset might affect to classification results as there is a big gap between quantity in one class (major) and the other (minor). Generally, in financial data domain, the normal samples (negative) take many places whereas the abnormal ones are very rare. For example, the normal samples here are the normal online transactions whereas the abnormal represents to the fraudulent ones. This leads to challenges if only using standard classifiers. This is because the majority samples might cause a bias during learning process.
Many algorithms such as ROS, RUS, SMOTE, and Borderline SMOTE1 (BSO1) have been reported to resample the dataset before applying their classification algorithms. However, almost these methods change the size of dataset after resampling. As discussed in section 3, MASI still keeps the same size while it changes some major class samples by re-labelling. Therefore, it can improve the classification performance.
While the published methods generated synthetics samples and put them into minor class, MASI generates synthetic samples by changing labels from negative nearest neighbor samples. Therefore, MASI maintains the same size of training dataset. The experiments are performed with popular resampling methods (ROS, RUS, SMOTE, and BSO1) and MASI for comparisons. The experiments’ results also show that MASI produced the highest new training dataset (resampling dataset) for classifiers’ models to achieve highest performance in fraud detective (measure in number of fall positive transactions) in the classifiers (SVM, C5.0, and RF) compared to the normal dataset.
Once again, the MASI results have confirmed that the resampling task is essential for imbalanced dataset particular to financial data domain in order to detect fraud transactions.
The drawback of MASI is that there is assumption of linear margin to separate the major and the minor classes. The idea of DBSCAN (Density-Based Spatial Clustering and Application with Noise) [35] might help with this as it can define the separated nonlinear margin between the minor and the major class. This will be left for further research.
Acknowledgement
The authors wish to thank to Thuongmai University for hosting the KX-199 project. This work was supported by Ministry of Education and Training project in Vietnam (Project No. KX199) with data resources and materials.
References Improving classification by using MASI algorithm for resampling imbalanced dataset
- E.A. Gustavo, P.A Batista, C. Ronaldo, M.C. Monard, "A Study of the Behavior of Several Methods for Balancing machine Learning Training Data," ACM SIGKDD Explorations Newsletter, Special issue on learning from imbalanced datasets, vol. 6, No. 1, 2004, pp. 20-29.
- C. V. Nitesh, B. W. Kevin, O. H. Lawrence, K. W. Philip, “SMOTE: Synthetic Minority Over-sampling Technique”, Artificial Intelligence Research, vol. 16, 2002, pp. 321–357.
- Y.J. Chen, W.C. Liou, Y.M. Chen, J. H. Wu, “Fraud detection for financial statements of business groups”, International Journal of Accounting Information Systems, 2019, Vol 32, pp. 1-23
- G. Baader, H. Krcmar, “Reducing false positives in fraud detection: Combining the red flag approach with process mining”, International Journal of Accounting Information Systems, Vol. 31, 2018, pp. 1-16. DOI: 10.1016/j.accinf.2018.03.004
- K. Randhawa, C. K. Loo, M. SEERA, C. P. Lim, A. K. Nandi, “Credit Card Fraud Detection Using AdaBoost and Majority Voting”, IEEE Access, Vol 6, 2018, pp. 14277 – 14284.
- S. Yanmin, A. KC. Wong, S.K. Mohamed, “Classification of imbalanced data: A review”, International Journal of Pattern Recognition and Artificial Intelligence, vol. 23, No. 4, 2009, pp. 687-719
- I. Sadgali, N. Sael, F. Benabbou, “Performance of machine learning techniques in the detection of financial frauds”, Second International Conference on Intelligent Computing in Data Sciences (ICDS 2018), 148, 2019, pp. 45–54. DOI: 10.1016/j.procs.2019.01.007
- A.Aida, S. S. M. Siti Mariyam, and R.L. Anca, “Classification with class imbalance problem: A Review”. Int. J. Advance Soft Compu. Appl, Vol. 7, No. 3, November 2015
- C. L. Castro, A. P. Braga, “Supervised learning with imbalanced data sets: an overview”, Sba Control & Automation, vol.22, No.5, 2011.
- N.T. Lich, N.T.T. Thuy, and , N.T. Toan, “MASI: Moving to Adaptive Samples in Imbalanced Credit Card Dataset for Classification”, Proceeding of IEEE International Conference on Innovative research and development, ICIRD, 2018
- A. Sharma, S. Kulshrestha, S.B. Daniel, “Machine Learning Approaches for Cancer Detection”, I.J. Engineering and Manufacturing, 2018, 2, pp. 45-55. DOI: 10.5815/ijem.2018.02.05
- S. Bellamkonda & N.P.Gopalan, “A Facial Expression Recognition Model using Support Vector Machines”, I.J. Mathematical Sciences and Computing, 2018, No 4, pp: 56-65, DOI: 10.5815/ijmsc.2018.04.05.
- C. Aydin, “Classification of the Fire Station Requirement with Using Machine Learning Algorithms”, International Journal of Information Technology and Computer Science(IJITCS), 2019, No 1, pp: 24-30. DOI: 10.5815/ijmsc.2018.04.05.
- D. A. A. G. Singh, E. J. Leavline, S. Muthukrishnan and R. Yuvaraj, “Machine Learning based Business Forecasting”, I.J. Information Engineering and Electronic Business, 2018, 6, 40-51, DOI: 10.5815/ijieeb.2018.06.05
- Z. Masoumeh, S. Pourya, “Application of Credit Card Fraud Detection: Based on Bagging Ensemble Classifier”, International Conference on Computer, Communication and Convergence (ICCC 2015), vol. 48, 2015, pp. 679-685
- J. Berger, “Statistical Decision Theory and Bayesian Analysis”, Springer, 1985
- I. Tomek, "Two Modifications of CNN", Transactions on Systems Man and Communications, vol. 6, no. 11, 1976, pp. 769-772.
- M.R. Chernick, “Resampling methods”, Wiley Periodicals, 2012. Available at: https://onlinelibrary.wiley.com/doi/pdf/10.1002/widm.1054.
- S. Jerzy, S. Wilk, "Rough Sets for Handling Imbalanced Data: Combining Filtering and Rule-based Classifiers", Fundamenta Informatica - Special issue on concurrency specification and programming (CSP 2005), vol. 72, No. 1-3, 2006, pp. 379-391.
- K. Miroslav, and M. Stan, "Addressing the Curse of Imbalanced Training Sets: One-Sided Selection", Proceedings of the Fourteenth International Conference on Machine Learning, 1997.
- L. Jorma, "Improving Identification of Difficult Small Classes by Balancing Class Distribution,", Artificial Intelligence in Medicine, Springer-Verlag Berlin Heidelberg, 2001, pp. 63-66.
- B. Chumphol, S. Krung, L. Chidchanok, "Safe-Level-SMOTE: Safe-Level-Synthetic Minority Over-Sampling Technique for Handling the Class Imbalanced Problem,", Advances in Knowledge Discovery and Data Mining, vol. 5476, Springer-Verlag Berlin Heidelberg, 2009, pp. 475-482.
- H. He, and E. A. Garcia, "Learning from Imbalanced Data," IEEE Transactions on Knowledge and Data Engineering, vol. 21, no. 9, 2009, pp. 1263 – 1284
- N. Japkowicz, and S. Stephen, “The class imbalance problem: a systematic study”, Intell. Data Anal Journal. Vol. 6, No. 5, 2002, pp. 429–450.
- H. Haibo, B. Yang, A. Edwardo, L. Garcia, Shutao, "ADASYN: Adaptive synthetic sampling approach for imbalanced learning," IEEE International Joint Conference On Neural Networks, 2008, pp. 1322-1328
- E. Ramentol, Y. Caballero, R. Bello, F. Herrera, “SMOTE-RSB: a hybrid preprocessing approach based on oversampling and undersampling for high imbalanced data-sets using SMOTE and rough sets theory", Knowledge and Information Systems, vol. 33, No. 2, 2012, pp. 245-265.
- C. H. Yu, “Resampling methods: Concepts, Applications, and Justification”, Practical Assessment, Research &Evaluation, Vol. 8, No. 19, Available at: http://PAREonline.net/getvn.asp?v=8&n=19.
- S. R. Uma, M. N. Suresh, “A Hybrid Approach for Class Imbalance Problem in Customer Churn Prediction: A Novel Extension to Under-sampling”, I.J. Intelligent Systems and Applications, 2018, N0 5, pp. 71-81. DOI: 10.5815/ijisa.2018.05.08
- P. Cao, J. Yang, W. Li, D. Zhao, and O. Zaiane, “Ensemble-based hybrid probabilistic sampling for imbalanced data learning in lung nodule CAD,” Computerized Medical Imaging and Graphics, vol. 38, no. 3, pp. 137-150, 2014.
- D.X. Tho, T. D. Hung, O. Hirose, and K. Satou, “SPY: A Novel Resampling Method for Improving Classification Performance in Imbalanced Data”, Knowledge and Systems Engineering (KSE), 2015 Seventh International Conference on, 2015, pp. 280-285.
- P. H. Malhotra, P. Sharma, “Intrusion Detection using Machine Learning and Feature Selection”, I. J. Computer Network and Information Security, 2019, 4, pp. 43-52, DOI: 10.5815/ijcnis.2019.04.06
- F. Usama, P.S. Gregory, S. Padhraic, “From Data Mining to Knowledge Discovery in Databases”, AI Magazine, vol. 17, 1996, pp. 37-54.
- UCI machine learning data domain. Available at: https://archive.ics.uci.edu/ml/index.php.
- FICO-UCSD, 2009. Available at: https://ebiquity.umbc.edu/blogger/2009/05/24/ucsd-data-mining-contest/
- M. Ester, K. Hans-Peter, S. Jörg, and X. Xiaowei “A Density-Based Algorithm for Discovering Clusters in Large Spatial Databases with Noise” , AAAI Press, 1996, pp. 226–31.
