Improving Performance of Dynamic Load Balancing among Web Servers by Using Number of Effective Parameters

Author: Deepti Sharma, Vijay B. Aggarwal
Journal: International Journal of Information Technology and Computer Science(IJITCS) @ijitcs
Article in issue: 12 Vol. 8, 2016.
Free access
Web application is being challenged to develop methods and techniques for large data processing at optimum response time. There are technical challenges in dealing with the increasing demand to handle vast traffic on these websites. As number of users' increases, several problems are faced by web servers like bottleneck, delayed response time, load balancing and density of services. The whole traffic cannot reside on a single server and thus there is a fundamental requirement of allocating this huge traffic on multiple load balanced servers. Distributing requests among servers in the web server clusters is the most important means to address such challenge, especially under intense workloads. In this paper, we propose a new request distribution algorithm for load balancing among web server clusters. The Dynamic Load Balancing among web servers take place based on user's request and dynamically estimating server workload using multiple parameters like processing and memory requirement, expected execution time and various time intervals. Our simulation results show that, the proposed method dynamically and efficiently balance the load to scale up the services, calculate average response time, average waiting time and server's throughput on different web servers. At the end of the paper, we presented an experimentation of running proposed system which proves the proposed algorithm is efficient in terms of speed of processing, response time, server utilization and cost efficiency.
Load balancing, Distributed and Parallel Systems, Heterogeneous systems, response and waiting time
Short address: https://sciup.org/15012597
IDR: 15012597
Text of the scientific article Improving Performance of Dynamic Load Balancing among Web Servers by Using Number of Effective Parameters
Published Online December 2016 in MECS DOI: 10.5815/ijitcs.2016.12.04
A critical challenge today is to process huge data from multiple sources. Today, people are very much reliant on Internet. Users are becoming progressively more dependent on the web for their daily activities such as electronic commerce, on-line banking, reservations and stock trading. Therefore the performance of a web server system plays an important role in success of many internet related companies. Due to huge Internet traffic, requests on only single server will not serve the purpose. Hundreds or thousands of requests can come at a single point of time. Web developers need to process multiterabyte or petabyte sized data sets. Handling these datasets shall not be possible using single server. Today, a big challenge is how to handle this traffic with good response time and replication at minimum cost. One of the best ways for these huge requests and data processing is to perform parallel and distributed computing in cluster environment. Web Cluster has proved to be a best solution than using an overloaded single server.
The need for a web server cluster system arises from the fact that requests are distributed among these web servers in an efficient manner. Over a period of time, the performance of each system may be identified and the information can be used for effective load balancing. Such systems are extremely suitable for job processing. For load balancing various factors like I/O overhead, job arrival rate, processing rate may be considered to distribute the jobs to various nodes so as to derive maximum efficiency and minimum wait time for jobs.
There is a vast responsibility of data in various areas viz. Physics, astronomy, health care, finance and web scale. There is a necessity of data intensive processing and to design algorithms for real world datasets. For these data intensive workloads, a large number of cluster servers are preferred over small number of high end servers. There are lots of data processed by various companies. During 2010, data processed by Google everyday was 20 petabyte, and by Facebook was 15 Terabyte. This data processing requires very quick processing but Input/output is slow. The data needs to be shared also. But sharing is difficult as it leads to the problem of synchronization, deadlocks, finite bandwidth and temporal dependency. There is a need of departure from this type of data processing technology to High Performance Computing (HPC). To do large scale data processing, say we want to use 1000’s of CPUs without hassle of managing things. Various algorithms have been proposed for load balancing in distributed job processing systems. The algorithms can be classified into Static and Dynamic. While, the Static algorithm relies on a predetermined distribution policy, the Dynamic Load balancing algorithm makes its decisions based on the current state of the system.
This framework uses the dynamic algorithm to analyze the current system load and various cost factors in arriving at the best target processor to handle the job processing. This can be implemented on proposed framework. It allows experimenting distributed computations on massive amount of data. It is designed for large scale data processing. It parallelizes the computation across large scale cluster of machines.
The primary contribution of this research is to propose a framework for running web server cluster system in web environment based on collected requirements and to present its implementation on one of the web services. The second contribution is to present an experimental analysis of running this framework in web environment to prove the proposed research and to present the evaluation of experiments based on the various parameters such as speed of processing, response time, server utilization and cost efficiency.
This paper is organized as follows:
Section 2 explains the approach of proposed framework. Section 3 explains set of data and requirements to develop the proposed framework. Section 4 explains proposed framework and its implementation. Section 5 gives experimental results and analysis. Section 6 provides conclusion.
-
II. R ELATED W ORK
Recently, cluster servers are used for fast information retrieval on internet. The load balancing on effective parameters has been studied by many researchers. Alan. Massaru. T. N. Anitha et al describes the load status of web servers as a solution for load balancing. Manoj Kumar Singh et.al presents an optimal traffic distribution concept to distribute dynamic load based on traffic intelligence methods. Jianhai shi presents two steps static and dynamic scheduling for load balancing. He describes a strategy of distributed load balancing based on hybrid scheduling. Jorge E. Pezo et al propose a reliability solution for improving reliability in Heterogeneous Distributed systems . He demonstrated the results and testbed solutions. Y.S. Hong et al propose a DNS based load balancing solution using ring and global manager for distributing the traffic overflow. A. Khunkitti propose TCP-handoff and multicast based load balancing that allows immediate and complete connection transfer to another available server. Shardal Jain et.al proposes load balancing solution using prioritization of nodes which is done by comparing the efficiency factor and processing power of each and every node in it.
-
III. A PPROACH
In this section, we will discuss about our framework for load balancing mechanism. For load balancing, various factors are needed to be considered. Whenever there is a new request at any web site, the algorithm has to decide that this incoming request should be assigned to which web server so that the load among web servers remains balanced. For this, we take into consideration various aspects that are involved for fulfilling any request. These are number of servers, intervals, jobs generated and jobs expected execution time.
There are ‘n’ numbers of servers. The value for ‘n’ is variable. Server is having basic parameters as server’s memory, processing speed and memory left over. Server’s memory leftover will be modified whenever there is any job allocation to server or completion of job from that server. Total numbers of jobs are designated by ‘x’. Jobs generated for an individual interval can be defined as:
J[y] = Q, where J = { J1, J2…Jn}, ‘y’ is the interval generated and Q is the job generated for the respective interval and Q={0, 1….x n } where ‘x n ’ can be defined as maximum number of jobs that can be generated for an individual interval. Job parameters are job memory, job processing speed and total expected execution time. Here, job’s memory and processing speed means how much memory and processing of the server required by job for execution. Job’s expected execution time is the maximum time required by the job for execution.
In our approach, total time is divided into intervals and there is a fixed time slice of 5 milliseconds. At the time of initialization of intervals, jobs are generated, initialized and allocated to the servers. These jobs are recorded in “main array”. In addition, there are three types of arrays.
They are defined as follows:
-
a) Main Array : contains all the allocated jobs to respective servers. It contains all old jobs which are already executing and transferred in next interval and new jobs from main array.
-
b) New Job Array : contains all the jobs that are generated, when the interval begins.
-
c) Waiting Array : the jobs that are initialized, but waiting for allocation to server and execution.
There are various processes also running in the system. They are as follows:
-
i) Distribution of Jobs among Servers : Jobs are distributed among various servers on the basis of job’s memory and processing requirements. Both these parameters are compared with server’s memory left over and processing speed. If
satisfied, the job is allocated to the respective server. If all the servers are checked and job is still unallocated, it will be in waiting queue.
-
ii) Checking for Load Balance (LB) : In the
proposed approach, LB is taken care at the time of job allocation. The job is allocated to respective server only if it is greater than the job’s memory and job’s processing requirement. This makes the respective server even, or load balanced.
-
iii) Job Completion Process : Remaining expected execution time (initially same as maximum expected execution) is decremented with the reduction value of the respected server (to which job is allocated) after every cycle. If it becomes zero or less than zero, job is completed and done. At the same time, the memory left of that server is incremented with the value of job that is currently completed.
-
iv) Reduction value Process: Reduction value is calculated which is associated with each server. The reduction value is the value with which job’s expected execution time is decremented. It differs from server to server, on the basis of the processing speed of each server.
-
IV. D ATA R EQUIREMENTS TO D EVELOP F RAMEWORK
The basic goal of load balancing techniques in a cluster of Web servers is that every request will be served by the more lightly loaded node in the cluster. This section describes the various aspects which are specific to architectural design that we are going to implement for the development of software model where the incoming load from the client can be distributed efficiently over the web server system. Following are the data to be used in the proposed framework:
-
1. Time Interval : It is a definite length of time marked off by two instants. Our algorithm uses the concept of time interval which would be generated randomly for every 5 milliseconds.
-
2. Jobs Generated : A job is a task performed by computer system. In the algorithm, jobs are generated randomly in each time interval. Jobs that are generated have various parameters like processing time, memory requirement and total expected execution time. The performance of algorithm is measured by various factors that depend upon jobs generated like jobs in waiting queue, how many jobs are completed in an interval and response time, waiting time and total job runtimes.
-
3. Server : A server is a computer program which servers the requests made by clients. Servers have various parameters like processing speed, memory, memory left and jobs assigned. Server’s performance is also measured through its utilization levels, server’s status and server’s throughput.
-
4. Scheduling Technique : In the proposed algorithm, SJF (shortest job first) scheduling technique is used. It
will be applied twice: one initially on total burst time, while allocating jobs to servers and secondly, on ‘remaining-burst time’ on main array.
-
V. P ROPOSED F RAMEWORK AND ITS I MPLEMENTATION
This section describes the algorithm and flowchart that depicts the functioning of proposed system.
-
A. Algorithm
Step 1 : Server Initialization
Step 2 : Interval Initialization
Step 3: If Job/Jobs Generated
Then a) They are queued in NEW_JOB_ARRAY
-
b) SJF will be applied on NEW_JOB_ARRAY on the basis of BURST_TIME
Step 4: if INTERVAL_VALUE == 0
Then a) Allocation of Jobs that are in
NEW_JOB_ARRAY starts
-
b) If Allocation is successful, the Jobs are queued to MAIN_ARRAY
-
c) If Allocation of Job is not done, the JOBS are queue to WAITING_QUEUE
Step 5: if INTERVAL_VALUE > 0
Then a) Firstly, the Jobs that are in WAITING_QUEUE will be allocated
-
• If Allocation is successful, then, the jobs are queued to MAIN_ARRAY
-
• Else, they remain in WAITING queue
-
b) Go to Step -4
Step 6: MAPPER FUNCTION
-
a) SJF applied on MAIN_ARRAY on the basis of REMAIN_BURST
Step 7: REDUCER FUNCTION
-
a) Execution of Job/JOBS starts, that are in MAIN_ARRAY
-
b) REMAIN_BURST value of JOBS/JOB are reduced by the Server’s RAD_VALUE
-
c) Once, job’s REMAIN_BURST value == 0, its execution completed
Step 8: If JOB_ARR_VALUE >= 0 AND
WAITING_VALUE >= 0 AND
INTERVAL_VALUE >=
MAX_JOB_INTERVAL
Then,
-
a) Repeat Step -3 to Step -8
Else
STOP
B. Flowchart
This section describes the pictorial representation of proposed approach.
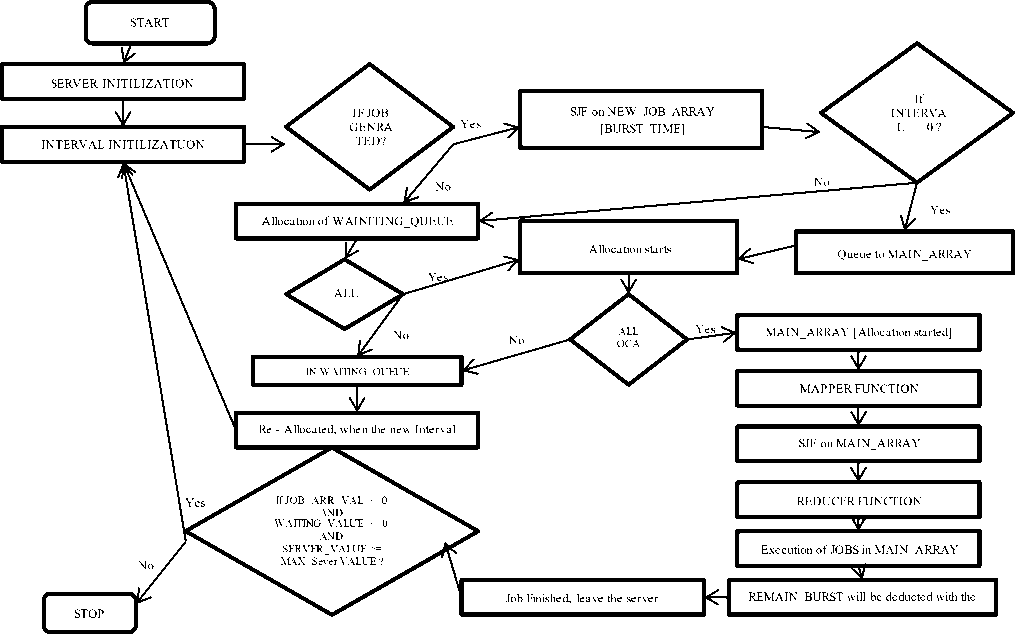
Fig.1. Flowchart shows overall representation of proposed approach
-
VI. E XPERIMENTAL R ESULTS AND A NALYSIS
Performance Measurement:
In the experiment, following notations are being used:
T.I.G.: Total Interval Generated, T.J.G.: Total Job Generated, T.S.: Total Server, E.E.T.: Expected
Execution Time, F.E.T: Final Execution time, A. W.T.: Average Waiting Time, A.R.T: Average Response Time and J.R: Job Runtime
The Performance of proposed load balancing algorithm is measured by following parameters
-
A. Calculating Performance with low, medium and high load jobs
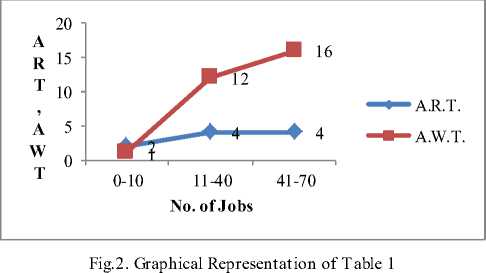
The first and foremost parameter is to calculate performance of servers w. r.t number of jobs. Jobs generated per interval may be divided into low jobs (010), medium jobs (0-40) and high load jobs (0-70). If there are different jobs coming at different time interval, following table and chart show the average waiting time and response time of each server.
Table 1. Perfomance with Different No. of jobs
|
No. of Jobs |
A.R.T. |
A.W.T. |
|
0-10 |
2 |
1 |
|
11-40 |
4 |
12 |
|
41-70 |
4 |
16 |
-
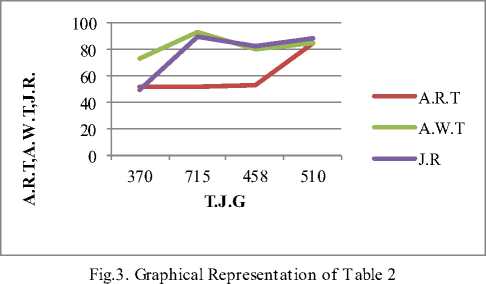
B. Calculate mean response time and mean waiting time
Following experiment shows average response, average waiting time and job run time w. r.t jobs generated per interval.
Table 2. Mean Response and Waiting Time
|
T.J.G |
A.R.T |
A.W.T |
J.R |
|
370 |
52 |
73 |
50 |
|
715 |
52 |
93 |
90 |
|
458 |
53 |
80 |
82 |
|
510 |
85 |
85 |
89 |
-
C. Results with various Intervals, Jobs and Servers
In this experiment, we have taken 4 cases (with different Intervals generated, jobs generated, total servers and expected execution time) and then calculated following in each interval:
C.1 Final execution time
Experiments are performed on the algorithm in four cases, and they are defined in the table below:
Table 3. Different Cases
|
Cases |
T.I.G. |
T.J.G (Per Interval) |
T.J.G(All Intervals) |
T.S. |
E.E.T |
F.E.T. |
|
1 |
20 |
0-50 |
508 |
10 |
0-20 |
105 |
|
2 |
20 |
0-80 |
768 |
10 |
0-20 |
105 |
|
3 |
20 |
0-50 |
495 |
8 |
0-20 |
101 |
|
4 |
20 |
0-50 |
354 |
10 |
0-40 |
113 |
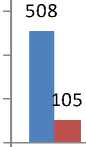
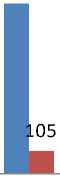
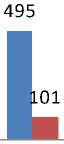
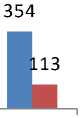
■ T.J.G(All Intervals)
■ F.E.T.
Fig.4. Different Cases
C.2 Results for Server’s Utilization
Following table shows the Server’s Status in each interval i.e. how much each server is utilized.
Let interval generated be ‘x’.
total time=total intervals * time per interval (1)
In our experiment, the intervals generated are 19. So total time for job execution is 95ms (19intervals * 5ms/interval).
Also, let Server S be busy for ‘m’ intervals, where S є
-
s 0 , s 1 ,……, s n .
100.00%
90.00%
80.00%
70.00%
60.00%
50.00%
40.00%
30.00%
20.00%
10.00%
0.00%
Total busy period = ( m * time per interval ) (2)
server utilization = total busy period / total time. (3)
The tables below show the total busy period and the server utilization.
Case -1: Server: 10 (S0-S9), Total Job Generated: 050 per interval, Interval: 10 (1-19), EET: 0 – 20. The data collected is listed in Table 4 and shown in Figure 5 below.
Table 4. Case 1
|
Servers |
Total Busy Period |
ServerUtlization |
|
S 0 |
65 |
68.42% |
|
S 1 |
85 |
89.47% |
|
S 2 |
90 |
94.74% |
|
S 3 |
90 |
94.74% |
|
S 4 |
85 |
89.47% |
|
S 5 |
70 |
73.68% |
|
S 6 |
70 |
73.68% |
|
S 7 |
40 |
42.11% |
|
S 8 |
0 |
0.00% |
|
S 9 |
0 |
0.00% |
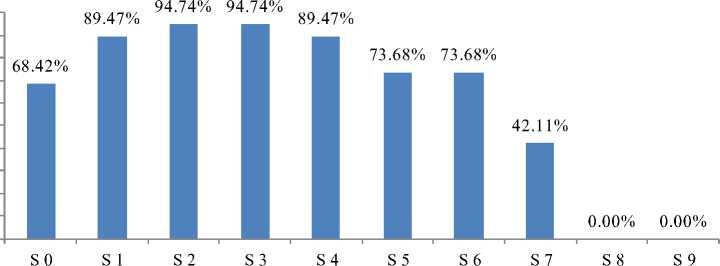
Fig.5. Case 1
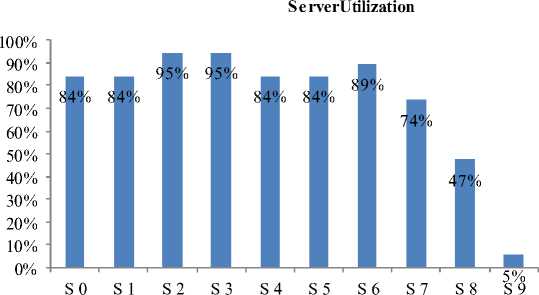
Case 2: Server: 10, Total Job Generated: 0-80 per The data collected is listed in Table 5 and shown in
Interval, Interval: 19, EET: 0-20 Figure 6.
■ ServerUtilization
Table 5. Case 2
|
Servers |
Total Busy Period |
ServerUtilization |
|
S 0 |
80 |
84% |
|
S 1 |
80 |
84% |
|
S 2 |
90 |
95% |
|
S 3 |
90 |
95% |
|
S 4 |
80 |
84% |
|
S 5 |
80 |
84% |
|
S 6 |
85 |
89% |
|
S 7 |
70 |
74% |
|
S 8 |
45 |
47% |
|
S 9 |
5 |
5% |
Fig.6. Case 2
Case 3: Server: 8, Total Job Generated: 0-50 per The data collected is listed in Table 6 and shown in
Interval, Interval: 19, EET: 0-20 Figure 7.
Table 6. Case 3
|
Servers |
Total Busy Period |
ServerUtilization |
|
S 0 |
80 |
84% |
|
S 1 |
70 |
74% |
|
S 2 |
95 |
100% |
|
S 3 |
75 |
79% |
|
S 4 |
75 |
79% |
|
S 5 |
55 |
58% |
|
S 6 |
55 |
58% |
|
S 7 |
20 |
21% |
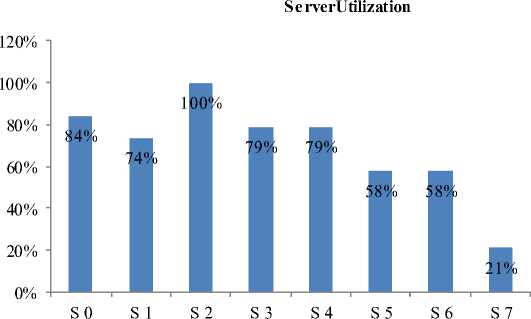
■ ServerUtilization
Fig.7. Case 3
Case 4: Server: 10, Total Job Generated: 0-50 per The data collected is listed in Table 7 and shown in
Interval, Interval:19, EET: 0-40 Figure 8.
Table 7. Case 4
|
Servers |
Total Busy Period |
ServerUtilization |
|
S 0 |
90 |
95% |
|
S 1 |
90 |
95% |
|
S 2 |
65 |
68% |
|
S 3 |
55 |
58% |
|
S 4 |
40 |
42% |
|
S 5 |
30 |
32% |
|
S 6 |
80 |
84% |
|
S 7 |
45 |
47% |
|
S 8 |
15 |
16% |
|
S 9 |
0 |
0% |
ServerUtilization
100%
90%
80%
70%
60%
50%
40%
30%
20%
10%
0%
68%
58%
95% 95%
42%
84%
47%
16%
0%
■ ServerUtilization
S0 S1 S2 S3 S4 S5 S6 S7 S8 S9
Fig.8. Case 4
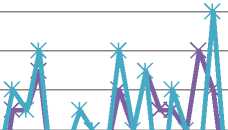
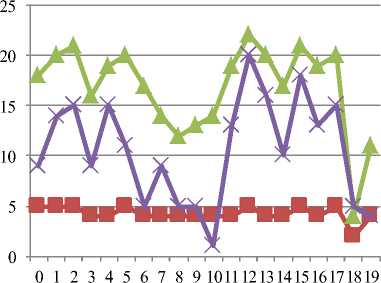
C.3 Response Time, Waiting Time and Job Runtimes Per Interval
Throughput is the output per interval. In this experiment, we have calculated the throughput after each interval. The results show the average waiting time, average response time and total Job run time ( for all above 4 cases).
Case 1:
Table 8. Throughput-Case 1
|
Interval |
T.J.G. |
A.R.T. |
A.W.T. |
J.R. |
|
0 |
20 |
2 |
3 |
2 |
|
1 |
37 |
4 |
11 |
13 |
|
2 |
24 |
3 |
4 |
3 |
|
3 |
22 |
3 |
3 |
1 |
|
4 |
14 |
2 |
3 |
1 |
|
5 |
8 |
2 |
2 |
2 |
|
6 |
15 |
2 |
2 |
1 |
|
7 |
20 |
3 |
4 |
2 |
|
8 |
25 |
2 |
3 |
3 |
|
9 |
1 |
3 |
2 |
0 |
|
10 |
16 |
3 |
2 |
0 |
|
11 |
29 |
3 |
3 |
1 |
|
12 |
14 |
2 |
2 |
1 |
|
13 |
36 |
3 |
7 |
7 |
|
14 |
13 |
3 |
6 |
1 |
|
15 |
12 |
2 |
2 |
2 |
|
16 |
6 |
3 |
2 |
0 |
|
17 |
14 |
2 |
3 |
3 |
|
18 |
14 |
2 |
3 |
2 |
|
19 |
30 |
3 |
6 |
5 |
Case 1

—■— A.R.T.
* A.W.T.
^^^^ J.R.
Fig.9. Throughput-Case 1
Case 2:
Table 9. Throughput-Case 2
|
Interval |
T.J.G. |
A.R.T. |
A.W.T. |
J.R. |
|
0 |
0 |
3 |
15 |
0 |
|
1 |
54 |
3 |
12 |
8 |
|
2 |
58 |
3 |
15 |
5 |
|
3 |
35 |
3 |
10 |
10 |
|
4 |
16 |
3 |
13 |
2 |
|
5 |
56 |
3 |
7 |
7 |
|
6 |
12 |
3 |
13 |
3 |
|
7 |
69 |
3 |
11 |
6 |
|
8 |
29 |
3 |
13 |
2 |
|
9 |
46 |
2 |
9 |
7 |
|
10 |
21 |
2 |
9 |
2 |
|
11 |
7 |
3 |
14 |
1 |
|
12 |
59 |
3 |
15 |
5 |
|
13 |
46 |
2 |
11 |
8 |
|
14 |
29 |
2 |
9 |
4 |
|
15 |
24 |
2 |
8 |
1 |
|
16 |
13 |
3 |
13 |
2 |
|
17 |
53 |
3 |
11 |
8 |
|
18 |
35 |
3 |
13 |
4 |
|
19 |
53 |
0 |
0 |
5 |
Table 10. Throughput-Case 3
|
Interval |
T.J.G. |
A.R.T. |
A.W.T. |
J.R. |
|
0 |
3 |
2 |
0 |
0 |
|
1 |
6 |
2 |
1 |
3 |
|
2 |
29 |
3 |
5 |
6 |
|
3 |
34 |
3 |
5 |
5 |
|
4 |
36 |
3 |
7 |
8 |
|
5 |
6 |
2 |
1 |
1 |
|
6 |
34 |
3 |
3 |
3 |
|
7 |
23 |
3 |
5 |
5 |
|
8 |
29 |
3 |
4 |
4 |
|
9 |
15 |
3 |
3 |
3 |
|
10 |
35 |
3 |
6 |
8 |
|
11 |
31 |
3 |
4 |
4 |
|
12 |
30 |
3 |
7 |
7 |
|
13 |
0 |
3 |
5 |
0 |
|
14 |
34 |
3 |
5 |
6 |
|
15 |
36 |
3 |
4 |
4 |
|
16 |
14 |
3 |
8 |
2 |
|
17 |
33 |
3 |
6 |
10 |
|
18 |
11 |
2 |
1 |
2 |
|
19 |
19 |
0 |
0 |
1 |
Case 3:
^^^ A.R.T.
A.W.T.
J.R.
Fig.10. Throughput-Case 2
^^^ A.R.T.
A.W.T.
^ч^ J.R.
0 2 4 6 8 10 12 14 16 18
Fig.11. Throughput-Case 3
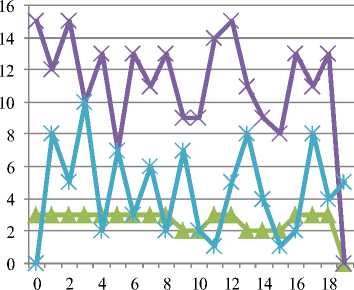
Case 4:
Table 11. Throughput-Case 4
|
Interval |
T.J.G. |
A.R.T. |
A.W.T. |
J.R. |
|
0 |
36 |
5 |
18 |
9 |
|
1 |
24 |
5 |
20 |
14 |
|
2 |
38 |
5 |
21 |
15 |
|
3 |
28 |
4 |
16 |
9 |
|
4 |
38 |
4 |
19 |
15 |
|
5 |
24 |
5 |
20 |
11 |
|
6 |
17 |
4 |
17 |
5 |
|
7 |
26 |
4 |
14 |
9 |
|
8 |
21 |
4 |
12 |
5 |
|
9 |
18 |
4 |
13 |
5 |
|
10 |
13 |
4 |
14 |
1 |
|
11 |
39 |
4 |
19 |
13 |
|
12 |
33 |
5 |
22 |
20 |
|
13 |
20 |
4 |
20 |
16 |
|
14 |
29 |
4 |
17 |
10 |
|
15 |
38 |
5 |
21 |
18 |
|
16 |
12 |
4 |
19 |
13 |
|
17 |
38 |
5 |
20 |
15 |
|
18 |
5 |
2 |
4 |
5 |
|
19 |
13 |
4 |
11 |
4 |
■ A.R.T.
ж A.W.T.
J.R.
Fig.12. Throughput-Case 4
-
D. Traffic Intensity
Traffic Intensity is a measure of the average occupancy of a server or resource during a specified period of time, normally a busy hour.
In our experiments, we have calculated
Traffic Intensity (T.I.) = A.R.T / A.W.T, where T.I. < = 1
Idle Server = 1 – T.I. (5)
Table 12. Traffic Intensity
|
Interval |
A.R.T. |
A.W.T. |
T.I |
Idle server |
|
0 |
2 |
3 |
0.67 |
0.33 |
|
1 |
4 |
11 |
0.36 |
0.64 |
|
2 |
3 |
4 |
0.75 |
0.25 |
|
3 |
3 |
3 |
1.00 |
0.00 |
|
4 |
2 |
3 |
0.67 |
0.33 |
|
5 |
2 |
2 |
1.00 |
0.00 |
|
6 |
2 |
2 |
1.00 |
0.00 |
|
7 |
3 |
4 |
0.75 |
0.25 |
|
8 |
2 |
3 |
0.67 |
0.33 |
|
9 |
2 |
2 |
1.00 |
0.00 |
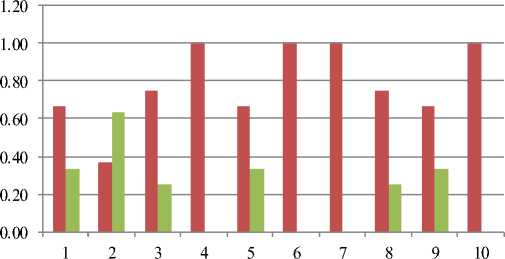
■ T.I
■ Idle server
Fig.13. Traffic Intensity and Idle Server
Above results shows the performance of proposed load balancing algorithm among web servers by using number of effective parameters such as server’s performance, utilization, traffic intensity and throughput.
-
VII. C ONCLUSION
In this paper, we have proposed a framework for load balancing in heterogeneous web server clusters. Based on the various factors which include processing capacity, memory size, expected execution time and time intervals, the jobs are distributed among different web servers and load is balanced simultaneously. Preliminary evaluation reveals that use of this algorithm is necessary to improve the performance of web servers by proper resource utilization and reducing the mean response time by distributing the workload evenly among the web servers.
We present here a cost effective framework for a distributed job processing system that adapts to the dynamic computing needs easily with efficient load balancing for heterogeneous systems. The proposed algorithm shows its efficiency in terms of server utilization, average response time, average waiting time and server’s throughput.
References Improving Performance of Dynamic Load Balancing among Web Servers by Using Number of Effective Parameters
- Ramamritham, K. and J.A. Stankovic, “Dynamic Task Scheduling in Hard Real-Time Distributed Systems”, IEEE Software, 2002. 1(3): p. 65-75.
- Konstantinou, Ioannis; Tsoumakos, Dimitrios; Koziris, Necta/8532.rios, “Fast and Cost-Effective Online Load-Balancing in Distributed Range-Queriable Systems” Parallel and Distributed Systems, IEEE Transactions on Volume: 22, Issue: 8 (2011), Pages 1350 - 1364.
- J. H. Abawajy, S. P. Dandamudi, "Parallel Job Scheduling on Multi-cluster Computing Systems," Cluster Computing, IEEE International Conference on, pp. 11, Fifth IEEE International Conference on Cluster Computing (CLUSTER'03), 2003.
- Dahan, S.; Philippe, L.; Nicod, J.-M., “The Distributed Spanning Tree Structure”, Parallel and Distributed Systems, IEEE Transactions on Volume 20, Issue 12, Dec. 2009 Page(s):1738 – 1751.
- Wei Zhang, Huan Wang, Binbin Yu,” A Request Distribution Algorithm for Web Server Cluster”, Journal of Networks, Vol. 6, No. 12, December 2011.
- Chandra, P. Pradhan, R. Tewari, S. Sahu, P. Shenoy."An observation-based approach towards self-managing web servers", Computer Communications, 2006, pp1174- 1188.
- V. Cardellini, E. Casalicchio, M. Colajanni, S. Tucci, "Mechanisms for quality of service in web clusters", Computer Networks, vol.37, No.6, 2001, pp761-771.
- Yasushi Saito, Brian N. Bershad, and Henry M. Levy. "An approximation-based load-balancing algorithm with admission control for cluster web servers with dynamic workloads", Journal of Supercomputing, vol.53, No.3, 2010, pp 440-63.
- Tiwari A., Kanungo P.,” Dynamic Load Balancing Algorithm for Scalable Heterogeneous Web Server Cluster with Content Awareness”, IEEE, 2010.
- Mehta H., Kanungo P. and Chandwani M., “Performance Enhancement of Scheduling Algorithms in Clusters and Grids using Improved Dynamic Load Balancing Techniques,” 20th International World Wide Web Conference 2011, Hosted by IIIT, Banglore at Hyderabad, 28 March-01 April 2011, pp. 385-389.
- Chen, X., Chen, H. and Mohapatra, P., “An Admission Control Scheme for Predictable Server Response Time for Web Accesses,” Proceedings of the 10th World Wide Web Conference, Hong Kong, May 2001, pp. 545-554. International Symposium on Distributed Objects and Applications (DOA 2000), Antwerp, Belgium, Sept. 2000, OMG
- Castro, M. Dwyer M., Rumsewicz, M., “Load Balancing and Control for Distributed World Wide Web Servers,” Proceedings of IEEE International Conference on Control Applications, Hawaii, USA, 22-27 Aug. 1999, pp.1614-1618.
- Priyesh Kanungo , “ Study of server load balancing techniques”, International Journal of Computer Science & Engineering Technology (IJCSET) , Vol. 4 No. 11 Nov 2013 , ISSN : 2229-3345
- Abdelzaher, T.F., Shin, K.G. and Bhatti, N., “Performance Guarantee for Web Server End Systems: A Control Theoretical Approach,” IEEE Transactions on Parallel and Distributed Systems, Vol. 13, No. 1, Jan. 2000, pp. 80-96.
- Cardellini V. et al., “The State of Art Locally Distributed Web-Server Systems,” ACM Computing surveys, Vol. 34, No.2, 2002, pp. 264-311.
- H.Mehta,P.Kanungo and M.Chandwani, “A modified delay strategy for Dynamic Load balancing in cluster and Grid Environment” International Conference on Information Science and applications, Seoul Korea, ICISa 2010(IEEE) , April 2010.
- Sandeep Singh Waraich, “Classification of Dynamic Load Balancing stratergies in a network of workstations” fifth International Conference on Information technology. Washington,USA 2008: 1263-1265.
