Improving the reliability of churn predictions in telecommunication sector by considering customer region

Author: Lian-Ying Zhou, Louis K. Boateng, Daniel M. Amoh, Andrews A. Okine
Journal: International Journal of Information Technology and Computer Science @ijitcs
Article in issue: 6 Vol. 11, 2019.
Free access
Prediction of customer churn has been one of the most interesting and challenging tasks facing most telecommunication companies recently. For the past decade, researchers together with practitioners have been working and designing models that can correctly make more accurate customer churn predictions (CCP). However, most of these models have less accuracy than expected which is hugely affecting the intended purpose. Consequently, most of these CCP models add little or nothing to the revenue growth of telecommunication industries. This work aims at improving the reliability of CCP in the telecommunication sector. To achieve this objective, a new attribute to be factored in CCP, known as the regional churn rate (RCR), is presented. Basically, RCR gives an idea about the rate of churning in a particular locality or region. Thus, a prediction model with a more accurate CCP using a support vector machine (SVM) classifier is proposed. The performance of the proposed model is critically evaluated using five metrics i.e. misclassification error, precision, recall, specificity and f-measure. At the same time, the performance of the proposed classifier (CCP with RCR) is compared with another SVM classifier which doesn’t consider RCR (CCP without RCR). Results show that the proposed model which considers the RCR of a customer’s location gives the highest accuracies for four performance metrics i.e. precision, recall, misclassification error and f-measure. Therefore, the proposed SVM-based CCP model gives a more clear indication as to whether a customer is a potential churner or not.
Classification, classifiers, customer churn prediction, customer relations management, machine Learning, support vector machines, telecommunication
Short address: https://sciup.org/15016361
IDR: 15016361 | DOI: 10.5815/ijitcs.2019.06.01
Text of the scientific article Improving the reliability of churn predictions in telecommunication sector by considering customer region
Published Online June 2019 in MECS
Since new telecom companies are emerging daily, customers have the free will to change or maintain service providers and this has become one of the biggest challenges facing most telecom companies. Customers who switch or change service providers are said to have churned. According to Wei et al. [1] churn is the change of service provider by a customer which is triggered as a result of better rates or services offered by a competitor company. In simple terms, churn means the situation whereby a customer shuns the services of a telecommunication company and decides to pitch camp with another telecom company due to better services being rendered by the new company. This situation is measured by the rate of churn using customer relationship management (CRM) tool which is considered as an important indicator for telecom companies to stay in business. The average rate of churn has been estimated by Guo-en et al. [2] to be 2.2% per month for most mobile companies. Many researchers have developed different kinds of churn prediction models to monitor and identify customers who are about to churn in order to put in place the necessary measures to retain them. These models work on the telecom company’s database in order to identify customers who are about to churn and detect them. They are then separated from the main database for the necessary retention measures to be used to retain them. Most telecom companies have a CRM system which aims at finding customers who are about to churn and uses the necessary retention strategies/measures in retaining them. In effect, CRM departments employ tactics to monitor customers’ activities in order to ensure good customer relationship and retention measures to avoid churn thereby improving the company’s services.
Newly emerging Telco’s focus on gaining new customers whiles existing telcos focus primarily on retaining their already acquired customers [3]. Again, new telecom companies have to spend more resources in acquiring new customers than what existing companies need to spend in retaining already acquired customers. It has been proven that gaining new customers is about 5-6 times costly than retaining old customers since more costly activities like manpower recruitment, discounts and promotion cost, advertisement are involved in the former. Customers who pay less attention to competitive service providers are termed as loyal customers of that service provider and even provide more income/revenue to that particular service provider and are less expensive to keep and in turn convince their family members or acquaintances to join that particular service provider which also increases the company’s income. The main motive of most telecom industries globally is to gain a targeted number of customers in order to meet their revenue objectives. However, churning brings about loss in the number of customers which in turn affects their projected incomes.
The implementation of well-calculated steps in retaining existing customers by telecom companies can result in an increase in their income/profit. Most customer prediction and retention models aims at studying a company’s database and identify customers who have churned or about to churn and their reasons so that the necessary retention measures can be developed in order to avoid the company’s profit loss [4]. Most customer churn prediction (CCP) models focus on the global details of customers without considering their specific region and its effects on the customer during prediction of churn which most at times doesn’t yield accurate results. Perhaps certain local factors can influence or restrict customer churn. For example, some customers may find themselves in a demographic area where they have no option than to stick to only one service provider in order to gain good service quality.
The aim of this research is to improve the reliability of CCP in telecommunication sector by including the churn behavior in a customer’s region as an attribute to train a support vector machine (SVM) for classification. SVM is used in this study because of its effectiveness in the classification of churn when compared with other classification tools like logic regression, artificial neural network, decision tree etc. [5]. An SVM based approach using the polynomial kernel function and a new attribute, known as the regional churn rate (RCR) are considered in this study. The RCR gives an idea about the rate of churning in a particular locality or region. This enables the SVM classifier to learn the local churn pattern of customers in a particular region. RCR is derived from the dataset used for training and testing the classifier. In four out of five metrics, the proposed CCP model outperforms another model which does not include RCR.
The rest of the paper is structured as follows: section II gives a review of some works related to CCP schemes; section III describes the materials and methods used including an overview of support vector machine, the enhanced churn prediction approach as well as the experimental setup for performance evaluation; results and discussion are presented in section IV, and the paper is concluded in the last section V.
II. Related Works
The challenges of churn has been taken up by most researchers in various fields of life such as banking, telecommunication, insurance, hospitals and so on [6]. Fig. 1 is an illustration of the phenomenon of customer churn and its prediction approach. Most researchers have done a lot of works on churn since it emerged and a lot of techniques have been proposed as a result to tackle the problems of churn [7-10]. The most commonly used ones are SVM, decision tree, artificial neural networks (ANN), logistic regression, and so on. For instance, Archaux et al. used SVM and ANN to detect churners among prepaid mobile users and compared the results [11]. Hung et al [12] employed a hybrid approach by combining decision tree and neural network as classification methods and k-means as cluster to predict churn in a wireless telecommunication company. Anuj Sharma et al. [13] predicted customer churn in cellular wireless services using a neural network based approach with a churn accuracy of over 92%. In [14], Amin A. et al. made use of rough set theory as one-class classifier and multi-class classifier to make it easier in the selection of an effective classification model for CCP. Idris et al. [15] detected likely churners in a mobile telecommunication by using the combination of root boost, random forest, rotation forest and decorate ensembles. On the other hand, data segmentation and past prediction of customers were used by Vadakattu R. et al. [16] to increase the precision of customer churn predictions. Dasgupta et al. [17] used the time interval without any active services like incoming and outgoing calls by a customer to predict churn while Mozer et al [18] focused on comparing various machine learning and classification algorithms and techniques to analyze subscriber’s usages, billing and data.
In studying their buying patterns customer behaviors has been found to be influenced by social relationships [19]. As a result, Richter et al. [20] predicted churn using social factors by grouping the subscribers into social groups based on their call records and predicting churn separately for each group. A logit leaf model (LLM) for data classification was proposed by Caigny et al [21]. This kind of proposed algorithm was divided into two parts:
-
• A segmental phase where there is identification of customer segment using decision rules and
-
• A prediction phase in which a model is created for each leaf on the tree. The outcome shows that LLM outperformed other prediction models.
Recently, Umayaparvathi et al. [22] wanted to find out the best among these CCP techniques by using decision tree, SVM and neural networks. SVM technique was found to be the best among them. SVM was previously used by Guo-en et al to avoid structural risks and improve CCP accuracy rate even with more attributes [2]. Subsequently, Coussement et al. [23] predicted churn in newspaper subscriptions by using SVM approach to construct a churn model. An SVM based Area under the curve (AUC) method (SVMauc) was proposed by Niccolo et al. [24] for CCP in which SVMauc parameterselection was employed for the prediction of churn. The outcome showed that, the generalization performance and the parameter-selection was optimized by SVMauc which improved the prediction performance. A meta-heuristic based approach was used for CCP by Ammar et al [25] in which a hybridized form of firefly algorithm approach was used as a classifier. The highest light intensity of every firefly was compared with each other to find out which one has the highest light intensity. This algorithm provided more accurate results. H. Li et al. [26] used a dedicated distributed cloud infrastructure that integrates both online and offline capabilities to leveragethe power of big data to solve the problem of subscriber churn.
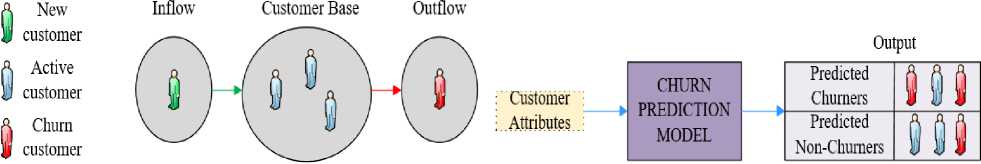
(a) (b)
Fig.1. Illustration of the customer churn (a) phenomenon (b) prediction approach and potential outcomes
III. Materials and Methods
In this section, the method used for churn prediction is presented. We initially explain the theory behind SVM as a theoretical basis for its application in the proposed prediction scheme. Moreover, an enhanced approach to CPP using SVM is discussed and the experimental setup for the performance evaluation is presented.
-
A. Support vector machine (SVM)
Consider a classification task that divides the data into training and test sets. Each instance in the training set contains a class label and several corresponding characteristics or attributes. In SVM, the goal is to create a model from the training data that can predict the class label of each independent instance in the test data according to their properties or attributes. Let (x ,y ),i = 1,..., l be a training data set, where nl x ∈ R andy ∈ {1,-1} . n is the number of attributes of each input x , y is the class label of input xi and l is the number of training points [27]. Supposing the data is linearly separable, a hyperplane of the form described in the equation below can be used to separate the two classes:
w . x + b = 0 (1)
where w is a weight vector, x is input vector and b is bias [28]. The support vectors are the data points in the training set closest to the hyperplane. SVM finds the optimal hyperplane so that the separation between this hyperplane and the support vectors is maximized. Removing any of the support vectors would change the position of the optimal separating hyperplane, because they form the critical elements of the training set. The solution of the following optimization problem is required, in order to apply SVM to classify each instance in the testing data as shown in (2):
1T min w w + C ∑ ξ(2)
w , b , ξ 2 i = 1 i
T
Subject to y (w ϕ(x ) + b) ≥ 1 -ξ where ξ ≥ 0 ii ii
φ is a function which maps the training vectors xi into a higher dimensional space such that SVM finds a linear separating hyper plane with the maximal margin between the classes in this space. C > 0 is a regularization parameter of the error term [29]. ξ i is a positive slack variable which is applied to enable SVM handle data that is not completely linearly separable.
Kernel functions: Instead of using the original input attributes x in SVM, some features φ ( xi ) may rather be applied to get SVMs to learn in the high dimensional feature space [30]. Considering a feature mapping φ , the corresponding Kernel can be defined mathematically as shown in (3) as:
T
K ( xi , xj ) = ϕ ( xi ) ϕ ( xj ) (3)
K ( xi , x j ) is a measure of the similarity between φ ( xi ) and φ ( xj ), and consequently between the two independent attributes, xi and x . SVM performs predictions using a linear combination of kernel basis functions. The kernel defined by the function in (3) is called linear kernel and can work perfectly for linearly separable data. When the data is not completely separable linearly, non-linear SVM kernels such as the polynomial kernel are needed. The polynomial kernel is defined as shown in (4)
K ( xi , Xj ) = ( Y XiTXj + r ) d , Y > 0 (4)
where у , r and d are the parameters defining the kernel’s behavior [31].
Classification score: The SVM classification score for classifying instance x is the signed distance from x to the decision boundary ranging from -да to + да . A trained SVM has a scoring function which computes a score for a new input. Basically, an SVM is a binary classifier which classifies an input as belonging to the class yj = - 1, if the output of the scoring function is negative or classifies it as belonging to class yj = 1 , if the output of the scoring function is positive. The positive class classification score f ( x ) is the trained SVM classification function or the score for predicting x into the positive class and is given by (5) [32]:
s f (x) = X ajyjK(xj, x) + b (5)
j = 1
th where aj is the coefficient associated with the i training example, s is the number of data points in the training set and xi , yi represent the ith training example. K( xj , x ) is the dot product in the predictor space between input vector x and the support vectors, and the sum includes the training set observations. The negative class classification score for x , which predicts x into the negative class is - f ( x ).
-
B. An Enhanced Churn Prediction Approach
Since the emergence of new mobile telecom companies recently, most customers pay attention to some factors which can easily influence them to churn in their region due to the availability of different telecom companies. Customers pay attention to different factors such as competition from other service providers, service quality of their service provider, customer satisfaction, customer demographics i.e. income, education level, gender, product and services from their providers, the technology orientation of their competitors etc. These factors in a customer’s region may influence its tendency to churn or remain with a mobile network operator. For example, in a given region, there may be one or two available mobile operators. In such a case, if both networks provide poor services or one network even provides a poorer service then the tendency of customers to churn to-and-fro may be reduced. Therefore, the reputation and competitiveness of service providers in a local area could motivate churning. Perhaps, another important factor that may affect churn behavior is the income levels of customers in a geographical area. When disposable income levels are high, customers can afford to switch to a mobile network operator with better services even though it may be more expensive using that network. Clearly, the region where a customer is based cannot be neglected with regards to the factors that inspire churning.
In this paper, we factor the region or state where a customer resides to improve the reliability of churn predictions. To this end, we define a new attribute concept called the regional churn rate (RCR). RCR is the proportion of customers who churn for a particular region or locality in a given data set as given by (6) below:
RCR =
N cns
N csd
where N is the number of churners in a given state cns which can be evaluated from the dataset prior to training and N is the number of customers from that state or csd region in the dataset. Therefore, while the other attributes will enable SVM learn the global pattern of churn behaviors and influencers, RCR will allow SVM to learn the local churn pattern of customers in a particular state or region. SVM is trained using a data set of customers’ attributes including the RCR and class labels (churn or non-churn) so that it can make improved customer churn predictions based on randomly distributed testing data.
-
C. Experimental Setup
It is challenging to acquire actual telecommunication datasets for modeling. However, there are publicly available datasets for data analysis. The University of California, Irvine datasets repository provides accurate datasets for research purpose. For this study, we obtained the telecom dataset which has 3333 subscribers with 21 variables each [33]. Churn to non-churn customers in the dataset are 483 (14.49%) and 2850 (85.5%) respectively. Series of experiments are conducted on the dataset using MATLAB toolkit to evaluate the model performance. It is very important to preprocess the dataset before experiments can conducted on them. The approach used in preprocessing the dataset used in this study is as follows:
-
• Unique attributes such as customer ID are ignored since they only serve for information purposes.
-
• Categorical values are normalized by converting “yes and no” into “1s and 0s”. The dataset used in this study contains no missing values so no deletion or imputation of data points was performed.
-
• Oversampling was performed on the training set by duplicating the minority class (churn) to obtain almost equal number of minority to majority class.
The motive of splitting dataset into training and test sets in machine learning is to ensure that the developed prediction model remembers the instances it was trained on and to perform well on unseen instances. Adnan et al. [10] introduced a distance factor approach for sampling training and test sets. The proposed plan group datasets into two different zones (i.e. high and low certainty). With this technique, the training sample size with better accuracy can be selected or giving priority. In this study, we implement the distant factor procedure by randomly sampling (70 - 80) % training set and (30 - 20) % test set for the learning process. Feature selection was performed using Weka attribute evaluator and the selected attributes are shown in Table 1.
Table 1. Selected attributes and description
|
Attribute |
Description |
|
CustSer_calls |
Number of calls made to customer care center |
|
Intl_Plan |
If a customer has international plan or not |
|
Day_Charge |
Day time call charges issued to a customer |
|
Day_Mins |
Daytime minutes used by the customer |
|
Intl_Charge |
Intl call charges issued to a customer |
|
Intl_Mins |
Minutes of calls made whiles abroad |
|
VMail_Plan |
If a customer has voice mail plan or not |
|
VMail_Msg |
Number of voice mail messages |
|
Intl_Calls |
Daytime minutes used by the customer |
|
Eve_Mins |
Evening time minutes used by the customer |
|
Eve_ Charge |
Evening call charges issued to a customer |
|
RCR |
Proportion of customers who churn in a customer’s region/locality based a given dataset |
|
Churn? |
1 for churners and 0 for non-churners |
IV. Results and Discussion
This section explains the performance of the proposed classifier herein denoted as CCP with RCR, and its comparison with a traditional CCP classifier herein denoted as CCP without RCR, by evaluating the outcome of various performance measure functions. CCP with RCR adds the regional churn rate (RCR) as an attribute in the data set. Obviously, CCP without RCR does not include the RCR as an attribute. The results of each performance metric (Misclassification error, Precision, Recall, Specificity and F-Measure) are discussed alongside each graph.
-
A. Misclassification Error Results
Fig. 2 shows the misclassification error results of both SVM-based classifiers in predicting both churn and nonchurn customers. It is seen that both classifiers exhibit different results with different sample training sizes. Moreover, CCP with RCR has its lowest misclassification error of 0.074 using a sampling training size of 0.79 and also has its highest misclassification error of 0.086 using a sample size of 0.77 whiles CCP without RCR also has its lowest misclassification error of 0.092 using a sample training size of 0.73 and has its highest misclassification of 0.10 using a sampling training size of 0.8. Results reveal that CCP with RCR obtained the minimal misclassification error, and hence the maximal prediction accuracy, since it has the lowest false classification instances by including information on the local pattern of churn behaviors in the training process. This best performance is obtained with a training to test ratio of
79:21.
-
B. Precision Results
This section talks about the number of correctly predicted churns over the total number of churns predicted by the both classifiers. In general, the number of correctly predicted churn increases and decreases for both classifiers at the same sample training sizes as the sample training sizes increases. From Fig. 3 CCP with RCR has the highest precision of 0.78 using a sample training size of 0.79 and has a lowest precision of 0.74 using a sampling training size of 0.77 whereas CCP without RCR has a highest precision of 0.76 using a sample training of 0.73. From the Fig. 3, it is evident that CCP with RCR obtains the highest precision using a larger sample training size whiles CCP without RCR obtained the highest precision using a smaller sample training size. This implies, as the sample training size increases, CCP without RCR gives more inaccurate predicted churns. Fig. 3 also shows that CCP with RCR gives a more correctly predicted churn than CCP without RCR at a training to test ratio of 77:23.
-
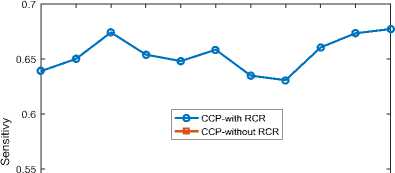
C. Sensitivity Results
The performance of the two classifiers is also measured in terms of the fraction of churn customers who are correctly identified as true churners. Based on Fig. 4, both classifiers have a zigzag trend in precision, indicating a certain non-linear relation between the sample training size and precision. Clearly, both classifiers increase and decrease at some point and exhibit different performance at different sample training sizes. Nevertheless, CCP with RCR has the highest sensitivity of 0.68 using a sample training size of 0.8 and its lowest sensitivity is 0.63 using sample training size of 0.77 whiles CCP without RCR also has its highest sensitivity of 0.53 at a sample training size of 0.73 and a lowest sensitivity of 0.47 using a sample training size of 0.76. Fig. 4 depicts that even the lowest sensitivity of CCP with RCR is far greater and better than the highest sensitivity of CCP without RCR, since the later does not consider the churn behavior at a given region or area. Fig. 4 also demonstrates that CCP with RCR best correctly identifies true churners as compared to CCP without RCR with training to test ratio of 77:23.
-
D. Specificity Results
We also measure the accuracy of both classifiers with reference to the fraction of true non-churn customers who are correctly identified in this section. It is observed from Fig. 5 that both classifiers identify non-churn customers with high accuracy irrespective of the sample training size. Although CCP without RCR has the highest accuracy in identifying true non-churn customers, with sample training size of 0.74, its accuracy generally decreases as the training size increases. Besides, the cost of not identifying true-non customers does not necessarily affect the revenue projections of telecom firms since any unidentified non-churn customer actually stays with his or her network. When the training size is increased, the specificity of CCP with RCR increases. Again, CCP with RCR also has a lowest specificity of 0.9604 using sample training size of 0.79 whiles CCP without RCR also has a highest specificity of 0.9718 and a lowest specificity of 0.966 using a sample training size of 0.72. It is also observed from Fig. 5 that CCP with RCR has its lowest specificity at the same level as the highest specificity of CCP without RCR when the training to test ratio is 79:21.
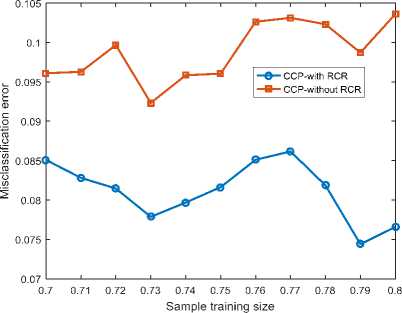
Fig.2. Misclassification error against sample training size

Fig.3. Precision against sample training size
-
E. F- Measure Results
0.45 -----------------111111111-----------------
0.7 0.71 0.72 0.73 0.74 0.75 0.76 0.77 0.78 0.79 0.8
The two classifiers are finally compared in terms of the f-measure i.e. the weighted average of the precision and sensitivity. In this way, f-measure is used to compute the test accuracy of both classifiers. Results in Fig. 6 clearly show that CCP with RCR outperforms CCP without RCR for all training sizes considered. In addition, the f-measure of CCP with RCR generally increases as the training size is increased while the f-measure of CCP without RCR generally decreases when the training size is increased. This indicates that a tactful consideration of the local pattern of churn behavior can help to better identify churn customers in randomly generated data sets. It should be noted that as training size increases the testing size reduces. Therefore, we can deduce that even when the test size reduces the f-measure of CCP with RCR is not affected since it is better trained to make more precise classifications. Results further reveal that CCP with RCR has its highest f-measure of 0.722 using training to testing ratio of 0.79:0.21. Meanwhile, CCP without RCR has its highest f-measure of 0.625 at training to testing ratio of 0.73:27.
V. Conclusion
In this paper, we propose a more accurate CCP classifier based on support vector machine (SVM) which considers the regional churn rate (RCR) of customers in a particular region as an attribute in its dataset. Using different performance metrics, the performance of the proposed classifier (CCP with RCR) is compared with another SVM classifier which doesn’t consider RCR (CCP without RCR). The outcome from most performance metrics indicated that CCP with RCR obtained the best accuracy in correctly predicting customer churn/non churn as compared with CCP without RCR. The performance was measured in terms of misclassification, precision, recall, specificity and f-measure with different sample training sizes. From the findings, it is clear that our model can make more accurate customer churn predictions from different datasets. Therefore, our model is a more accurate CCP model which can aid service providers to predict potential churn customers and apply the necessary retention measures to prevent them from churning. Future works should consider adding more local attributes of the various customers in order to obtain more accurate and precise CCP.
Sample training size
Fig.4. Sensitivity against sample training size
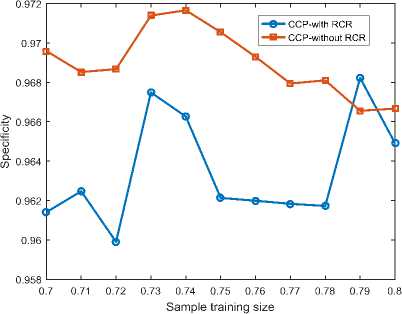
Fig.5. Specificity against sample training size
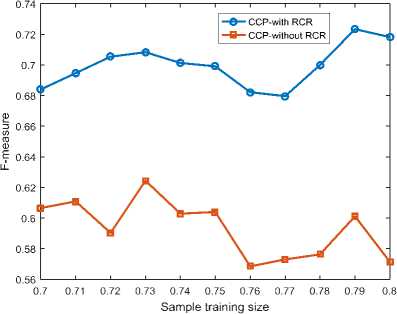
Fig.6. F-measure against sample training size
References Improving the reliability of churn predictions in telecommunication sector by considering customer region
- Ibitoye, A.O., O.F. Onifade, and C.O. Yinka-Banjo. Dealing with the paradoxes of customer opinion for effective decision support in churn management. in Challenges and Opportunities for Knowledge Organization in the Digital Age. 2018. Ergon-Verlag.
- Halibas, A.S., et al. Determining the Intervening Effects of Exploratory Data Analysis and Feature Engineering in Telecoms Customer Churn Modelling. in 2019 4th MEC International Conference on Big Data and Smart City (ICBDSC). 2019. IEEE.
- Xia, G.-e. and W.-d. Jin, Model of customer churn prediction on support vector machine. Systems Engineering-Theory & Practice, 2008. 28(1): pp. 71-77.
- Mahajan, V., R. Misra, and R. Mahajan, Review of data mining techniques for churn prediction in telecom. Journal of Information and Organizational Sciences, 2015. 39(2): pp. 183-197.
- Lin, C.-S., G.-H. Tzeng, and Y.-C. Chin, Combined rough set theory and flow network graph to predict customer churn in credit card accounts. Expert Systems with Applications, 2011. 38(1): pp. 8-15.
- Brandusoiu, I. and G. Toderean, Churn prediction in the telecommunications sector using support vector machines. Margin, 2013. 1: pp. x1.
- Hu, H., et al. Community based effective social video contents placement in cloud centric CDN network. in 2014 IEEE International Conference on Multimedia and Expo (ICME). 2014. IEEE.
- Zhu, B., B. Baesens, and S.K.L.M.V. Broucke, An empirical comparison of techniques for the class imbalance problem in churn prediction. Information Sciences, 2017. 408: pp. 84-99.
- Wang, B., et al., Integration of Unsupervised and Supervised Machine Learning Algorithms for Credit Risk Assessment. Expert Systems with Applications, 2019.
- Kumar, S. and M. Kumar. Predicting Customer Churn Using Artificial Neural Network. in International Conference on Engineering Applications of Neural Networks. 2019. Springer.
- Amin, A., et al., Customer churn prediction in telecommunication industry using data certainty. Journal of Business Research, 2019. 94: pp. 290-301.
- Archaux, C., A. Martin, and A. Khenchaf. An SVM based churn detector in prepaid mobile telephony. in Proceedings. 2004 International Conference on Information and Communication Technologies: From Theory to Applications, 2004. 2004. IEEE.
- Hung, S.-Y., D.C. Yen, and H.-Y. Wang, Applying data mining to telecom churn management. Expert Systems with Applications, 2006. 31(3): pp. 515-524.
- Sharma, A., D. Panigrahi, and P. Kumar, A neural network based approach for predicting customer churn in cellular network services. arXiv preprint arXiv:1309.3945, 2013.
- Amin, A., et al. Customer churn prediction in telecommunication industry: With and without counter-example. in Mexican International Conference on Artificial Intelligence. 2014. Springer.
- Idris, A., A. Khan, and Y.S. Lee, Intelligent churn prediction in telecom: employing mRMR feature selection and RotBoost based ensemble classification. Applied intelligence, 2013. 39(3): pp. 659-672.
- Vadakattu, R., et al. Enterprise subscription churn prediction. in 2015 IEEE International Conference on Big Data (Big Data). 2015. IEEE.
- Dasgupta, K., et al. Social ties and their relevance to churn in mobile telecom networks. in Proceedings of the 11th international conference on Extending database technology: Advances in database technology. 2008. ACM.
- WOLN, I., Predicting subscriber dissatisfaction and improving retention in the wireless telecommunications industry. IEEE Transactions on Neural Networks, 2000. 11(3): pp. 690-696.
- Yang, J., X. He, and H. Lee, Social reference group influence on mobile phone purchasing behaviour: a cross-nation comparative study. International Journal of Mobile Communications, 2007. 5(3): pp. 319-338.
- Richter, Y., E. Yom-Tov, and N. Slonim. Predicting customer churn in mobile networks through analysis of social groups. in Proceedings of the 2010 SIAM international conference on data mining. 2010. SIAM.
- De Caigny, A., K. Coussement, and K.W. De Bock, A new hybrid classification algorithm for customer churn prediction based on logistic regression and decision trees. European Journal of Operational Research, 2018. 269(2): pp. 760-772.
- Umayaparvathi, V. and K. Iyakutti, A Survey on Customer Churn Prediction in Telecom Industry: Datasets, Methods and Metrics. International Research Journal of Engineering and Technology (IRJET), 2016. 4(4): pp. 1065-1070.
- Coussement, K. and D. Van den Poel, Churn prediction in subscription services: An application of support vector machines while comparing two parameter-selection techniques. Expert systems with applications, 2008. 34(1): pp. 313-327.
- Gordini, N. and V. Veglio, Customers churn prediction and marketing retention strategies. An application of support vector machines based on the AUC parameter-selection technique in B2B e-commerce industry. Industrial Marketing Management, 2017. 62: pp. 100-107.
- Ahmed, A.A. and D. Maheswari, Churn prediction on huge telecom data using hybrid firefly based classification. Egyptian Informatics Journal, 2017. 18(3): pp. 215-220.
- Li, H., et al., Enhancing telco service quality with big data enabled churn analysis: infrastructure, model, and deployment. Journal of Computer Science and Technology, 2015. 30(6): pp. 1201-1214.
- Huang, J., F. Di Troia, and M. Stamp. Acoustic Gait Analysis using Support Vector Machines. in ICISSP. 2018.
- Teixeira, F., et al., Classification of Control/Pathologic Subjects with Support Vector Machines. Procedia computer science, 2018. 138: pp. 272-279.
- Yin, S., et al. PCA and KPCA integrated Support Vector Machine for multi-fault classification. in IECON 2016-42nd Annual Conference of the IEEE Industrial Electronics Society. 2016. IEEE.
- Al-Mejibli, I.S., et al. Performance Evaluation of Kernels in Support Vector Machine. in 2018 1st Annual International Conference on Information and Sciences (AiCIS). 2018. IEEE.
- Guenther, N. and M. Schonlau, Support vector machines. The Stata Journal, 2016. 16(4): pp. 917-937.
- Gillani, Z., et al., CompareSVM: supervised, Support Vector Machine (SVM) inference of gene regularity networks. BMC bioinformatics, 2014. 15(1): pp. 395.
- Amin, A., et al., Customer churn prediction in the telecommunication sector using a rough set approach. Neurocomputing, 2017. 237: pp. 242-254.
