Improving the serviceability of a prepaid autorickshaw counter using queuing model: an optimization approach

Author: Abhishek S. Rao
Journal: International Journal of Information Technology and Computer Science @ijitcs
Article in issue: 12 Vol. 9, 2017.
Free access
Overcharging the passengers who are not familiar with the city for the services in railway stations and airport is a serious problem which can be addressed by installing prepaid counters. Prepaid counters encounter the problem of higher passenger frequency due to which the waiting time increases. The only alternative solution to this problem is queue formation for effective service. In most of the cases, only one counter for service is available due to which the queue length increases; thereby the passengers may lose patience and move away which may lead to the loss to the counter. In this paper, queuing model is used to solve this real case scenario in an optimal way. The experimental data were obtained from the counter and derived using Little’s Theorem and Single Server Queuing Model (M/M/1). Hence an attempt was made in studying the benefits of queuing model and optimizing it to minimize the waiting time thereby increasing the profit. This approach will help a busy prepaid autorickshaw counter to give service to passengers in a most feasible way.
M/M/I Single Server Queuing Model, Queuing Theory, Little’s Theorem, Queue Optimization, Prepaid Counter
Short address: https://sciup.org/15016215
IDR: 15016215 | DOI: 10.5815/ijitcs.2017.12.03
Text of the scientific article Improving the serviceability of a prepaid autorickshaw counter using queuing model: an optimization approach
Published Online December 2017 in MECS DOI: 10.5815/ijitcs.2017.12.03
Local authorities in concern with the railway department help in arranging prepaid auto services for the benefit of passengers in railway station. The advantages of the system are:
-
1. Fair information in the receipts which will help the unfamiliar passengers in the city.
-
2. Chances of overcharging or change not returning by the auto drivers does not come in to picture as there is no cash transaction between the passenger and the auto driver.
-
3. The problems of tampered meters can be overcome as there is no auto meter coming in to picture.
-
4. Fastest or shortest path will be chosen by the auto driver since the fare is fixed and he can’t over
charge.
In single server system used in railway stations, waiting time in the queue is a serious problem encountered by the passengers. Passengers may leave the queue at times due to discomfort as a result of delayed service or increased waiting time. Queuing theory mainly deals with analyzing the problems involved in a queue and optimizing it. Considering the issue encountered in a queue in a railway station, this paper attempts to optimize the service facility and time of service at the counter by queuing theory for prepaid autorickshaw service to solve a real case scenario.
On a daily basis, the prepaid autorickshaw counter serves over 900 passengers during weekdays (Monday to Friday) and over 1200 passengers during weekends (Saturday to Sunday).
-
II. Related Works
Queuing theory has been previously used to model restaurant operations [1, 3], Bank ATM [2, 4], Multi Server Specialty Hospital [5] to increase the efficiency of the system by reducing the cycle time in a busy schedule. Service cost and waiting cost are the two major cost associated with queuing systems which needs to be addressed. Hence researchers are trying to analyze the queuing problems and give optimal solutions for various systems with the help of queuing model. Queuing model gives suggestions thereby help in decision making about number of service facilities, waiting time and hence the associated cost [4, 5]. [1] In this paper, author tried solving the waiting line problem faced by customers in a restaurant by using queuing model. This approach minimized the customer withdrawal and going to competitors doors thereby helping the restaurants. [6] In this paper, author tried investigating the use of multiserver queuing model for a tele-talk customer care center which helped in determining optimal service rate in order to measure the number of servers. [7] In this paper, author tried investigating a case study on application of queuing model to patient flow in emergency department which is usually over crowded. The model gave a good relationship between resources and waiting time to find solution for a better understanding. [8] In this paper, author gave an overview about how queuing model can be applied in our day to day life. [9] In this paper, author reviewed the queuing congestion in small enterprise like grocery store and developed queuing model which was suitable for the system. [12] In this paper, author analyzed the use of monte-carlo simulation and its application for automated teller machine. The study investigated on parameters like arrival time, service time of each customers and waiting time during off peak and peak hours. [10, 11] highlighted on the importance of improvising the service time to avoid losing customers in a bank ATM using queuing model. [12] In this paper, author investigated the use of queuing theory for multi stage production line application. [13] In this paper, author investigated the use of simulation technique for automated teller machine facility using queuing model which facilitated the reduction in time and costs to go to bank thereby satisfying customer needs. [14] In this paper, author explained the basics about queuing theory and its applications in operations research. [15] In this paper, author investigated a case study on outpatient department at Anglo Gold Ashanti Hospital, Ghana where the queuing problem was solved using queuing theory and modeling. [16] In this paper, author studied on optimization of ATM service by using queuing theory. [17] In this paper, author investigated a case study on solving waiting line model in a bank using queuing model. The study used multiple channel queuing models with exponential service times and poisson arrival. [18] In this paper, author gave an overview on queuing theory and its applications. [19] In this paper, author investigated the use of queuing theory applications for bank service and its optimization. This study helped in improving the efficiency of queuing system by reducing the customer queuing time thereby satisfying him. [20] In this paper, author investigated the use of queuing theory for toll way which would help in solving a real time problem for drivers as they have to wait for long time due to inefficient collection systems. This study would thereby help in reducing queuing time by giving efficient solution. [21] In this paper, author investigated the use of smart queue management system for banking sector with the help of SMS notifications. [22] In this paper, author analyzed the use of M/M/C queuing model for reducing waiting time for customers in bank sectors. [23] In this paper, author investigated on parameters like average service time, average waiting time and average idle time at a cash counter for a busy restaurant using queuing model thereby minimizing balking of customers. [24] In this paper, author investigated on a case study of a restaurant using queuing model. This study helped in reducing queuing time thereby satisfying the customers.
From the literature review, it is evident that major applications of queuing model are in the field of banking, restaurants, ATM, Hospitals etc. Hence the present study investigates the use of queuing model for improving the serviceability of prepaid auto rickshaw counter thereby helping the out station customers to achieve reliable service. [25] In this paper, author highlighted on reducing the inconvenience cost to the patients waiting in a queue in hospitals by using Multi Server Queuing Model. The model adopted for reducing the waiting time in a queue was (M/M/C): (∞/∞/FCFS)-Multi Server Queuing Model. The study was carried out at 23 teaching hospitals in Nigeria and after analyzing various parameters which had an impact on out-patient department, it was concluded that congestion, average queue length and waiting time of patients in the queue could be reduced when doctors increase their capacity levels at a total minimal cost.
-
[26] In this paper, author focused on waiting time of customers in a bank for services like withdrawal and cash savings. Data was continuously collected for 21 days and analyzed using m/M/1 Queuing model. From the results obtained, it could be concluded that by using queuing model better services could be provided to the customers. [27] In this paper, author focused on banking problems and investigated the use of two different models to solve it. Models like M/M/1/∞: FCFS and M/M/Z/∞: FCFS and compared the results. Optimization model was established and later the optimum queuing model was calculated. Efficiency related to optimal number of service stations was then calculated. The present study could improve the optimal service rate, service station number and queuing number which have improved the customer satisfaction thereby proving the feasibility of the model. [28] In this paper, author highlighted the use of simulation and queuing analysis in solving real time problems. The paper stressed on various means to improve the queue in order to maximize profits and improve business.
-
III. Queuing Theory
Queuing theory is a subfield of mathematics which can be applied for waiting line systems to predict and evaluate system performance. The components of the queuing process are: The arrival process, Queue or waiting line, Service process and departure as shown in Fig. 1.
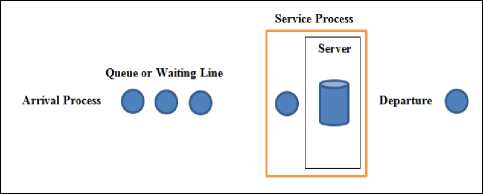
Fig.1. Components of a Queuing System
The characteristics of a service system are number of servers, the number of waiting lines, the server arrangement, the service patterns based on arrival, and the priority rules for service.
The number of passengers waiting in a queue, number of passengers waiting in a system, time spent by the passengers in a queue, time spent by the passengers in a system, rate at which the system is utilized were the important performance measures used in waiting line system. In the present study, I have calculated the performance measures for the single-server waiting line model.
Kendal’s notation for representing queuing models is discussed below:
Generally Queuing model may be completely specified in the following symbol form: (a*| b* | c*) : (d* | e*) where a* = Law of probability for the arrival.
b* = Law of probability according to which passengers are served.
c* = Count of service stations.
d* = Capacity of the system.
e* = Queue discipline.
-
A. Little’s Theorem
The relationship between average queuing length, average waiting time in a queue and average arrival rate can be described by Little’s Theorem.
Little’s Theorem states:
L=XT (1)
Where L is the average queue length of passengers, average queuing time spent by a passenger (T) and λ is the average queue arrival rate.
Three basic relationships that can be obtained from Little’s theorem:
-
• L is directly proportional to λ and T
-
• X is directly proportional to L and inversely proportional to T
T is directly proportional to L and inversely proportional to X
-
IV. Prepaid Autorickshaw Queuing Model
The experimental data was obtained from Prepaid Autorickshaw counters after interviewing the manager. Data was also collected through observations made at the counter. The number of passengers on a daily basis was obtained from the counter. Data recording was a part of daily routine in the counter. Interview with the manager helped me in concluding that the queuing model that illustrates the operation of Prepaid Autorickshaw counter in a better way is M/M/1 model.
The assumptions made for M/M/1 model are as follows:
-
• Infinite number of passengers coming from a population is patient.
-
• The population arriving at the counter is infinite. The mean arrival rate ( X) of the passengers is described by Poisson distribution. An average of 1/ X is the mean of time between two successive passengers which follows an exponential distribution.
-
• The mean service rate for a passenger is defined by a Poisson distribution (µ). An average of 1/ µ is the mean of time for a passenger which follows an exponential distribution.
-
• First-come, First-served is given utmost priority as per waiting line rule.
The assumptions of M/M/1 model were considered to calculate the operating features of a queuing system by the following formulas:
-
X: mean arrival rate of passengers(2)
ц: mean service(3)
p=X/^: System utilization rate on an average(4)
L=X / (ц - X): average queue length of passengers (5)
Lq=pL: number of passengers in a queue on an average (6)
W = 1 1 (ц - X): time spent by the passenger in the counter on an average.
W q = pW: time spent by the passenger in a queue on an average.
Pn = (1 - p) p n : probability that ‘n’ passengers are in the counter at a given instant of time.
P0 = 1 - p: probability of zero passengers in the counter.
-
V. Observation and Discussion
Table 1 shows the one month daily passenger data which was shared by the manager during peak time (3:30 PM to 7:30 PM). The one month daily passenger and total passenger count are shown in Fig. 2. and Fig. 3. respectively.
Table 1. Monthly Count of Passengers
|
Week / Day |
Mon |
Tue |
Wed |
Thu |
Fri |
Sat |
Sun |
|
1st Week |
225 |
200 |
210 |
240 |
260 |
280 |
305 |
|
2nd week |
220 |
205 |
218 |
235 |
270 |
290 |
312 |
|
3rd Week |
195 |
220 |
200 |
252 |
290 |
300 |
327 |
|
4th Week |
215 |
230 |
250 |
240 |
280 |
295 |
320 |
|
Total |
855 |
855 |
878 |
967 |
1100 |
1165 |
1264 |
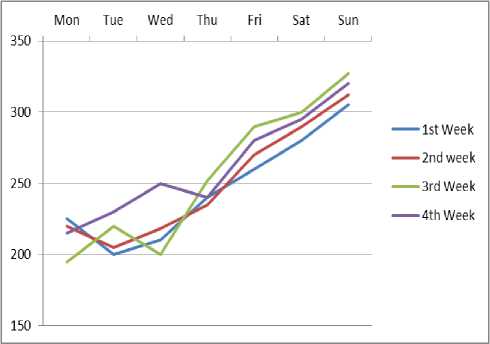
Fig.2. One Month Daily Passenger Count
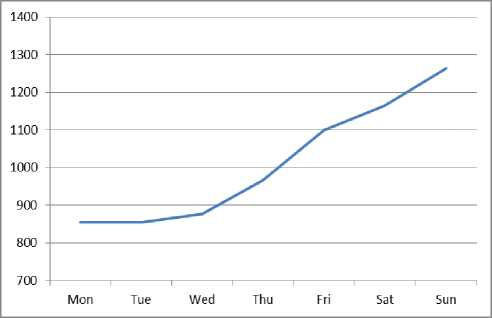
Fig.3. One Month Total Passenger Count
Fig. 3 clearly shows that the number of passengers on weekends was much more compared to the passengers during weekdays. Since weekends were the busiest days for the counter, this time period was selected as an important criteria for the research.
-
A. Calculation
77.78%
During the weekends, an average of 70 passengers comes to the prepaid counter on an hour time basis. From this the arrival rate can be derived as:
From the observations made after discussing with the manager, it was noted that an average time of 3 minutes was spent by the passenger in the counter (W), the average people queue length and the time spent by them in a queue were noted to be around 20 people (Lq) and 15 minutes respectively. Using equation (8) it was seen that the theoretical waiting time and observed waiting time did not show much difference.
The average number of passengers in the prepaid counter was then calculated using equation (1).
After calculating the average number of passengers in the prepaid counter, the utilization rate and the service rate was then derived using equation (5).
µ = λ (1 + L)/L = 1.16 ( 1 + 3.48) / 3.48 = 1.50 ppm.
Hence, ρ = λ/μ = 1.16 ppm / 1.49 ppm = 0.778, or
With a higher utilization rate of 0.778 , the probability of zero passengers in the prepaid counter is negligible which can be derived using equation (10).
Generic formula was then used to calculate the probability of having ‘ n’ passenger in the prepaid counter:
Certain assumptions were made like annoyed passengers will move away from the queue when more than 10 passengers are standing in a prepaid counter, a maximum queue length of 25 people can be tolerated by a patient passenger. The capacity of a prepaid counter is 1; hence the probability of passengers in the counter is calculated. Therefore, the probability of passengers moving away from the queue happens when more than 11 people are in the counter.
P 12-26 = ∑ 26n=12 P n = 3.61% ≈ 4%
Fig. 4 shows worksheet data for an M/M/1 queuing model, where the performance measures for M/M/1 formulas were directly implemented. Fig. 5 gives the probability distribution for ‘n’ passengers in the system. Fig. 6 and Fig. 7 give the information about discrete probability and time based probability respectively for M/M/1 Queuing Model.
(МУХИ Queuing Model}:
Single Server, Infinite Population, Poisson Arrival, FCFS, Exponential Service Time, Unlimited Queue Length
|
Inputs |
|||||
|
Units of time |
hour |
||||
|
Arrival rate (A) |
70 |
passengers pe |
hour |
||
|
Service rate (p) |
90 |
passengers pe |
hour |
||
|
Outputs |
|||||
|
Mean time between arrivals |
0.014 |
||||
|
Mean time per service |
0.011111111 |
hour |
|||
|
Traffic intensity |
0.777777778 |
hour |
|||
|
Performance Measures |
|||||
|
Utilization rate of server (Rho) |
77.8% |
||||
|
Average number of passengers waiting in line (Lq ) |
2.722222222 |
passengers |
|||
|
Average number of passengers in system (L) |
3.5 |
passengers |
|||
|
Average time waiting in queue (Wq) |
0.03 8888889 |
hour |
|||
|
Average time in system (W7) |
0.05 |
hour |
|||
|
Probability of no passengers in system (P0) |
22.2% |
(this is the probability of empty system) |
|||
|
Distribution of number of passengers in svstem |
|||||
|
n (passengers) |
P(n in svstem) |
||||
|
4 |
0.081322 |
||||
|
Distribution of time in queue |
|||||
|
t (time in queue) |
P(wait > t) |
||||
0.1 0.105261
Fig.4. Worksheet for M/M/1 Operating Characteristics
Pn
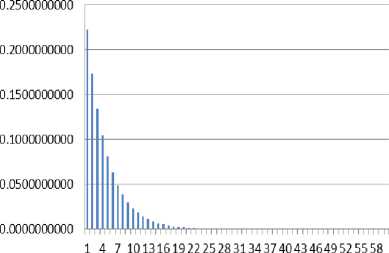
Fig.5. Probability of ‘n’ Passengers in System for M/M/1 Model
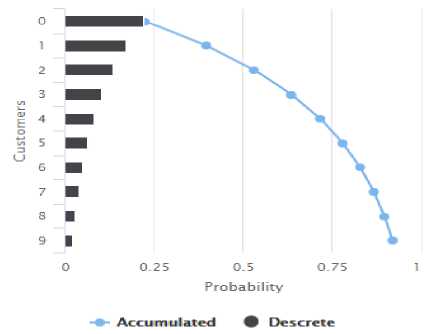
Fig.6. Discrete Probability for M/M/1 Model
From Fig. 6, it is clear that the percentage of time a server is being utilized by a passenger is 77.80%. The probability that there is no passenger and the server remains idle is 22.22%.
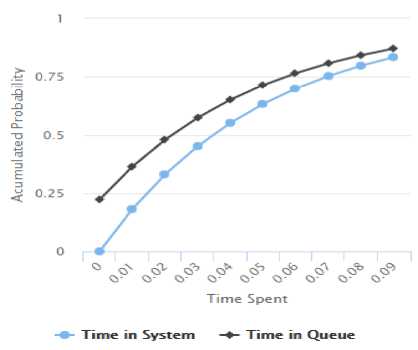
Fig.7. Time Based Probability for M/M/1 Model
Fig. 7 shows that the time spent in a queue for serving all the 10 passengers could be calculated by subtracting the time taken by the 10th passenger to get the service and the time taken by the 1st passenger to get the service. From the calculations, the time in the queue for M/M/1 model was estimated to be 38.4 minutes.
-
B. Evaluation
It was observed after evaluation that the mean number of passengers increased with utilization. Hence it can be concluded that as the utilization rate increases, the mean number of passenger’s increases. A high utilization rate of 0.778 (77.8%) was seen in the prepaid counter. It was observed that the weekend utilization rate was much higher than that of the weekdays, since people travelled more during weekends as it was a holiday. Hence it is very clear utilization rate increases with increase in service rate thereby decreasing the probability of the passengers going away.
-
C. Benefits
By anticipating the number of passengers in the queue, the quality of service can be increased by this attempt. The present study will become a reference for analyzing the current system and improving the future systems. It also helps us in estimating the number of passengers waiting in a queue and going away from the queue on a daily basis. Hence this work helps in anticipating the number of passengers coming to the counter and going away on a daily basis and also gives suggestions to maximize profit.
-
D. Suggestion for Queue Optimization
Define abbreviations and acronyms the first time they are used in the text, even after they have been defined in the abstract. Do not use abbreviations in the title unless they are unavoidable.
Result analysis shown in Table-2 notifies that queuing performance was nonlinear. Waiting time and queue length reduced drastically with increased number of parallel servers; hence finding optimum number of servers to maximize the profits and minimize the cost of business could be achieved.
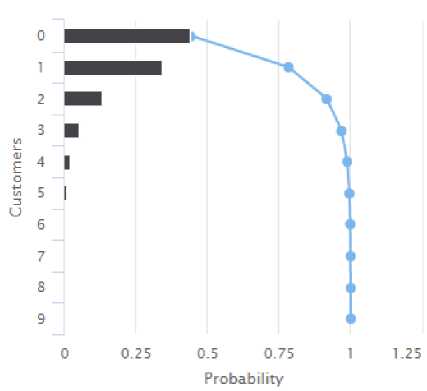
From Fig. 8, it is clear that the percentage of time a server is being utilized by a passenger is 38.89%. The probability that there is no passenger and the server remains idle is 44%.
Fig. 9 shows that the time spent in a queue for M/M/2 model was estimated to be 12.09 minutes when compared to M/M/1 model which was 38.4 minutes.
The main goal of optimizing the queuing model is to minimize the total cost of waiting and service. Perfect balance between the passengers and the number of servers is an important aspect to be considered while optimizing the queuing model.
Service cost is the cost involved in operating a facility which includes cost of equipment’s, materials and labor. It is clear that more the number of service facilities put in the system; more is the operating cost.
Waiting costs is that cost which cannot be accounted easily. Waiting line in the queue is inversely proportional to the number of servers in the counter; hence the passengers will be more satisfied.
Table 2. Comparative Study of Single Server and Multi Server Queuing Model
|
Performance Measures |
Queuing Model |
|
|
M/M/1 |
M/M/2 |
|
|
Number of passengers in the counter on an average ( L s ) |
4 |
1 |
|
Number of passengers waiting in the queue on an average (L q ) |
3 |
0 |
|
Time spent by the passenger in the counter on an average ( Seconds ) W s |
180 |
47.12 |
|
Average time in the queue ( Seconds ) W q |
140 |
7.12 |
|
Average Server Utilization (%) |
77.80 |
38.89 |
|
Probability of idle server (%) |
22.22 |
44.00 |
Ф- Accumulated • Descrete
Fig.8. Discrete Probability for M/M/2 Model
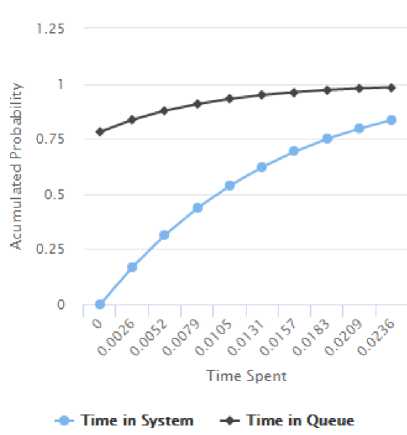
Fig.9. Time Based Probability for M/M/2 Model
The total expected cost is represented by the equation:
TC = S.C s + C w (λW s ) (11)
Let’s consider the average unit cost to run a server is Rs.110/hour (It includes labor charges and miscellaneous charges on an hourly basis) and unit cost of waiting is Rs.140/hour (It includes the passenger’s average annual income on an hourly basis) for arrival rate 70 and service rate 90 ;
The total expected cost is:
TC = 1 * 110 + 140 (70 * 0.05) = 600 /-
The total expected cost is:
TC = 2 * 110 + 140 (70 * 0.01309) = 348.29/-
Analysis results showed that M/M/2 queuing model could be effectively used in the present system by installing 2 servers for satisfying the passenger needs. Fig. 10 clearly signifies the relationship between number of servers and the associated waiting cost. The queue optimization chart results clearly indicate that as the service rate increases, the waiting cost decreases drastically.
Optimization
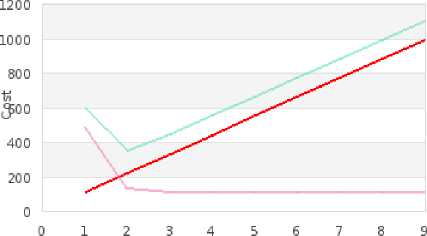
Servers
Service — Waiting — Total
Fig.10. Queue Optimization Chart
-
VI. Conclusion
An optimization approach for solving the serviceability problems of a prepaid autorickshaw counter using queuing model was effectively executed. From the results obtained, it is clear that waiting cost for the passenger could be reduced 3.8 times by the use of M/M/2 queuing model in comparison with M/M/1 queuing model. Time in the queue for serving 10 passengers in M/M/1 model was 38.4 minutes when compared to 12.09 minutes in M/M/2 model. From the results obtained, it is clear that time in the queue for the serving 10 passenger could be reduced to 26.31 minutes by the use of M/M/2 queuing model in comparison with M/M/1 queuing model; hence less time was spent by passengers in queue thereby providing faster service with better passenger satisfaction. Hence the present approach helps us in concluding that prepaid rickshaw counters can take our suggestions by using a M/M/2 model which would help them in reducing the waiting cost and queuing time; thereby satisfying the passengers in a better way.
Acknowledgment
The author wishes to thank the concerned pre-paid autorickshaw counter for providing the required data which was necessary for this research. The author also wishes to thank International Journal of Information Technology and Computer Science (IJITCS).
References Improving the serviceability of a prepaid autorickshaw counter using queuing model: an optimization approach
- M. Dharmawirya, E. Adi , “Case Study for Restaurant Queuing Model”,International Conference on Management and Artificial Intelligence, IPEDR vol.(6), pp: 52 – 55, 2011.
- S. K. Dhar, T. Rahman., “Case Study for Bank ATM Queuing Model”, IOSR Journal of Mathematics. Volume (7), Issue (1), pp 01-05, May. - Jun. 2013.
- U. M. Abubakar, S. R. Kabara, U. T. Mustapha, M. G. Musa. “Application of Queuing Model in a Restaurant (A Case Study of Kalinga Restaurant)”, International Journal of Science and Research. Vol(5) ,Issue (11), pp: 388 – 390. November 2016.
- W. Agyei, C. Asare-Darko, F. Odilon. “Modeling and Analysis of Queuing Systems in Banks: (A case study of Ghana Commercial Bank Ltd. Kumasi Main Branch)”, International Journal of Scientific & Technology Research, Vol (4), Issue (07), pp 160 – 163, July 2015.
- E. S. Kembe, Onah, S. Iorkegh, “A Study of Waiting and Service Costs of a MultiServer Queuing Model in a Specialist Hospital”, International Journal of Scientific & Technology Research, Vol (1), Issue (8), pp 19 – 23, September 2012.
- K. Nahar, M. Z. Islam, M. M. Islam. “Cost Effective Decisions on Service Rate at a Customer Care Centre with Multi-Server Queuing Model”, Journal of Modern Science and Technology. Vol (4), Issue (1), pp 144 – 153. September 2016.
- H. Vass, K. Z. Szabo. “Application of Queuing Model to Patient Flow in Emergency Department. Case Study”. Procedia Economics and Finance , vol (32) ,pp 479 – 487, 2015.
- S. Shanmugasundaram, P. Umarani. “Queuing Theory Applied in our Day to Day Life”. International Journal of Scientific & Engineering Research, Vol( 6) , Issue (4), pp. 533 – 541, April-2015.
- A. Sharma, P. B. Barua. “Application of Queuing Theory in a Small Enterprise”. International Journal of Engineering Trends and Technology (IJETT). Vol (27), issue (2),pp 105-110, September 2015..
- U. R. Manuel , A. Offiong, ”Application of Queuing Theory to Automated Teller Machine (ATM) facilities using Monte-Carlo Simulation”. International Journal of Engineering Science and Technology (IJEST). vol.(6), isuue (4), April 2014.
- B. Patel, P. Bhathawala. “Case Study for Bank ATM Queuing Model”. International Journal of Engineering Research and Applications (IJERA). vol (2) , issue (5), September-October 2012.
- M. Marsudi, H. Shafeek. “The Application of Queuing Theory in Multi-Stage Production Line, International Conference on Industrial Engineering and Operations Management, January 2014.
- A. Vasumathi A, P. Dhanavanthan. “Application of Simulation Technique in Queuing Model for ATM Facility”. International Journal of Applied Engineering Research. vol (1), Issue (3), 2010.
- D.S Hira and P.K. Gupta. “Simulation and Queuing Theory”. Operation Research, 2004.
- S. Afrane and A. Appah. “Queuing Theory and the Management of Waiting Time in Hospitals: The Case of Anglo Gold Ashanti Hospital in Ghana”. International Journal of Academic Research in Business and Social Sciences. vol (4), issue (2), February 2014.
- A.W. N. Yakubu and U. Najim. “An Application of Queuing Theory to ATM Service Optimization: A Case Study”. Mathematical Theory and Modelling, IISTE. vol (4), issue (6), 2014.
- M. S. R. Chowdhury, M. T. Rahman and M. R. Kabir. “Solving Of Waiting Lines Models in the Bank Using Queuing Theory Model the Practice Case: Islami Bank Bangladesh Limited, Chawkbazar Branch, Chittagong”. IOSR Journal of Business and Management, Vol (10), Issue (1), pp 22-29, May - Jun. 2013.
- J. Sztrik. “Queuing Theory and its Applications, A Personal View”. Proceedings of the 8th International Conference on Applied Informatics, vol(1), pp. 9-30, January 2010.
- H. Xiao and G. Zhang, “The queuing theory application in bank service optimization”. Institute of Information & System Engineering, Henan University of Finance & Economics, Zhengzhou, 2009.
- A. Amin, P. Mehta, A. Sahay, P. Kumar, A. Kumar. “Optimal solution of real time problems using Queueing Theory”. International Journal of Engineering and Innovative Technology (IJEIT), Vol (3), Issue (10), April 2014.
- N. Jhala, P. Bhathawala. “Smart Queue Management System for Banking Sector”. International Journal of Business Management and Economics Research. Vol(3), issue (1) , pp. 29-34, 2016.
- S.M. Sundari, S.Srinivasan. “M/M/C Queueing Model for Waiting Time of Customers In Bank Sectors”. Int. J. of Mathematical Sciences and Applications. Vol (1), issue (3), September 2011.
- M. M. Ahsan, M. R. Islam, M.. Ashikul Alam. Study of Queuing System of a Busy Restaurant and a Proposed Facilitate Queuing. IOSR Journal of Mechanical and Civil Engineering,vol (11), issue (6) ,pp 31-35, Nov –Dec 2014.
- M. A, Molla. “Case Study for Shuruchi Restaurant Queuing Model”. IOSR Journal of Business and Management. Vol(19), Issue (2). pp 93-98, Feb 2017.
- I. A. Tochukwu, O.O. Moses, “Optimality Test for Multi Server Queuing Model with Homogenous Server in the Out-Patient Department (OPD) of Nigeria Teaching Hospitals, “, I. J. Modern Education and Computer Science, Vol(4), pp:9-17, April 2016. DOI: 10.5815/IJMECS.2016.04.02.
- O. D. Ogunwale, O. A. Olubiyi, “A Comparative Analysis of Waiting Time of Customers in Banks, “, Global Journal Of Science Frontier Research, Vol(10), Issue (6), pp: 97-99, October 2010.
- S. Toshiba, S. Sanjay Kumar, K. Anil Kumar, “Application of Queuing Theory for the Improvement of Bank Service, “, International Journal of Advanced Computational Engineering and Networking, Vol(1), Issue(4), pp:15-18, June 2013.
- I. P. Lade, V. P. Sakhare, M.S. Shelke, P. B. Sawaitul, “Reduction of Waiting Time by using Simulation and Queuing Analysis,”, International Journal on Recent and Innovation trends in Computing and Communication, Vol(3), Issue (2), pp:55-59, February 2015.
