Improving upsell by clustering customers’ orders: machine learning approach

Author: Filipyev Andrey
Journal: Сетевое научное издание «Системный анализ в науке и образовании» @journal-sanse
Article in issue: 3, 2018.
Free access
This article aims to test the hypothesis that the use of machine learning algorithms better builds personal communication with consumers than does expert opinion regarding this question. Clustering and classification algorithms were applied in order to segment the dataset of clients. New sequences for offering to clients additional products based on joining segmentation and expert opinion have revealed the advantages of this approach.
Up-sell, clustering, classification, cosine similarity, spectral clustering
Short address: https://sciup.org/14122671
IDR: 14122671 | UDC: 004.021
Увеличение дополнительных продаж кластеризацией клиентских заказов: подход на основе машинного обучения
Цель исследования заключается в проверке гипотезы, что построение персонализированной коммуникации с клиентами на основе алгоритмов машинного обучения дает результаты лучше, чем использование только экспертной оценки. Методы кластеризации и классификации были применены для сегментации заказов пользователей. Новые цепочки рекомендуемых продуктов, основанные на объединении сегментации и экспертной оценки, показывают преимущества такого подхода.
Text of the scientific article Improving upsell by clustering customers’ orders: machine learning approach
Machine learning is a field of computer science that uses statistical techniques to give computer systems the ability to learn with data, without being explicitly programmed [1]. In this research, we have used two algorithms: clustering and classification . Cluster analysis is the assignment of a set of observations into subsets (called clusters) so that observations within the same cluster are similar according to some predesignated criterion or criteria, while observations drawn from different clusters are dissimilar. Classification is the algorithm of identifying to which of a set of categories a new observation belongs, on the basis of a training set of data containing observations whose category membership is known [2].
This article describes how the empirical experiment has proved that using machine learning algorithms in a real information system helps to improve intelligence skills used to communicate with customers. Expert opinion as well the necessary thing in dealing with consumer behavior. In case we are operating one restaurant, it is possible to offer personal suggestions regarding product preference to every single customer, for we know almost all of our visitors. However, at this point, Dodo Pizza is the pizza chain with about 360 stores in more than 10 countries. In this case of millions of customers involved it is no longer possible to make personal recommendations to every single one of them.
The aim of the experiment was to test the hypothesis that matching artificial intelligence with expert judgements could improve the amount of upsold products. The new microservice module was developed and launched in production system. The new results from machine learning model were compared to the previous logic through A/B testing and separating dataset of customers by their loyalty.
Upsell module
Upsell is the system of offering customers additional products for their cart to purchase it or sending consumers information about new interesting goods. There are lots of marketing techniques and channels to interact with potential clients: emails, Viber, WhatsApp, phone calls, SMS. To check our hypothesis we have chosen the key sales channels of Dodo Information System: mobile application and client website. There is a recommendation block in every cart of both website and the app.
j^ ДОДО ПИЦЦА

Корзина

735 ₽

.<—' Сеть пиццерий № 1 в России
Корзина
Введите промокод Применить
Пепперони
Традиционное, 35 см
Рекомендуем попробовать

В корзину
Доктор Пеппер, 0,355 л 85 ₽
Ж
Морс Вишня, 0,45 Л
85 Р
В корзину
■н
клюкв
Pic. 1. The recommendation block of the cart of the website
The picture above illustrates that in case the user adds pizza to the cart, the system offers him or her to purchase a drink. Therefore, the upsell system works based on the standard logic of what kind of product category must be shown based on the expert opinion of Dodo Pizza’s marketing specialists. This logic is similar between website and mobile app, but the display of these blocks varies. In the mobile application, the user can only see one product from the whole sequence of recommended products.
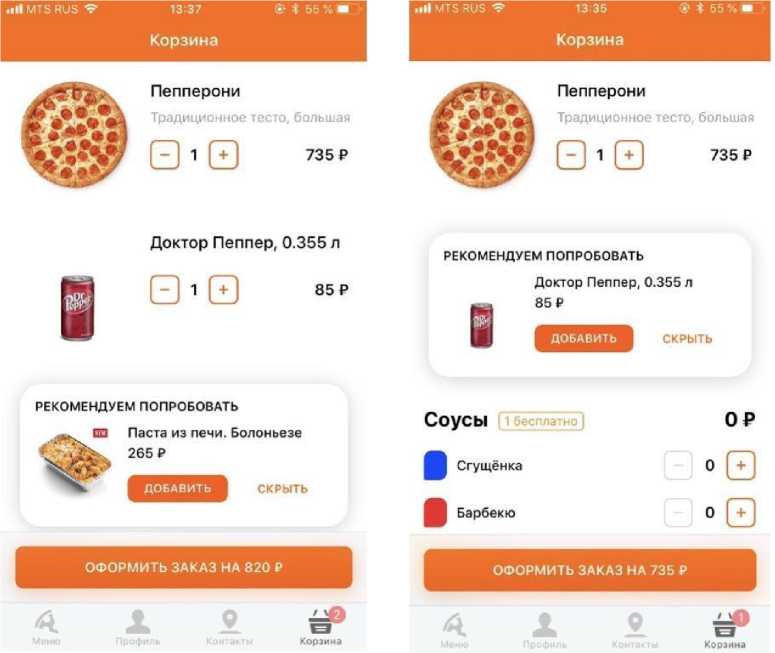
Pic. 2. The recommendation block of the cart of the mobile application
The logic of the recommended sequences was based only on if-else conditions: if the user chose pizza and drink, he will see the category of snacks in the upsell block. All conditions are presented in the table below.
Table 1. Standard upsells logic
|
Condition |
Result category |
|
If the cart consists of only pizzas |
Show drink category |
|
If the cart consists of only snacks |
Show drink category |
|
If the cart consists of only desserts |
Show drink category |
|
If the cart consists of pizzas and snacks |
Show drink category |
|
If the cart consists of pizzas and desserts |
Show drink category |
|
If the cart consists of pizzas and drinks |
Show snacks |
|
If the cart consists of pizzas, snacks, and desserts |
Show drink category |
|
If the cart consists of pizzas, snacks, and drinks |
Show desserts |
|
If the cart consists of pizzas, snacks, drinks, and desserts |
Don’t show upsell category |
|
If the cart consists of drinks and desserts |
Show snack category |
|
If the cart consists of desserts and snacks |
Show drink category |
|
If the cart consists of drinks and snacks |
Show dessert category |
In June, this upsell brought only 0.3% additional revenue through the mobile application.
After analyzing this results it was decided to use a similar idea of clustering products and orders of customers which was used during researching of sales of customized pizza in the United States [3]. However, as opposed to the previous approach (clustering recipes), now we used information about sold products for each particular customer.
Euclidean and cosine distances
In order to segment clients’ history of orders, there is a bunch of different algorithms to cluster a dataset. The simplest way that we chose based on our previous research was to pivot table and use the clustering of the resulting matrix.
Out[70]i
|
Clientld |
Адреналин |
Минерале |
Минерале |
Аква |
негаэ. |
Ветчина и грибы |
Ветчина и грибы (халяль) |
Ветчина томаты |
Гавайская . |
Чай холодный Липтон Лимон |
Чай холодный Липтон Малина |
Чай холодный Липтон Персик |
Четыре сезона |
(хал# |
|
|
0 |
16638797 |
0.0 |
0.0 |
0.0 |
0.0 |
0.0 |
0.0 |
0.0 |
0.0 |
1.0 . |
0.0 |
0.0 |
0.0 |
1.0 |
|
|
1 |
3798015 |
0.0 |
0.0 |
0.0 |
0.0 |
0.0 |
2.0 |
0.0 |
0.0 |
0.0 . |
0.0 |
0.0 |
0.0 |
1.0 |
|
|
2 |
76762 |
0.0 |
0.0 |
0.0 |
0.0 |
0.0 |
0.0 |
0.0 |
0.0 |
2.0 . |
0.0 |
0.0 |
0.0 |
0.0 |
|
|
3 |
4020717 |
0.0 |
0.0 |
0.0 |
0.0 |
0.0 |
0.0 |
0.0 |
0.0 |
1.0 . |
0.0 |
0.0 |
0.0 |
1.0 |
|
|
4 |
3657815 |
00 |
6.0 |
0.0 |
5.0 |
0.0 |
1.0 |
0.0 |
00 |
0.0 . |
00 |
00 |
0.0 |
00 |
|
|
5 |
467505 |
0.0 |
0,0 |
0.0 |
0.0 |
0.0 |
0.0 |
0.0 |
0,0 |
1.0 . |
0.0 |
0.0 |
0.0 |
0.0 |
|
|
6 |
4597828 |
0.0 |
0.0 |
0.0 |
0.0 |
0.0 |
0.0 |
0.0 |
0.0 |
0.0 . |
0.0 |
0.0 |
0.0 |
1.0 |
|
|
7 |
14152600 |
0.0 |
0.0 |
0.0 |
0.0 |
0.0 |
1.0 |
0.0 |
0.0 |
0.0 . |
0.0 |
0.0 |
0.0 |
0.0 |
|
|
8 |
321155 |
0.0 |
0.0 |
0.0 |
0.0 |
0.0 |
4.0 |
0.0 |
0.0 |
0.0 . |
0.0 |
0.0 |
0.0 |
2.0 |
|
|
9 |
12125724 |
0.0 |
0.0 |
0.0 |
0.0 |
0.0 |
0.0 |
0.0 |
0.0 |
7.0 . |
0.0 |
0.0 |
0.0 |
1.0 |
Pic. 3. The pivot dataset of clients orders
Picture 3 shows how the pivoted table looks like, each row is the history of the certain client and each column displays the amount of each product bought by the consumer. Rows can be considered as vectors, so by comparing them with each other we could find out whether the preferences of one group differ from another. By using matching vectors we can calculate the distance between customers and determine their behaviors.
The calculated value, however, depends on the chosen distance metric. The Euclidean distance calculation includes vector’s weight and magnitude [4]:
/у?
¥^1=1 "u ,
Where a and b are two different clients from the pivoted table. It’s necessary to think about the nature of existing data when we are trying to apply some kind of algorithm because the results will depend on the basic approaches. Let’s consider an example of comparing different clients.
If we have 3 different clients a , b and c we can build their order matrix by using their order history.
Table 2. The matrix of products ordered by clients a, b and c
|
Pepperoni |
The Meats |
Cheese |
Supreme |
|
|
a |
20 |
3 |
5 |
10 |
|
b |
7 |
1 |
2 |
1 |
|
c |
7 |
2 |
5 |
14 |
Now we can calculate Euclidean distances between these clients:
-
- The distance between vectors a and b is equal to 16,22;
-
- The distance between vectors b and c is equal to 13,38;
-
- The distance between vectors c and a is equal to 13,64.
These values explain that vectors b and c are much closer to each other than vectors a and b. However, the initial data tells the opposite. Clients a and b like Pepperoni and sometimes order other pizzas. And client c loves Supreme. We can conclude that the weight of magnitude in the formula of Euclidean distance has a negative effect in calculating distances between product preferences of Dodo Pizza clients.
It’s worth a try to calculate the cosine similarity between similar vectors and compare results to the previous ones:
-
- The distance between vectors a and b is equal to 0,9183;
-
- The distance between vectors b and c is equal to 0,5848;
-
- The distance between vectors c and a is equal to 0,7947.
According to this, the preferences between vectors a and b are now the closest in our matrix. It as well corresponds with our expert opinion. Therefore, we can use the cosine similarity in order to cluster our clients with their products.
The next step is to build the matrix of cosine similarities of consumers. If we use the example which we have examined before it is possible to build the sample of the matrix.
Table 3. The matrix of cosine distances
|
a |
b |
c |
|
|
a |
1 |
0,9183 |
0,7947 |
|
b |
0,9183 |
1 |
0,5848 |
|
c |
0,7947 |
0,5848 |
1 |
The spectral clustering
Based on the previous chapter we can build the cosine matrix and use cluster algorithm to separate the initial data into different groups. There are different algorithms which allow working with a matrix of distances [5]. After comparing the results of the empirical experiments Spectral clustering has created the most logical clusters without any additional preprocessing activities with the matrix of distances. However, we have faced a new problem - the cost of the calculation of the matrix of cosine distances. The initial data consisted of 2,000,000 clients, so we had to build a 2,000,000 x 2,000,000 matrix. Experiments have revealed that was only possible to calculate a 60,000 x 60,000 matrix with 264 Gb RAM, but algorithm demands to upload the whole matrix into RAM in order to cluster all clients.
We had to deploy a machine learning model to the production server within the shortest time possible. Because developing heavy models with optimized calculating cost could take much more time. It was decided to choose the simplest way to start a new mechanism of offering additional products and prove the rationality of using artificial intelligence methods with existing data.
The solution was found by dividing the whole dataset into smaller similar parts and clustering them independently. The in depth examination of the results showed that a mixed dataset has similar clusters. This meant that each cluster is rather stable and we have stable clusters. So we can use only one small part of the dataset to cluster it and after that, we can use marks of clusters to classify the whole data with the smaller cost of the calculation. Thus the optimal size of the dataset was discovered. The calculating of the matrix of size 40,000 x 40,000 does not take more than 1.5 hours.
In multivariate statistics and data clustering, spectral clustering techniques make use of the spectrum (eigenvalues) of the similarity matrix of the data to perform dimensionality reduction before clustering in fewer dimensions. The similarity matrix is provided as an input and consists of a quantitative assessment of the relative similarity of each pair of points in the dataset [6].
In this research we used sklearn.cluster.SpectralClustering library and it applies to cluster to a projection to the normalized Laplacian[7]. There’re two different approaches of normalized spectral clustering, depending on the kind of Laplacians graph [8]:
-
- The first one uses the generalized eigenvectors of L. Input is the similarity matrix S e R , number k of clusters to construct:
-
1. Construct a similarity graph. Let 1Г be its weighted adjacency matrix.
-
2. Compute the unnormalized Laplacian ^ .
-
3. Compute the first k generalized eigenvectors ui.....uk of the generalized eigenproblem Lu = λDu.
-
4. Let UeR be the matrix containing the vectors uv...,u^ as columns.
-
5. For i = 1, . . . , n, letH ^S be the vector corresponding to the i** row of U.
-
6. Cluster the points (yi)(yi)i=l,-,n in 8 with the k-means algorithm into clusters ^1'■ ■ ■^Q .
-
7. Output: Clusters AL .....AM with .
- The other way also uses a normalized Laplacian, but this time the matrix ^sym instead of ^FWInput is the similarity matrix S е R with number k of clusters to construct:
-
1. Construct a similarity graph. Let 1Г be its weighted adjacency matrix.
-
2. Compute the normalized Laplacian ^sym .
-
3. Compute the first k eigenvectors U1.....«Й of ^sym .
-
4. Let U eR be the matrix containing the vectors uv...,u^ as columns.
-
5. Form the matrix T eR from by normalizing the rows to norm 1, that is set *
-
6. For i = 1, ..., n, let№ es be the vector corresponding to the irh row of * .
-
7. Cluster the points (yi)(yi)i=l,-,n in я with the k-means algorithm into clusters ^r■ ■ ■' Q.
-
8. Output: Clusters Ai .....лй with .
пхй = "===
|
number of orders with product |
average number of orders with product per |
number of purchased |
items per client |
% of clients from cluster, who purchased this product |
Total people |
43671 |
||
|
Cluster: |
3 |
Count |
2560 |
5,86% |
||||
|
Dodo |
13927 |
5,44 |
14406 |
5,63 |
100,00% |
|||
|
Dodster |
2607 |
1,02 |
4514 |
1,76 |
38,98% |
|||
|
Baked potatoes |
1362 |
0,53 |
1613 |
0,63 |
26,80% |
|||
|
Pie |
1160 |
0,45 |
1184 |
0,46 |
29,65% |
|||
|
Salad Cesar |
934 |
0,36 |
1134 |
0,44 |
16,88% |
|||
|
Coca-Cola |
843 |
0,33 |
1046 |
0,41 |
17,97% |
|||
|
BBQ Wings |
666 |
0,26 |
726 |
0,28 |
15,55% |
Pic. 4. The result of Top-N products of one of the clusters
Picture 4 displays Top-6 products of cluster # 3. This picture shows a part of the pivoted results of clustering. Left columns contain the names of top products and the first row (marked with beige color) shows the main product of this cluster. Thus, each consumer in this cluster bought Dodo product before: you can see the 100% in the column “% of clients from the cluster, who purchased this product”. Other rows show the most popular products inside the observed cluster.
After clustering and building pivoted table we are going to test the main hypothesis with the guess: offering the top products from the cluster for a client who is the member of this cluster should improve the revenue from upsell .
This logic can be described by the following:
-
1. Upsell module gets the products from the application (mobile or web).
-
2. Identify cluster by client id.
-
3. Get the prepared recommendation sequence of Top-N products for this cluster.
-
4. Remove existing in client’s cart products from the recommendation sequence.
-
5. Send the recommendation products to the application.
Classification based on clustering results
Clustering was made on small subsample and as the result, we have a labeled dataset of clients with the long history of orders. To label the whole dataset of more than 2,000,000 clients we have decided to use the classification algorithm.
As we can see from our previous experiments Gradient Boosting algorithm is good at coping with the type of data such as our pivoted information about clients’ orders[3]. The main idea of this method is to use an ensemble of weak models in order to increase the accuracy of the result prediction. Our ensemble consisted of decisions trees. In general, this algorithm can be explained by the following[9]:
-
- Input data:
-
1. Input data (^У)"=1.
-
2. The number of iterations м
-
3. The loss-function ч^.П .
-
4. The base model h(x,e^ .
-
- Steps of the algorithm:
-
1. Initialize fc with a constant.
-
2. for t = 1 to м do:
-
3. compute the negative gradient .
-
4. fit a new base-learner function А(х- 9Г).
-
5. find the best gradient descent step-size Pt = arg mint 2311 ^[Wt-i(Xi) + Р^^р^)]
-
6. update the function estimate: ft ^ ft-i.* Pth^x ,9t) .
-
7. end for.
Statistics
Applying of clustering and classification algorithms has helped to segmented clients by their product preferences. We have chosen the most popular products in each segment and started to show them in the step of checking the cart. You can see the difference between recommended products on Picture 1 and Picture 5.
Корзина
Введите промокод Применить
Пепперони
Традиционное, 35 см
Q1 0 735 ₽
Рекомендуем попробовать
Картофель из Салат цезарь Рулети

Pic. 5. The recommended sequence based on machine learning algorithms
After one week of the experiment, the first results show the difference between only the expert approach and approach based on joining the expert opinion and machine learning methods. Below are the tables with one-week results of A/B testing between two different ways to show recommended sequences of products.
Table 4. Statistics of A/B testing of the mobile application
Mobile Application
|
Count |
Income |
||
|
Expert logic |
739 |
72 860 RUB |
|
|
ML logic |
1182 |
184 230 RUB |
|
|
Increase % |
60% |
153% |
Table 5. Statistics of A/B testing of the website
|
Web Site |
|||
|
Count |
Income |
||
|
Expert logic |
411 |
42 635 RUB |
|
|
ML logic |
500 |
77 975 RUB |
|
|
Increase % |
22% |
83% |
|
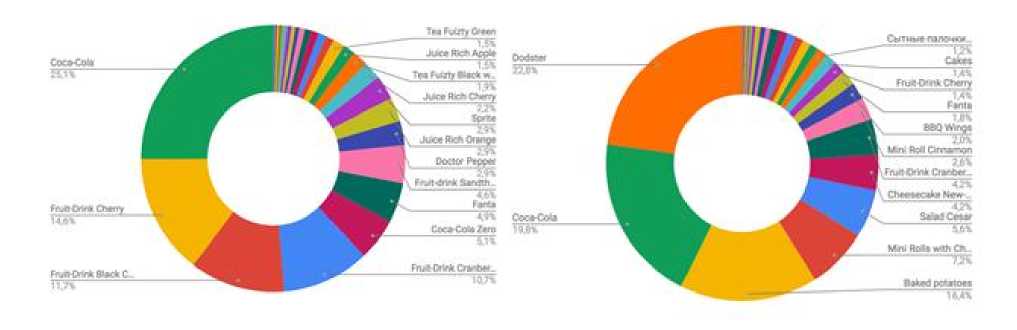
As you can see from the tables above the difference in revenue is much higher than the difference between amounts of sold products. To explain the reasons for this effect we have to learn more about statistics.
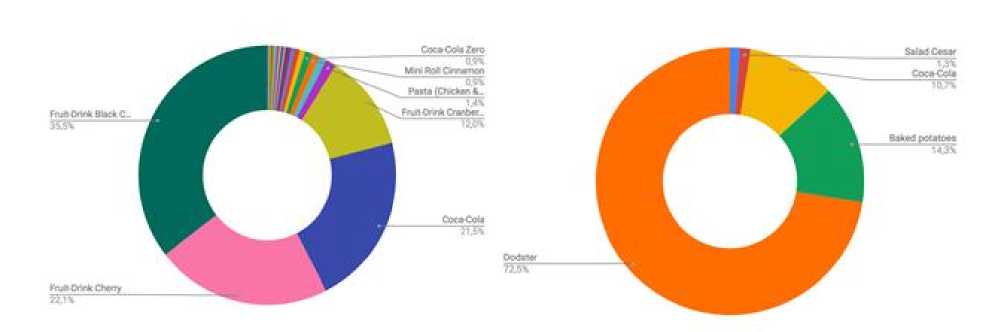
Pic. 5. Sold products through a mobile application
Pic. 6. Sold products through a website
The most sold recommended products via recommendation sequence based on expert opinion is composed mainly of drink category goods. On the other side, the logic based on a machine learning model drives sales of more expensive product categories.
Conclusion
The empirical experiment has shown that using machine learning methods with large datasets helps to improve algorithms of communication with consumers. The results of the offering clients additional products based on previous orders made it possible to gather more reach data for future analysis.
The future research can use new data to build heavier and more effective artificial intelligence models to develop the direction of personalization in communication with consumers.
References Improving upsell by clustering customers’ orders: machine learning approach
- Machine Learning. - [Electronic resource]. URL: https://en.wikipedia.org/wiki/Machine_learning.
- Statistical classification. - [Electronic resource]. URL: https://en.wikipedia.org/wiki/Statistical_classification.
- Filipyev A. Cluster analysis of customers behavior. // Системный анализ в науке и образовании: сетевое научное издание. - 2018. - №2. - [Электронный ресурс]. URL: http://sanse.ru/download/318.
- Euclidean distance. - [Electronic resource]. URL: https://en.wikipedia.org/wiki/Euclidean_distance.
- Comparing different clustering algorithms on toy datasets. - [Electronic resource]. URL: http://scikit-learn.org/stable/auto_examples/cluster/plot_cluster_comparison.html#sphx-glr-auto-examples-cluster-plot-cluster-comparison-py.
- Spectral clustering. - [Electronic resource]. URL: https://en.wikipedia.org/wiki/Spectral_clustering.
- Spectral Clustering. - [Electronic Resource]. URL: http://scikit-learn.org/stable/modules/generated/ sklearn.cluster.SpectralClustering.html.
- U. Von Luxburg, "A Tutorial on Spectral Clustering", Statistics 550 Xiucai Ye and Tetsuya Sakurai ETRI Journal. - 2016. - Vol. 38. - №3. - [Electronic resource]. URL:.
- DOI: 10.4218/etrij.16.0115.0517
- Gradient Boosting Machines, A Tutorial. - [Electronic resource]. URL: https://www.researchgate.net/publication/259653472_Gradient_Boosting_Machines_A_Tutorial.
