Inhalation health risk assessment of some of heavy metals for kerosene samples in Iraq market

Author: Wadi Sattar Nema, Pasha Mohammad Akbarzadeh, Abojassim Ali Abid
Journal: Cardiometry @cardiometry
Section: Original research
Article in issue: 25, 2022.
Free access
In this study, five heavy metals (Zn, Fe, Pb, Cu, and Cd) concentrations were measured in samples of kerosene (locally only) that collected from different of warehouses oils in Iraq. The measurements have been done using Atomic Absorption Spectrophotometer. Non-cancer risks such as the chronic daily inhalation intake (CDIinh), a Hazard Quotient (HQ), and Haz-ard Index (HI) as well as Cancer Risks (CR) due to inhalation of heavy metals in the kerosene samples were calculated. The results show that, the average values of concentrations in unit ppm (mg/kg) belonging to Zn, Fe, Pb, Cu, and Cd in kerosene samples were 8.14±1.74, 0.127±0.025, 0.017±0.007, 0.15±0.064, and 0.360±0.022, respectively. While, the average value of Haz-ard Index (HI) due to all heave metals in the present work was 0.721± 0.16. Also, the average value of Total Cancer Risk (TCR) due to Cd and Pb were 1.12E-03±4.4E-04. When comparing the results of inhalation health risk, the present work with Worldwide average, we found that the most samples of kerosene samples are safe for using.
Heavy metals, kerosene, aas, cancer risk, iraqi markets
Short address: https://sciup.org/148326588
IDR: 148326588 | DOI: 10.18137/cardiometry.2022.25.1118
Text of the scientific article Inhalation health risk assessment of some of heavy metals for kerosene samples in Iraq market
Sattar Nema Wadi, Mohammad Akbarzadeh Pasha, Ali Abid Abojassim. Inhalation Health Risk Assessment of Some of Heavy Metals for Kerosene Samples in Iraq Market. Cardiometry; Special issue No. 25; December 2022; p. 11-18; DOI: 10.18137/car-diometry.2022.25.1118; Available from: http://www.cardiometry. net/issues/no25-december-2022/inhalation-health-risk
The origin of air pollution on the earth can be traced from the times when man started using firewood as a means of cooking and heating. With the discovery and increasing use of coal, air pollution became more pronounced especially in urban areas [1]. It was recognized as a problem 700 years ago in London in the form of smoke pollution, which prompted King Edward I to make the first antipollution law to restrict people from using coal for domestic heating in the year 1273 [2]. Heay metals, Air pollution began to increase in the beginning of the twentieth century with the development of the transportation systems and large-scale use of petrol and diesel. Most types of air pollution are a mixture of many harmful substances, including small particles in the air, sulphur oxides, carbon monoxide, nitrogen oxides, volatile organic compounds (VOCs), benzene, Kerosene, and polycyclic aromatic hydrocarbons (PAHs). The International Agency for Research on Cancer (IARC) classifies types of air pollutants based on their link with cancer. For example, gasoline engine exhaust is classified as a possible carcinogen. Kerosene, diesel engine exhaust and outdoor air pollution are classified as known carcinogens [3]. Pollution results in increased exposure to zinc. The main symptoms of acute poisoning are nausea, vomiting, diarrhea, coma and fever. Zinc is considered [4]. Exposure to lead in large quantities causes Reproductive failure, encephalopathy, neurophysiological defects, anemia, renal injury, and hypertension blood and poisoning [5]. Copper deficiency leads to anemia and low blood cells leukemia, as well as neurological disease, osteoporosis, and a disorder of the connective tissues [6]. Cadmium toxicity causes other problems such as cancer, cardiovascular disease and hypertension. Cadmium is classified as a human carcinogen. There is a clear interest in recent years in the impact of the concentrations of heavy metals on the in human and knowing whether the concentration of these elements causes the malignant diseases i.e., the increase and decrease in them cause a lot of damage such as toxicity [7]. The absence of heavy metals in an organism causes death or severe malfunction since they are needed in very small amounts for life to continue. In fact, all the essential heavy metals can be harmful to both humans and animals if they exposure to materials that have heavy metals such as air, water, and food or do so for a lengthy period of time
-
[ 8]. Heavy metals enter the environment due to human activities, especially industrial activities, and its disposal from waste [7]. One of the sources of heavy metal pollution is crude oil. Crude oil spills in the oil field can contaminate the surrounding soil. Prolonged exposure to toxic doses of heavy metals poses a serious risk to human health. In oil-exporting countries, one of the major sources of heavy metal pollution is oil fields and the crude oil extraction and refining industries. Data on levels of heavy metal contamination are not available on petroleum products used in Iraq. This study tends to examine the presence and distribution of some of heavy metal such as Pb, Cu, Cd, and Cr in local of Kerosene samples that available in Iraqi markets with a view to comparatively evaluate the concentration levels of these metals so as to see if they meet desirable standards or otherwise.
Experimental of Methodology
In the present study, seven samples of kerosene types that produced from the governors of Al-Najaf, Basra, Al-Diwaniyah, Karbala, Baghdad, Al-Samawa, and Babylon was chosen. Table (1) shows the name and location of kerosene samples in the present study. Thus, five heavy metals such as Pb, Cu, Cd, and Cr in kerosene samples were measured using Atomic Absorption Spectrophotometer technique.
Table (1)
The name and location of kerosene samples in the present study.
|
No. |
Name of Warehouse |
Name of governorate |
Sample code |
Data |
Type |
|
1 |
New Najaf |
Al-Najaf |
W1 |
1/7/2022 |
Locally |
|
2 |
Al-Shuai-ba |
Basra |
W2 |
1/7/2022 |
|
|
3 |
Al-Diwan-iyah |
Al-Diwan-iyah |
W3 |
1/7/2022 |
|
|
4 |
new Karbala |
Karbala |
W4 |
1/7/2022 |
|
|
5 |
Dora |
Baghdad |
W5 |
1/7/2022 |
|
|
6 |
Samawa |
Al-Sama-wa |
W6 |
1/7/2022 |
|
|
7 |
Hilla |
Babylon |
W7 |
1/7/2022 |
5ml of kerosene sample was digested in a covered glass beaker containing a 10 ml H2SO4 / HClO4 acid mixture (1: 1). The mixture was transferred to a precleaned 25 ml flask, and the mixture was placed on a hot piece (Heater) until the solution was completely 12 | Cardiometry | Issue 25. December 2022
crushed and removed from the (Heater) and diluted to the marker with double distilled water, and stored for analysis. The empty solution was treated and prepared in the same manner as the samples [9]. Each sample and each empty were prepared in three copies, and the ratio of the acid mixture to the amount obtained from the kerosene of patients.
SHIMADZU model AA-7000 atomic absorption spectrophotometer (AAS) was used to determine the concentrations of Zinc (Zn), Iron (Fe) Lead (Pb), Copper (Cu), and Cadmium (Cd) concentrations. The wavelength in nm for Zn, Fe, Pb, Cu, and Cd was 213.9, 248.3, 283.3, 324.8, and 228.8, respectively. Its width is (0.7,0.2,0.7,0.7 and 0.7) nm, respectively, this device is located in the Faculty of Pharmacy, as the type of flame used is Air-C2 H2.
The concentrations of heavy elements were determined in the laboratories of the faculty of science, university of Kufa, using a device atomic absorption spectrophotometer, with given the calibration curve of each element Zinc (Zn), Iron (Fe) Lead (Pb), Copper (Cu), and Cadmium (Cd) concentrations.
Calculation
In this work, non-cancer risks such as the chronic daily inhalation intake (CDIinh), a Hazard Quotient (HQ), and Hazard Index (HI) as well as Cancer Risks (CR) of heavy metals in oil products in Iraq via inhalation route were assessed for adult participants.
The values of non-cancer risks (CDIinh, HQ, and HI) and cancer risks (CR) due to inhalation of heavy metals were calculated using as following [10-12]:
CDI
|
[ mg ) C i x InhR x EF x ED |
(1) |
|
v kg . day ) BW x AT x 10 6 |
|
|
HQ = CDIi i RfD i |
(2) |
|
hi X ^Q |
(3) |
|
CR = CDI i x SF i |
(4) |
where, Ci is heavy metals concentration, InhR is the inhalation rate, EF is exposure frequency, ED is exposure duration, BW is body weight, AT is average time, RfDi is the reference dose, and SFi is the slope factor.
Results and Discussion
The results of the concentrations of Zn, Fe, Pb, Cu, and Cd in the samples from kerosene were shown in
Tables (2). From Table (2), the lowest concentrations of Fe were 1.10 ppm (mg/kg) for the sample W1 (from New Najaf warehouse in Al-Najaf), while the highest was 14.05 ppm for sample W7 (from Hilla warehouse in Babylon), with an average value of was 8.14±1.74 ppm. The range values of Cu concentrations were 0.061ppm in sample W3 (from Al-Shuaiba warehouse in Basra) to 0.226 ppm in sample W6 (from Samawa warehouse in Al-Samawa), with an average value of 0.127±0.025 ppm. While, the range values of Cd concentrations were ND in sample W4 (from new Karbala warehouse in Karbala) to 0.059 ppm in sample W5 (from Dora warehouse in Baghdad), with an average value of 0.017±0.007 ppm. But, the lowest concentrations of Pb were ND ppm for the sample W2 (from Al-Shuaiba warehouse in Basra), while the highest was 0.506 ppm for sample W4 (from new Karbala warehouse in Karbala), with an average 0.15±0.064 ppm. Finally, the values of Zn concentrations were ranged from 0.284 ppm in sample W2 (from Al-Shuaiba warehouse in Basra) to 0.451 ppm in sample W4 (from new Karbala warehouse in Karbala), with an average value of 0.360±0.022 ppm.
The results of the values of the chronic daily inhalation intake (CDIinh) due to five heavy metals in the present study (Fe, Cu, Cd, Pb, and Zn) for the samples from kerosene were shown in Tables (3). The average values of CDIinh for Fe, Cu, Cd, Pb, and Zn (Table 3) were 8.35E-02±1.7E-02 mg/kg.d, 1.31E-03±2.6E-04 mg/ kg.d, 1.74E-04±7.5E-05 mg/kg.d, 1.54E-03±6.6E-04 mg/kg.d, and 3.70E-03±2.3E-04 mg/kg.d, respectively.
The results of the values of the Hazard Quotient (HQ) and Hazard Index (HI) due to five heavy metals in the present study (Fe, Cu, Cd, Pb, and Zn) for the samples from kerosene were shown in Tables (4). the average values of HQ for Fe, Cu, Cd, Pb, and Zn (Table 4) were 0.119±0.02, 0.031±0.006, 0.173±0.07, 0.385±0.165, and 0.0123 ±0.0006, respectively. The Hazard Index (HI) obtained by using the Equation (3), the highest value of HI in kerosene samples (Ta-
Table (2)
Results of concentrations of heavy metals in kerosene samples
|
No. |
Sample code |
Concentrations (ppm) |
||||
|
Fe |
Cu |
Cd |
Pb |
Zn |
||
|
1 |
W1 |
1.10 |
0.064 |
0.022 |
0.038 |
0.318 |
|
2 |
W2 |
2.39 |
0.073 |
0.023 |
ND |
0.284 |
|
3 |
W3 |
6.08 |
0.061 |
0.004 |
0.025 |
0.448 |
|
4 |
W4 |
11.22 |
0.225 |
ND |
0.506 |
0.451 |
|
5 |
W5 |
10.25 |
0.140 |
0.059 |
0.038 |
0.354 |
|
6 |
W6 |
11.92 |
0.226 |
0.001 |
0.177 |
0.330 |
|
7 |
W7 |
14.05 |
0.105 |
0.011 |
0.266 |
0.340 |
|
Minimum |
1.10 |
0.061 |
ND |
ND |
0.284 |
|
|
Maximum |
14.05 |
0.226 |
0.059 |
0.506 |
0.451 |
|
|
Aveage±Error |
8.14±1.74 |
0.127±0.025 |
0.017±0.007 |
0.15±0.064 |
0.360±0.022 |
|
Table (3)
Results of CDIinh from heavy metals in kerosene samples
|
No. |
Sample code |
CDIinh (mg/kg-day), |
||||
|
Fe |
Cu |
Cd |
Pb |
Zn |
||
|
1 |
W1 |
1.13E-02 |
6.60E-04 |
2.21E-04 |
3.90E-04 |
3.26E-03 |
|
2 |
W2 |
2.45E-02 |
7.47E-04 |
2.36E-04 |
0.00E+00 |
2.91E-03 |
|
3 |
W3 |
6.25E-02 |
6.25E-04 |
3.70E-05 |
2.60E-04 |
4.60E-03 |
|
4 |
W4 |
1.15E-01 |
2.31E-03 |
0.00E+00 |
5.20E-03 |
4.63E-03 |
|
5 |
W5 |
1.05E-01 |
1.44E-03 |
6.04E-04 |
3.90E-04 |
3.64E-03 |
|
6 |
W6 |
1.22E-01 |
2.33E-03 |
7.19E-06 |
1.82E-03 |
3.39E-03 |
|
7 |
W7 |
1.44E-01 |
1.08E-03 |
1.11E-04 |
2.73E-03 |
3.49E-03 |
|
Aveage±Error |
8.35E-02 ±1.7E-02 |
1.31E-03± 2.6E-04 |
1.74E-04 ±7.5E-05 |
1.54E-03± 6.6E-04 |
3.70E-03± 2.3E-04 |
|
ble 4) were 0.22 in sample W3 (from Al-Shuaiba warehouse in Basra) to 1.53 in sample W4 (from new Karbala warehouse in Karbala), with an average value of 0.721± 0.16.
The results values of the Cancer Risk (CR) and Total Cancer Risk (TCR) due to Cd and Pb concentrations for samples of kerosene were shown in Table (5). The average values of CR due to Cd and Pb for kerosene samples 1.06E-03±4.5E-04 and 6.47E-5±2.7E-5, respectively. While, the range with average values of TCR for kerosene samples were 1.20E-04-3.70E-03 with 1.12E-03±4.4E-04.
The results of heavy metals in Table (2) for kerosene samples show that the values of Fe concentrations in all the studied samples (Figure 1) were higher than the recommended value of 0.3 ppm [13]. The concentrations of Cu for gasoline samples (Figure 2) were lower than standard limits by USEPA 2002 (0.1 ppm) [13] , except, samples W1, W2, and W3. While, Cd concentrations in all samples (Figure 3) were lower than standard limits by USEPA 2002 (5 ppm) [13]. The concentrations of Pb for kerosene samples (Figure 4) were less than standard limits by USEPA 2002
(0.075 ppm) [13] , except, sample W4, W5, and W6. But, Zn concentrations in all samples (Figure 5) were less than standard limits by USEPA 2002 (5 ppm) [13].
The box plot of concentration spread out for Fe, Cu, Cd, Pb, and Zn in kerosene samples is given in Figure (6). From Figure (6), the values of median for Fe, Cu, Cd, Pb, and Zn concentrations (ppm or mg/kg) in kerosene samples were 10.25, 0.105, 0.011, 0.038, and 0.340, respectively. While, the values of mean for Fe, Cu, Cd, Pb, and Zn concentrations (ppm or mg/ kg) in kerosene samples were 8.14, 0.127, 0.017, 0.15, and 0.360, respectively. Therefore, the median of the Fe was closer to the top bottom of the box, while, other heavy metals (Cu, Cd, Pb and Zn) were closer to the bottom of the box. This meant that the distribution of the data set was skewed.
The relation between the average values of Fe, Cu, Cd, Zn, and Pb concentrations in kerosene samples is given in Figure (7). The average values of heavy metals for kerosene samples were in order as: Fe > Zn > Pb > Cu >Cd (Figure 7).
Table (4)
Results of the hazard quotient and hazard index from heavy metals in kerosene samples
|
No. |
Sample code |
Hazard Quotient (HQ) |
Hazard Index (HI) |
||||
|
Fe |
Cu |
Cd |
Pb |
Zn |
|||
|
1 |
W1 |
0.016 |
0.016 |
0.221 |
0.098 |
0.011 |
0.36 |
|
2 |
W2 |
0.035 |
0.018 |
0.236 |
0.000 |
0.010 |
0.30 |
|
3 |
W3 |
0.089 |
0.015 |
0.037 |
0.065 |
0.015 |
0.22 |
|
4 |
W4 |
0.165 |
0.055 |
0.000 |
1.300 |
0.015 |
1.53 |
|
5 |
W5 |
0.150 |
0.034 |
0.604 |
0.098 |
0.012 |
0.90 |
|
6 |
W6 |
0.175 |
0.055 |
0.007 |
0.455 |
0.011 |
0.70 |
|
7 |
W7 |
0.206 |
0.026 |
0.111 |
0.682 |
0.012 |
1.04 |
|
Aveage±Error |
0.119±0.02 |
0.031±0.006 |
0.173±0.07 |
0.385±0.165 |
0.0123 ±0.0006 |
0.721± 0.16 |
|
Table (5)
Results of the cancer risk and total cancer risk from heavy metals in kerosene samples
|
No. |
Sample code |
Cancer Risk (CR) |
Total Cancer Risk (TCR) |
|
|
Cd |
Pb |
|||
|
8 |
W1 |
1.35E-03 |
1.64E-05 |
1.36E-03 |
|
9 |
W2 |
1.44E-03 |
0.00E+00 |
1.44E-03 |
|
10 |
W3 |
2.26E-04 |
1.09E-05 |
2.37E-04 |
|
11 |
W4 |
0.00E+00 |
2.18E-04 |
2.18E-04 |
|
12 |
W5 |
3.69E-03 |
1.64E-05 |
3.70E-03 |
|
13 |
W6 |
4.39E-05 |
7.64E-05 |
1.20E-04 |
|
14 |
W7 |
6.77E-04 |
1.15E-04 |
7.92E-04 |
|
Aveage±Error |
1.06E-03±4.5E-04 |
6.47E-5±2.7E-5 |
1.12E-03±4.4E-04 |
|
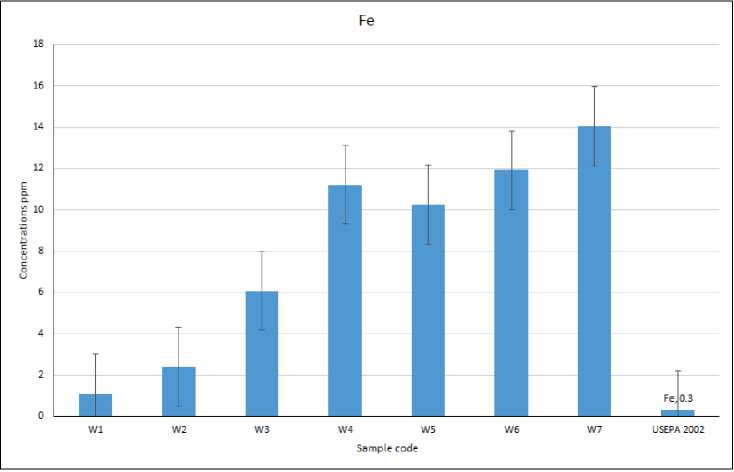
Figure (1). Comparison of the concentrations of Fe in kerosene samples with standard limits by USEPA 2002.
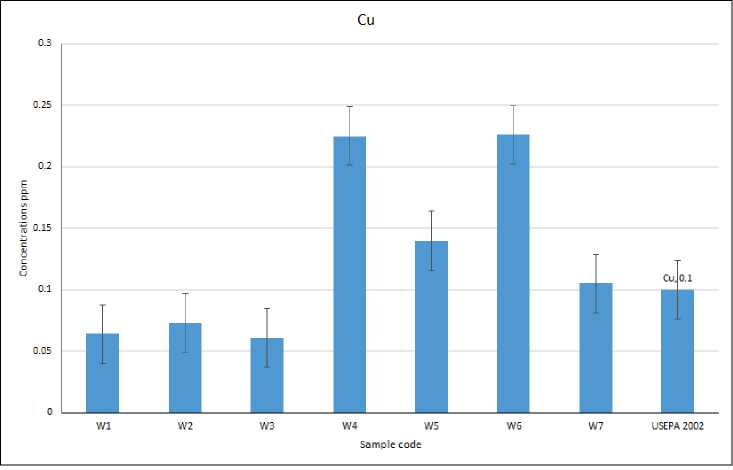
Figure (2). Comparison of the concentrations of Cu in kerosene samples with standard limits by USEPA 2002.
Cd
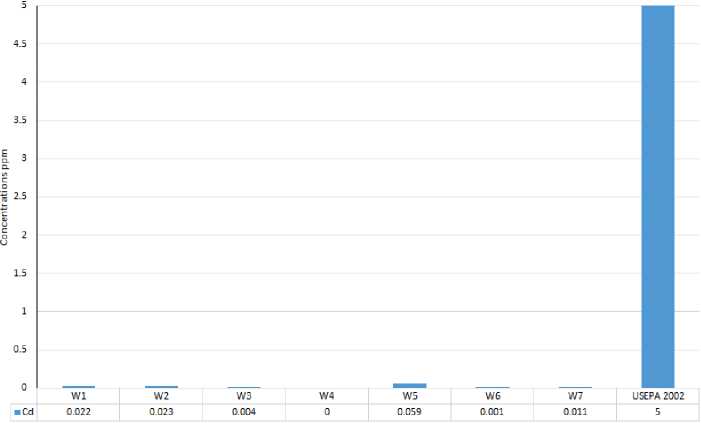
Figure (3). Comparison of the concentrations of Cd in kerosene samples with standard limits by USEPA 2002
Pb
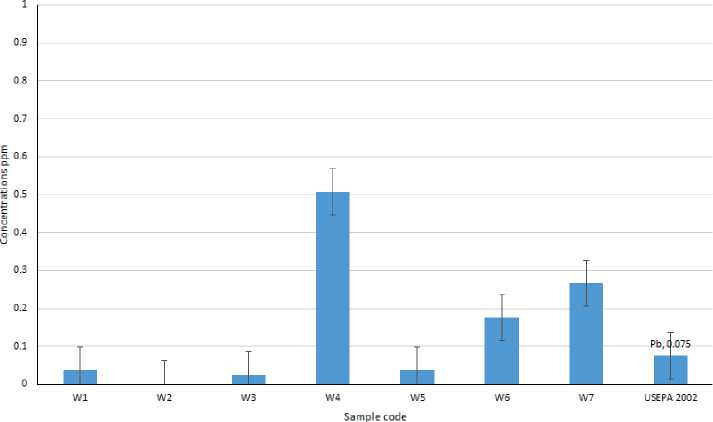
Figure (4). Comparison of the concentrations of Pb in kerosene samples with standard limits by USEPA 2002
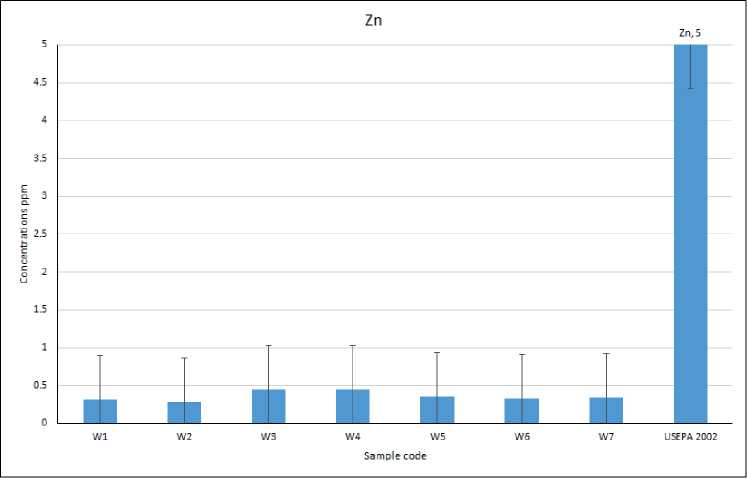
Figure (5). Comparison of the concentrations of Zn in kerosene samples with standard limits by USEPA 2002.
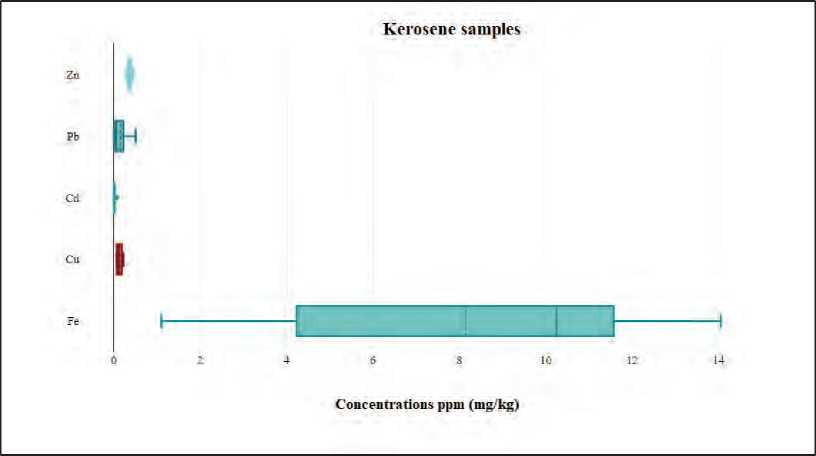
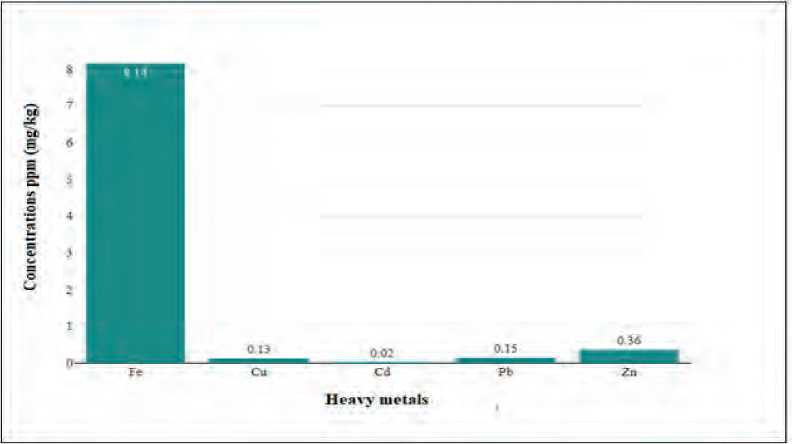
Figure (7). The relation between the average values of Fe, Cu, Cd, Zn, and Pb concentrations in kerosene samples.
Generally, the human health risk due to Fe, Cu, Cd, Pb, and Zn contamination in the samples of the present study depends on the Average Daily Dose by Inhalation (CDIinh), Hazard Quotient (HQ), Hazard Index (HI), and Cancer Risk (CR), and Total Cancer Risk (TCR). Therefore, the results of human health risk for non-cancer risk and for cancer risk were shown in Tables (3) and (4).
The results of CDIinh (mg/kg-day) for Fe, Cu, Cd, Pb, and Zn in all samples under study were found below the U.S. EPA permissible limit 0.7, 0.04, 0.001, 0.004, and 0.3 mg/kg. d-1, respectively [48]. While, the results of HQ revealed in all oil products was found below the U.S. EPA permissible limit (1) [14]. But, the results of HI in each sample were less than EPA permissible limit (1) [14-16] , except two samples in kerosene group (W4 and W7). So, chronic exposure for non-cancer risk in these samples (W4, and W7) was high concentration of five heavy metals poses health risk due to these metals. The present results show that the Cancer Risk (CR) as well as Total Cancer Risk (TCR) due to Cd and Pb in most samples in the present study were higher than the recommended value of the range 10-6-10-4 according to U.S. EPA [13]. Therefore, it can cause some kinds of risk of cancer incidence for the long term, and for adults.
Conclusions
From the results of research and compare them with the higher limit of heavy metals such as Iron (Fe), Copper (Cu), Cadmium (Cd), Lead (Pb), and Zinc (Zn) from kerosene samples. The Fe concentrations in all samples of the present study were higher than the allowed limit (0.3 ppm). The Cu and Pb concentrations in most samples of the present study were higher than the allowed limit (0.1 and 0.075 ppm). The Cd and Zn concentrations in all samples of the present study were higher than the allowed limit (5 ppm). The chronic daily inhalation intake (CDIinh) in all samples were within the allowed limit according to EPA. The values of Hazard Quotient (HQ) as well as Hazard Index (HI) in most samples of kerosene indices account were less than the recommended value for the heavy metals hazard indices given by worldwide average. The values of Cancer Risk (CR) as well as Total Cancer Risk (TCR) in all samples of the present study were higher than the range of the allowed limit according to EPA.
References Inhalation health risk assessment of some of heavy metals for kerosene samples in Iraq market
- Brimblecombe, P., & Makra, L. (2005). Selections from the history of environmental pollution, with special attention to air pollution. Part 2*: From medieval times to the 19th century. International journal of environment and pollution, 23(4), 351-367.
- Zhang, J., Mauzerall, D. L., Zhu, T., Liang, S., Ezzati, M., & Remais, J. V. (2010). Environmental health in China: progress towards clean air and safe water. The lancet, 375(9720), 1110-1119.
- Masiol, M., Hopke, P. K., Felton, H. D., Frank, B. P., Rattigan, O. V., Wurth, M. J., & LaDuke, G. H. (2017). Source apportionment of PM2. 5 chemically speciated mass and particle number concentrations in New York City. Atmospheric environment, 148, 215-229.
- Qin, H., Hu, T., Zhai, Y., Lu, N., & Aliyeva, J. (2020). The improved methods of heavy metals removal by biosorbents: A review. Environmental Pollution, 258, 113777.
- Prasad, R. (Ed.). (2021). Environmental Pollution and Remediation. Springer.
- Stanisley, P. (2002). Waste discharge during offshore oil and gas activity. Environ Imp Offshore Oil Gas Ind, 31, 48-65.
- Hoang, A. T., & Pham, X. D. (2021). An investigation of remediation and recovery of oil spill and toxic heavy metal from maritime pollution by a new absorbent material. Journal of Marine Engineering & Technology, 20(3), 159-169.
- Abojassim, A. A., & Munim, R. R. (2020). Chapter-4 Hazards of Heavy Metal on Human Health. MULTIDISCIPLINARY, 51.
- Lawi, D. J., Abdulwhaab, W. S., & Abojassim, A. A. (2022). Health Risk Study of Heavy Metals from Consumption of Drugs (Solid and Liquid) Samples Derived from Medicinal Plants in Iraq. Biological Trace Element Research, 1-13.
- US Environmental Protection Agency, 2004. Risk assessment guidance for superfund (RAGS). https://doi.org/EPA/540/1-89/002/ (assessed 20 March 2019).
- US Environmental Protection Agency, 2011. Exposure Factors Handbook: 2011 Edition. https://doi.org/EPA/600/R-090/052F/ (assessed 20 March 2019).
- Sun, Y., Tian, Y., Xue, Q., Jia, B., Wei, Y., Song, D., ... & Feng, Y. (2021). Source-specific risks of synchronous heavy metals and PAHs in inhalable particles at different pollution levels: Variations and health risks during heavy pollution. Environment International, 146, 106162.
- United States Environmental Protection Agency (USEPA)(2002). Data quality review. EPA/540/R-02/506. National risk Management Laboratory. Office of Research and Development U.S Environmental Protection Agency
- U.S. EPA,(2002). Calculating Upper Confidence Limits for Exposure Point Concentrations at Hazardous Waste Sites, OSWER 9285.6.-10 Office of Emergency and Remedial Response, U.S. Environmental Protection Agency, Washington, DC, 20460.
- Ferreira-Baptista, L., & De Miguel, E. (2005). Geochemistry and risk assessment of street dust in Luanda, Angola: a tropical urban environment. Atmospheric environment, 39(25), 4501-4512.
- Adesina, G. O., & Adelasoye, K. A. (2014). Effect of crude oil pollution on heavy metal contents, microbial population in soil, and maize and cowpea growth. Agricultural sciences, 2014.
