Integrated Model of DNA Sequence Numerical Representation and Artificial Neural Network for Human Donor and Acceptor Sites Prediction

Author: Mohammed Abo-Zahhad, Sabah M. Ahmed, Shimaa A. Abd-Elrahman
Journal: International Journal of Information Technology and Computer Science(IJITCS) @ijitcs
Article in issue: 8 Vol. 6, 2014.
Free access
Human Genome Project has led to a huge inflow of genomic data. After the completion of human genome sequencing, more and more effort is being put into identification of splicing sites of exons and introns (donor and acceptor sites). These invite bioinformatics to analysis the genome sequences and identify the location of exon and intron boundaries or in other words prediction of splicing sites. Prediction of splice sites in genic regions of DNA sequence is one of the most challenging aspects of gene structure recognition. Over the last two decades, artificial neural networks gradually became one of the essential tools in bioinformatics. In this paper artificial neural networks with different numerical mapping techniques have been employed for building integrated model for splice site prediction in genes. An artificial neural network is trained and then used to find splice sites in human genes. A comparison between different mapping methods using trained neural network in terms of their precision in prediction of donor and acceptor sites will be presented in this paper. Training and measuring performance of neural network are carried out using sequences of the human genome (GRch37/hg19- chr21). Simulation results indicate that using Electron-Ion Interaction Potential numerical mapping method with neural network yields to the best performance in prediction.
Artificial Neural Network, Exons, Introns, DNA Sequence, Circular Mapping, Donor Site, Acceptor Site
Short address: https://sciup.org/15012135
IDR: 15012135
Text of the scientific article Integrated Model of DNA Sequence Numerical Representation and Artificial Neural Network for Human Donor and Acceptor Sites Prediction
Published Online July 2014 in MECS
Human DNA molecule contains subsequences that code to protein chains. These subsequences are called genes. A gene is the basic physical and functional unit of heredity. In human cells, the gene sequences consist of exons and introns, where exon parts are responsible for producing proteins while the intron parts are rejected in the splicing process. The boundaries between exon and intron in gene sequence are known as splice sites. The exon-intron border is 5’ end of the intron or commonly known as donor splice site. It consists of a consensus dinucleotide ‘GT’ (first two nucleotides of the intron). While intron-exon border is 3’ end of the intron or commonly known as acceptor splice site. It consists of a consensus dinucleotide ‘AG’ (last two nucleotides of the intron) as shown in figure 1. Donor and acceptor sites consensus dinucleotides (GT and AG) might be occurred at locations other than acceptor and donor sites in a gene sequence. So, the prediction of these sites is very difficult. Accurate prediction of splice sites plays an important role in human genomic analysis and prediction. In technical literature, many computational methods have been developed for splice site detection[1]-[5]. These include, Bayesian networks, artificial neural network (ANN), discriminate analysis, support vector machine SVM. Computationally this can be achieved through artificial neural network.
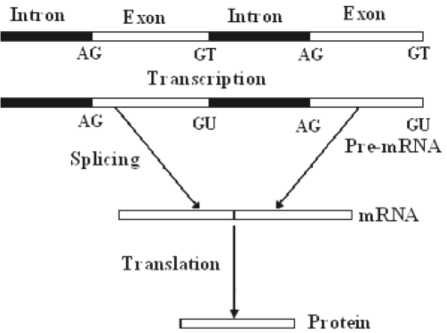
Fig. 1. Donor and acceptor sites in gene
The paper is organized as follows. Section I presents this introduction. Basics of artificial neural network will be introduced in section II. Neural network is a method that can be used as a general approximate function for donor and acceptor sites prediction. It defines the relationship between the input patterns and the corresponding desired outputs. Section III introduces a schematic representation of donor and acceptor site predictions integrated model and each step will be explained in subsections. In section IV, information about DNA datasets that are used in neural network simulation will be presented. A comparison between different mapping techniques using trained neural network relative to accuracy in donor and acceptor sites prediction are include in section V. Finally, section VI concludes the paper.
-
II. Artificial Neural Network Concepts
An artificial neural network (ANN), or simply neural network (NN), is a computational model of how a biological neural network works. NNs are composed of simple elements operating in parallel [2]. These elements are inspired by biological nervous system. As in nature, the network function is determined largely by the connections between elements. A NN can be trained to perform a particular function by adjusting the values of the connections (weights) and biases between elements. After NN is adjusted, or trained, a particular input leads to a specific desired output as shown in figure 2. The network is adjusted, based on a difference between the output of the NN and the desired output, until the network output matches the desired. In this paper training of NNs is performed using Matlab neural network toolbox to solve problems that is difficult to solve by human beings.
ANN has been used in several real life applications like image data processing, traffic control, regression analysis, pattern recognition and classification like hand written character recognition. Some studies have also tried to utilize NNs in donor and acceptor sites prediction[3]-[5]. In[3], a simple NN algorithms have been developed for the recognition of 3’ and 5’ sites. Another attempt to utilize NN to predict splice sites in DNA sequences was performed in [4]. A later study [5] used a similar system of predicting functional sites using NNs, where it used a sliding window over human genome sequences
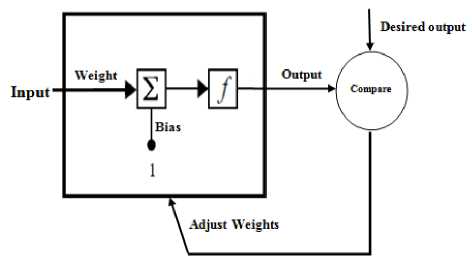
Fig. 2. Simple NN layer
Multilayer NN, also called feed-forward NN, can be constructed with three layers: input, hidden and output layers. The connections between the three layers of a simple NN are shown in figure 3. Where, the information is transmited in only one direction, forward, from the input nodes, through the hidden nodes (one or more layers) and to the output nodes. As simple example, if x, b1 and W 1 are the input vector with R element, weights (connection between input layer and hidden layer) with S neurons and biases (bias likes a weight, except that it has a constant input of 1) of hidden layer, the output out1 which given by (1) will be transmit to transfer function (f 1 : step function or a sigmoid function) as in (2). This forwards to the last layer (output layer) which has b2 and W2 as biases and weights (connection between hidden layer and output layer) with L neurons. The final output (z) of the network will be as in (4).
out1 = + b1(1)
ℎ=f1 (out1)(2)
out2 = ℎ+ b2(3)
Z= (out2)(4)
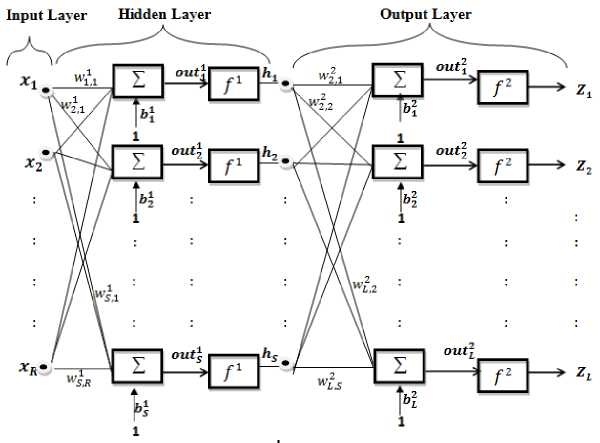
Fig. 3. ANN with three layers
The training of the NN depends on back propagation algorithm [6], so it’s also called back propagation NN. This algorithm adjusts the weights of NN with a gradient descent algorithm; if the output from the network is Z and the desired output is d then the training error e will be as shown in (5). Note that, the training error is a function of all adjustable weights. The weights are updated by the rule given by (6), where Δw is the update value in weights and η is the learning rate to update weights.
е (w) =1/2( ‖ d - Z ‖2 ) (5)
=
-
de
-
III. Integrated Model for Splicing Sites Prediction
The feed forward ANN will be used in this paper with only one hidden layer. The input to the network is not a whole gene but a windowed gene of 60 nucleotides slides over the gene. The NN will evaluate the weights of donor and acceptor sites in this windowed sequence to predict if there are any splices sites in this window. The output of this evaluation is two values, one for donor site and another for acceptor site. These values are accumulated for each nucleotide as the window slides over the gene. The accumulated value is used as donor and acceptor indicators of where the splice sites are located by calculate the max peaks values. The system has been trained on a data set of 53 genes, and a performance is measured on test data of 27 genes. Steps of prediction algorithm are shown in figure 4 and each step will be investigated in details in the following subsections.
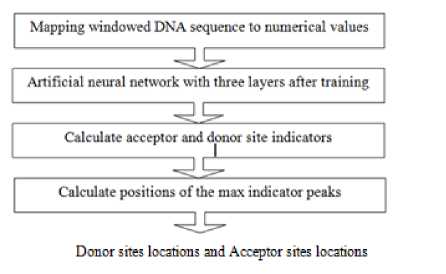
Fig. 4. Schematic representation of donor and acceptor site predictions system
-
A. Mapping Windowed DNA Sequence to Numerical Values
Numerical representation of DNA sequences is necessary to apply a wide range of mathematical tools, including most of signal processing and NN. In literature [7] - [20] , many different approaches have been proposed to map DNA sequences to numerical values. Existing numerical representation methods of DNA sequences can be broadly classified into two major groups: Fixed Mapping (FM) techniques [9] - [16] and
Physico-Chemical Property Based Mapping (PCPBM) techniques [7], [17] - [20]. In FM techniques, the nucleotides of DNA data are transformed into a series of arbitrary numerical sequences. FM techniques include the following. Voss representation technique [10], where, it maps the nucleotides A, C, T, and G into four binary indicator sequences xД (n), x(2 (n), xQ (n), and x T (n) showing the presence (e.g., 1) or absence (e.g., 0) of the respective nucleotides. Tetrahedron representation technique [11] reduces the number of indicator sequences from four as in Voss mapping to three in a manner symmetric to all four components. In this method the four sequences xд(n), x(2 (n), x(2 (n), and xT(n) are mapped to four 3- dimensional vectors pointing from the center to the vertices of a regular tetrahedron. The Voss and tetrahedron representations are equivalent representations for the purpose of power spectrum computation, but obtaining DNA spectrograms of bimolecular sequences is the main application of this method. The third numerical representation is the complex representation technique [11]. It reduces the dimensionality of the tetrahedral representation to two by projecting the basic tetrahedron on a complex plane. Moreover, it reflects the complementary nature of A-T and C- G pairs as A=1+j, C = -1+j, G = -1-j, and T = 1-j.
Integer and real numbers representation techniques [12][13] are two important mapping techniques, where the four nucleotides are represented by T=0, C=1, A=2, and G=3 for integer mapping and represented by A=-1.5, T=1.5, C=0.5, and G=-0.5 for real mapping. In [14], quaternion technique is introduced where A= i+j+k, C= i-j-k, G= -i-j+k, and T= -i+j-k. In [15] each DNA nucleotide is represented with a number representing the distance between the current nucleotide and the next similar nucleotide. In [16] nucleotide (A, T, C, or G) is represented by a complex numerical value according to nucleotide’s type and its position in codons along the DNA sequence. All values that represent nucleotides are located on circles so that a Circular Mapping (CM) of the bases is obtained as shown in figure 5. The numerical values of each nucleotide represented by CM are summarized in Table1.
Table 1. Nucleotide values for CM in first, second, and third position in codon
|
У о 5 |
Values of nucleotide in numerical sequence |
||
|
Value of nucleotide in the first position of codon |
Value of nucleotide in the second position of codon |
Value of nucleotide in the third position of codon |
|
|
A |
0.7104 + 0.7038i |
0.7071 + 0.7071i |
0.7038 + 0.7104i |
|
T |
-0.7104 + 0.7038i |
-0.7071 + 0.7071i |
-0.7038 + 0.7104i |
|
C |
-0.7104 - 0.7038i |
-0.7071 - 0.7071i |
-0.7038 - 0.7104i |
|
G |
0.7104 - 0.7038i |
0.7071 - 0.7071i |
0.7038 - 0.7104i |
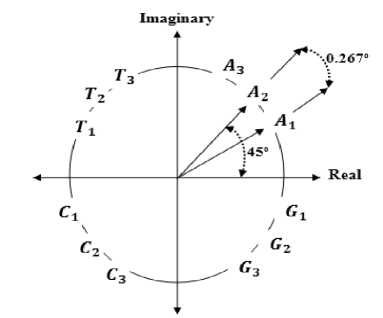
Fig. 5. CM nucleotides representation
length 60 pb. The window will be moving one nucleotide each slide to cover whole gene. The window size is chosen to be 60 nucleotides [21]. This is hopefully wide enough to find significant patterns on both sides of the splice site. A wider window will make the NN bigger and thereby harder to train. Shorter window may exclude important information around the splice site. The hidden layer consists of 128 units. A bigger NN with more hidden units may be able to learn better. Also, the more weights to adjust, the longer time must be used for training. May be even a smaller NN can perform just as good, and with less training. A standard sigmoid transfer function with β= 0.1 which given by (7) will be used as both the hidden layer and the output layer transfer function.
In PCPBM techniques, biophysical and biochemical properties of DNA biomolecules are used for DNA sequence mapping [9]. These techniques include the following. Electron-Ion Interaction Potential (EIIP) technique [17] represents the distribution of the free electrons’ energies along the DNA sequence. EIIP indicator sequence is formed by substituting the EIIP of the nucleotides A=0.1260, C=0.1340, G=0.0806, and
T=0.1335 in a DNA sequence. Atomic number mapping technique [18] in which a single atomic number indicator sequence is formed by assigning the atomic number in each nucleotide as: A=70, C=58, G=78 and T=66 in a DNA sequence. Paired numeric mapping technique [7] in which nucleotides (A-T, C-G) are to be paired in a complementary manner and values of +1 and -1 are to be used respectively to denote A-T and C-G nucleotide pairs. This representation incorporates a very useful DNA structural property, in addition to reducing complexity. DNA walk mapping technique [19] is a graphical representation of DNA sequences that helps to study the scale-invariant long-range correlations of a DNA sequence, a step is taken upwards (+1) if the nucleotide is pyrimidine (C or T) or downwards (-1) if it is purine (A or G). Finally, Z-curve mapping technique [20] is a 3-D curve that provides a unique representation for visualization and analysis of a DNA sequence. It converts the DNA sequence into an equivalent three dimensional representation based on the symmetry of the regular tetrahedrons.
-
B. Artificial Neural Network with Three Layers
Employing an ANN to locate splice sites in genes can be divided into three steps. First, building NN with appropriates number of layers and transfer functions. Second, training the NN to recognize input patterns with desired output, by adjusting the weights of the NN. The process of adjusting these weights is called training NN. The final step, evaluates the performance of trained NN to predict the location of splicing sites on test data.
The input layer is the numerical values of windowed gene sequence, where each nucleotide is represented with appropriate value according to the selected mapping method. The input to network not a whole gene, but each gene will be divided into a number of sequences with
f ( X )= —^
1+ e px
The sigmoid transfer function shown in figure 6 takes an input (x), which may have any value between plus and minus infinity, and squashes the output f(x) into the range 0 to 1. The effects of changing β value are negligible with respect to how fast the weights converge [22] .
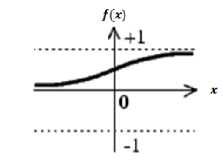
Fig. 6. Sigmoid function’s characteristic
The output layer has two outputs values; one for indicating acceptor splice site and second for indicating donor splice site. With each input (60 base pair (bp)) there were associated desired output needed to be out from NN when trained. This desired output is calculated by (8) [21]; where n is the index of nucleotide splicing site (donor or acceptor) inside window and L is the window size (60 bp).
d ( n )=1-|1-2^| (8)
If a splice site locates in midpoint of a certain window, the output value will be 1. The output value d(n) depends on the distance from the current nucleotide to the midpoint nucleotide. Thus, further from the midpoint of the window this splice site is the lower value we get in the desired values. The desired values decrease linearly from the midpoint of the window. The learning rate is chosen to be 0.1 and number of epoch (one run through the dataset of training data) is chosen to be 1000. After the weights have been trained in the NN, it can be used to evaluate an input feature vector and predict an associated outcome vector.
-
C. Calculation of Acceptor and Donor Site Indicators
The output from the NN will be evaluated for each windowed sequence. Then this value is attached to each nucleotide in the window. Then sliding window moves over the gene by one nucleotide and calculates the output from the NN. A nucleotide gets a score from summing its values that gets to it from each moving and accumulate this value for each nucleotide. The accumulated output is then normalized [21]. Most of the nucleotides will get a contribution from 60 different window positions, and these nucleotides are normalized by dividing the cumulative output by the area under the score function which equal to 30 (half the window width). These normalized cumulative scores yields to acceptor splice site indicator and donor splice site indicator.
-
D. Calculation of Positions of the Maximum Peaks
After calculating the donor and acceptor sites indicators, a threshold (Th.) value is calculated from the average and standard deviation (Sd.) of these indicator scores of the whole gene indicators as indicated in (9). The indicator scores that are less than the calculated threshold will be excluded and the successive indicators that are higher than the threshold will be used to indicate the splice site locations. The maximum values’ positions of successive indicator are detected and these positions indicates the locations of acceptor and donor site locations.
Th =
Sd. (indicator scores) + Mean. (indicator scores) (9)
-
E. Training and Testing Datasets
Human genes of chromosome 21 (954 genes)
downloaded from USCS Assembly database: Feb. 2009 (GRCh37/hg19) (Clade: Mammal, Genome: Human, Assembly: Feb.2009 (GRCh37/hg19), Group: Genes and Gene prediction Tracks, Track: UCSC Genes, Table: knownGene) [23] - [26] are used as training and testing datasets. It should be noted that single exon genes (121 genes), genes with very short exons or introns with 30 nucleotides or less (79 genes) and genes with length more than 7000bp are excluded from chromosome 21. Thus the total number of gene sequences that are used for training and testing consist of 80 genes. Among them a total of 53
genes are used for training and 27 genes are used for testing.
-
IV. Performance
In this section six existing DNA numerical representation techniques with trained NN are compared relative to their precision in splicing sites prediction. This has been carried out by adopting the integrated model explained in section 3. Equations (10) – (12) are used as a performance measures for each numerical representation[21]. The prediction performances of all the six numerical representation methods are summarized in Table 2. These results are obtained for a window length of 60 base pairs and sliding by one nucleotide. From these results, it can be deduced that, the EIIP mapping achieves the highest value of correlation coefficient. This also means that EIIP gives the highest precision in prediction of exons and introns locations when compared with the actual exon and intron locations.
TP
=
= + FN
TP
= p Tp + FP
CC
(TP x TN)- (FN x FP)
√( TP + FN )( TN + FP )( TP + FP )( TN + FN )
Where;
Sn: denotes the sensitivity. It’s defined as the ratio of correctly predicted exon nucleotides to all actual exon nucleotides and the higher the ratio, the better the prediction.
Sp: denotes the specificity. It’s defined as the ratio of correctly predicted exon nucleotides to all predicted exon nucleotides also the higher the ratio, the better the prediction.
CC: denotes the correlation coefficient. Definitions of TP, FP, TN and FN are explained in Table 3.
Table 2. Comparison between six numerical mapping techniques in splicing site prediction (TA and TD denote to average threshold of acceptor and donor site for testing genes)
|
Method |
Representation |
Threshold |
S„ |
Sp |
CC |
|
Atomic number [18], 1992 |
A=70, C=58, G=78, T=66 |
TA = 0.1844 |
0.992 |
0.995 |
0.991 |
|
TD = 0.1794 |
|||||
|
Integer [12], 2002 |
A=2,C=1, G=3,T=0 |
TA = 0.1834 |
0.997 |
0.990 |
0.990 |
|
TD = 0.1788 |
|||||
|
Real [13], 2004 |
A=-1.5,C=0.5, G=-0.5,T=1.5 |
TA = 0.1810 |
0.999 |
0.989 |
0.991 |
|
TD = 0.1780 |
|||||
|
EIIP [17], 2006 |
A=0.1260, C=0.1340, G=0.0806, T=0.1335 |
TA = 0.1856 |
0.998 |
0.996 |
0.996 |
|
TD = 0.1797 |
|||||
|
Paired Numeric [7], 2008 |
A or T = 1, C or G = -1 |
TA = 0.1849 |
0.999 |
0.993 |
0.994 |
|
TD = 0.1790 |
|||||
|
DNA walk [19], 2009 |
C or T = 1, A or G = -1 |
TA = 0.1833 |
1.000 |
0.985 |
0.989 |
|
TD = 0.1787 |
T able 3. tp,fp,tn and fn definitions
|
Actual |
Predicted |
Symbol |
|
Exon |
Exon |
True positive (TP) |
|
Exon |
Intron |
False negative (FP) |
|
Intron |
Exon |
False positive (TN) |
|
Intron |
Intron |
True negative (FN) |
An example of one gene has three exons shown in figure 7. Where the maximum peaks indicate the position of the two terminal of each exon (acceptor and donor sites).
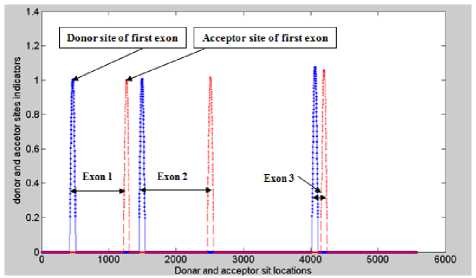
Fig. 7. Splice site indicator location
-
V. Conclusion
Prediction of donor and acceptor sites locations in human genes is presented in this paper, where ANN with different mapping methods are adopted and implemented to improve accuracy of prediction. The NN has been trained and tested on human genes of chromosome 21. After training the NN, the splice site location is predicted without prior knowledge of any splicing site signals, like ‘GT’ for the donor splice sites, or ‘AG’ for the acceptor splice sites. Influence of the choice of numerical representation on the quality of prediction of splicing sites in the human gene data set was investigated. Where, results show that the selection of the appropriate numerical representation with training NN can greatly influence on the performance of NN. Since, it depends on how well the numerical representation reflects the biological information in mathematical domain. EIIP mapping technique of windowed DNA gene sequence with NN have demonstrated high accuracy performance in splicing sites prediction and proven to be very competitive to the high performance rather than other mapping methods.
References Integrated Model of DNA Sequence Numerical Representation and Artificial Neural Network for Human Donor and Acceptor Sites Prediction
- Limin Fu. Neural Networks in Computer Intelligence. Tata MCGraw-Hill Edition.
- Howard D. and Mark B. (2009) “Neural Network Toolbox for Use With MATLAB”, user’s guide, version 6, (www.mathworks.com, last accessed 10 oct. 2013).
- Lapedes, A., et al. Application of Neural Networks and Other Machine Learning Algorithms to DNA Sequence Analysis [A]. The Proceedings of the Interface Between Computations Science and Nucleic Acid Sequencing Workshop, Dec. 1988 in Santa Fe. New Mexico. Eds. G.I. Bell and T.G. Marr. Proceedings of the Santa Fe Institute Addison- Wesley, 1988, VII: 157-182.
- Sqren b. et al. Prediction of human mRNA donor and acceptor sites from the DNA sequence. Technical report, Lyngby, Denmark, 1991.
- Artemis H. et al. Functional site prediction on the DNA sequence by artificial neural networks. Intelligence and Systems [C]. IEEE International Joint Symposia, Rockville, MD, 1996, 12-17.
- Richard O. D. et al. Pattern Classification (2nd Edition). Wiley-Interscience, 2000.
- M. Akhtar. Signal Processing in Sequence Analysis: Advances in Eukaryotic Gene Prediction [J]. IEEE Journal of selected topics in signal processing, 2008, 2(3): 310 – 321.
- M. Abo-Zahhad. et al. Genomic Analysis and Classification of Exon and Intron Sequences Using DNA Numerical Mapping Techniques [J]. I.J. Information Technology and Computer Science, 2012, 4(8): 22-36.
- H. K. Kwan and S. B. Arniker. numerical representation of DNA sequences Electro/Information Technology [C]. eit '09. IEEE International Conference , Windsor, 2009, 307-310.
- R. F. Voss. Evolution of long-range fractal correlations and 1/f noise in DNA base sequences, Phys. Rev. Lett., 1992, 68(25): 3805–3808.
- P. D. Cristea. Conversion of nucleotides sequences into genomic signals. J. Cell. Mol. Med.6, 2002, 279-303.
- P. D. Cristea. Genetic signal representation and analysis [C]. in Proc. SPIE Inf. Conf. Biomedical Optics, , 2002, 4623: 77–84.
- N. Chakravarthyet al. Autoregressive modeling and feature analysis of DNA sequences [J]. EURASIP Journal of Genomic Signal Processing, 2004, 1, 13-28.
- M. Akhtar et al. On DNA numerical representations for period-3 based exon prediction [A]. in Proc. of IEEE Workshop on Genomic Signal Processing and Statistics (GENSIPS), 2007, 1-4.
- S. S. Nair and T. Mahalakshmi. Visualization of genomic data using internucleotide distance signals [C]. in Proceedings of IEEE Genomic Signal Processing, Bucharest, 2005, 11–13.
- M. Abo-Zahhad et al. A New Numerical Mapping Technique for Recognition of Exons and Introns in DNA Sequences [C]. The 30th National Radio Science Conference, NTI, Cairo, Egypt, 16th - 18th April 2013, 573-580.
- Achuthsankar S. Nair and Sreenadhan S. Pillai. A coding measure scheme employing electron-ion interaction pseudo potential (EIIP) [J]. Bioinformation, 2006, 1, 197-202.
- T. Holden et al. ATCG nucleotide fluctuation of Deinococcus radiodurans radiation genes. in Instruments, Methods, and Missions for Astrobiology X [C]. Proceedings of Society of Photo-Optical 2 Instrumentation Engineers (SPIE) Conference, 6694 (SPIE, 12 September 2007), 669417-1–669417-10.
- C.-K. Peng, S.V. Buldyrev, A.L. Goldberger, S. Havlin, F. Sciortino, M. Simons, H.E. Stanley, A.L. Goldberger, S. Havlin, C.-K. Peng, H.E. Stanley, G.M. Viswanathan, Analysis of DNA sequences using methods of statistical physics. Physica A, Elsevier Science B.V, 1998, 249: 430-438.
- R. Zhang and C. T. Zhang, Z curves. An Intuitive Tool, for Visualizing and Analyzing the DNA sequences [J]. J. BioMol. Struct. Dyn, 1994, 11: 767-782.
- Qystein J. et al. Gene Splice Site Prediction using Artificial Neural Networks. Master's theses (TN-IDE), University of Stavanger, Norway. 2008.
- Qystein J. K-means separated neural networks training with application to backgammon evaluations. Technical report, University of Stavanger. 2007.
- D Karolchik, AS Hinrichs, TS Furey, KM Roskin, CW Sugnet, D Haussler, WJ Kent. The UCSC Table Browser data retrieval tool. Nucleic Acids Res. 32(Database issue), 2004, D493-496.
- J Goecks, A Nekrutenko, J Taylor, The Galaxy Team, Galaxy: a comprehensive approach for supporting accessible, reproducible, and transparent computational research in the life sciences. Genome Biology, Article R86, 2010 11(8).
- D Blankenberg, G Von Kuster, N Coraor, G Ananda, R Lazarus, M Mangan, A Nekrutenko, J Taylor, Galaxy: a web-based genome analysis tool for experimentalists. Curr. Protoc. Mol. Biol. Chapter 19, Unit 19.10.1-21, 2010.
- B. Giardine et al. “Galaxy: a platform for interactive large-scale genome analysis. Genome Res. 200515(10): 1451–1455.
