Integrated Topic Modeling and Feature Engineering for High-accuracy Sentiment Classification in Consumer Reviews

Author: Vijay Gupta, Punam Rattan, Mukesh Kumar
Journal: International Journal of Intelligent Systems and Applications @ijisa
Article in issue: 2 vol.18, 2026.
Free access
The rapid rise of mobile technology paired with the steady growth of the internet, has led to a massive increase in the amount of user generated content, such as online consumer reviews, accessible through the browser. As the volume of user-generated content continues to rise, it becomes increasingly important to develop sophisticated methods for performing sentiment analysis on the texts collected from users, especially those that have been generated in relation to restaurants and similar types of service establishments. In this paper, we will present a new approach to sentiment analysis which incorporates Latent Dirichlet Allocation topic models, Term Frequency- Inverse Document Frequency vector representations and XGBoost Classifiers into a unified framework. Unlike conventional implementations, this study integrates probabilistic topic distributions from LDA with multi-level n-gram TF-IDF features and evaluates their combined impact using XGBoost for enhanced classification performance. Using three distinct n-gram levels (unigrams, bigrams, and trigrams), we will evaluate various aspects of text-based data including common linguistic patterns and sentiment trends. Higher-order n-grams were included to capture contextual dependencies beyond single-word features. Overall, our results demonstrate that the performance of our proposed framework is superior to traditional corpus-based models on multiple evaluation metrics, including: classification accuracy 96.07%, classification sensitivity 95.43%, classification specificity 97.12% and F1-Score 96.16%.
Latent Dirichlet Allocation, Term Frequency-Inverse Document Frequency, XGBoost Classifier, Topic Modeling, N-gram Features, Sentiment Analysis
Short address: https://sciup.org/15020317
IDR: 15020317 | DOI: 10.5815/ijisa.2026.02.02
Text of the scientific article Integrated Topic Modeling and Feature Engineering for High-accuracy Sentiment Classification in Consumer Reviews
Published Online on April 8, 2026 by MECS Press
Customer feedback has become an extremely important factor influencing a buyer's purchase decision between competing products and services. The rise of Internet and social media technology has greatly influenced how customers share their experiences with others, including people living thousands of miles away. Approximately 90% of the content currently available on the Internet originated from active users of social media platforms, primarily through Web 2.0 and the later introduction of mobile technology. The production of user-generated content creates a greater level of direct interaction among users and encourages users to take a more active role in business and product-related decisions. In fact, according to [2], the consumers' opinion about a company's product on social media is something that many potential buyers consider before making a purchase, often more so than the company's own advertising. The best example of this is the fact that almost 90% of all companies in existence today have an average budget of approximately 11% of their total annual budget earmarked for consumer engagement in social media [1]. Effective evaluation of consumer feedback and providing timely feedback is an important part of establishing and maintaining positive customer relationships. Research indicates that the faster a company responds to its customers on social media, the more likely it is to retain customers over time [2]. Social media and micro blogging have now become the primary sources of customer feedback. Most of the information about products and services used by businesses in the business decision-making process comes from customer input that is sourced through these types of platforms, many of which operate as data aggregators or providers of decision-making data for businesses using customer feedback on products and services. These platforms have also assisted customers when searching for product and service information and have enabled businesses that use these platforms to promote their products and services more effectively [3]. In addition, businesses can use consumergenerated feedback to improve their products and services.
Consumers interacting via internet technology often continue to influence each other to provide their feedback and opinions. This leads to a sharp increase in the number of comments posted to social media and micro blogs about products and services [4]. The authors of [5] refer to this behaviour as "calling to the customer with the customer's voice." Today's consumer also has a keen interest in using social media and micro blogs as a source of information for products and services. The primary reasons for this interest could be that (i) customers will post about their experience of using a brand or product that inspired them as an individual; and (ii) customers are more likely to use text to express themselves than they are to use voice or speech. Therefore, since writing is typically a better medium of expression in social media and micro blogs, much of the content shared by consumers is represented purely through text. The consumer created most of the textual content in their native language(s); thus, referring to the textual evidence of consumer opinion in these forms of media is equivalent to assigning the consumer's needs to the production process. Therefore, various data mining-based methods have been developed to allow for the systematic review of the respondents' opinions gathered through social media and micro blogs. In fact, the cost and difficulty associated with attempting to measure the opinions of individuals using traditional means of measurement is an ongoing issue [6]. According to the authors of [7], sentiment analysis represents a very popular research area in both academic and industrial work. The authors of [8] note that sentiment analysis can be applied at the document, sentence, or target level. In addition, this analysis typically uses multiple classification algorithms, as the target term can be expressed in multiple ways [8]. This analysis has become a common technique in reviewing companies through user reviews, as consumer sentiment can be directed at multiple targets, such as restaurants and hotels. When using the above method, the system receives input from users' comments about restaurants and summarizes them based on the characteristics of product features that might affect a given business (i.e., food, service, price) [9].
The primary objective of this study is to develop an integrated sentiment analysis framework that combines topic modeling and feature engineering techniques to enhance classification performance on restaurant reviews. Specifically, the work aims to investigate the effectiveness of combining LDA-based topic distributions with multi-level n-gram TF-IDF features using an XGBoost classifier.
The remainder of this paper is organized as follows: Section III presents the proposed methodology, including data preprocessing, feature extraction, and classification approach. Section IV discusses the experimental results and performance evaluation. Finally, Section V concludes the paper and outlines potential directions for future research.
2. Literature Review
Recent advancements in mobile device technology, internet access, and access to information via these platforms have given individuals the ability to express their feelings and thoughts through audio, visual and written media and to utilize various communication tools to do this. The researchers have identified different types of forms, and that the original form will correspond to a specific platform. For example, sharing on virtual platforms (e.g., forum discussions or blog posts) is always in writing. The publishing of Consumer-Generated Content (CGC), including product reviews, restaurant reviews and film reviews, has generated a lot of interest in the community and attracted the attention of many (e.g., reviewers) who write reviews and/or provide reviews to the public. These reviews are useful to others because they provide a good indicator of the satisfaction or dissatisfaction of other users with respect to the product being reviewed, the meal being reviewed or the film being reviewed. In addition, the fact that CGC provides true data to be utilized for research purposes in sentiment analysis also provides the researcher with the opportunity to conduct these data analyses for the purpose of identifying patterns or bias of one or more of these forms of CGC. As the desire of researchers to conduct data analysis of these types of data set continues to grow, it has become progressively more difficult to manually conduct these types of analyses due to the increasing numbers associated with the number of records that one can find in these types of data sets. As a result, researchers now must rely on the automated analysis of CGC (computer automated analysis of comments on a continuous or intermittent basis) because of the inability to manually analyze these massive amounts of data associated with CGC. Consequently, the demand for various algorithms associated with machine learning, artificial intelligence, and data mining continues to rise. In recent years, several algorithms of other types have been developed using machine learning, artificial intelligence, and data mining to extract hidden patterns from CGC, and analyse the data to make predictions about the data in the future. Target Term Extraction (TTE) is one of the core ABSA subtasks, and it means to retrieve the target term(s) corresponding to different views expressed in different documents [10]. Identifying the target terms is the foundation of TTE, which is the first step in Target-Based Sentiment Analysis. According to the authors of [11], there are two key issues regarding identifying the Target Term, as it is a requirement for sentiment analysis. The first issue is the inability of sentence-level sentiment analysis to provide accurate or qualified information [12]. The second issue is that in many sentences or paragraphs, there are targets with different polarities. Therefore, summarising the single sentence or paragraph will be challenging [13]. The target terms must be obtained from the text corpus for both problems. An example is the sentence “The pizza was delicious, but the service was terrible.” Two target terms, “pizza” and “service,” may be extracted from this example. Most of the TTE Research issues in ABSA are based on machine learning research at the three levels of learning: supervised, semi-supervised, and unsupervised [14]. Overall, it appears that most of the machine learning TTE studies have favoured the traditional supervised machine learning methods. Target Extraction Studies using ROI Classification Method were performed in studies with a HAST [12] as a classification type in a supervised study of target extraction; CL-BERT [15]; CMLA [16]; and DE-CNN [17]. History Attention and Selective Transformation (HAST) represent the target term using a historical order of the comments among others. CL-BERT is the version of BERT (which is a pre-trained Natural Language Processing method) that uses a Constituency Lattice Method in combination with the attention mechanism to improve the performance of Translate Machine Learning using the attention mechanism on the neural machines compared to traditional approaches to linguistic processing. As a result, the decoders can access the target sequence as they process each of the hidden states, helping to minimize the impact of some hidden states on each decoded target term. Coupled Multi-Layer Attentions (CMLA), as a method for identifying target term attention (or aspect attention) and opinion attention, leverages multi-layer attentional pairs to create a representation of the target terms and/or aspects for which it is possible to identify and match.
The Task Two for ABSA involves determining whether the target categories provided in the assigned sentence belongs to the pre-defined category sets specific to the domain. The model must also determine that the target categories will continue the previous example of identifying food and service categories as well. The authors of [18, 19, 20] state that from the perspective of providing a better understanding of consumers; identifying the target categories offers two advantages compared to the target terms used previously. One being that the target term explains well each of the individual terms; on the other, the target category does an overall good job of describing the entire set of terms (the umbrella term [21]), plus can be used to detect the individual target term within the same sentence without using a reference to it being a target term (using [22]). For example, in the example of "The prices are way too much and the food is terrible", the engine will be able to identify that they each have a category of "price" and "food", respectively. The related task of identifying target categories using machine learning techniques has already been studied in due respect to the previously mentioned supervised and unsupervised [23] methods. In the studies, humans were much less represented in the articles in comparison to the first sub-task of Category Detection (CD), with most of them utilizing guided techniques such as Language Independent Category Detection (LICD) and Representation Learning (RepLearn). Additionally, LICD is the only method which allows for the detection of categories without being limited by language and uses a methodology based on the idea that any sentence that falls into a specific category will likely have a high level of semantic similarity with a specific set of keywords related to the category; therefore, categorizing based on a known category, and the determined similarity between the target and the given keywords based on this established framework will yield a representative sample of that specific category. In contrast, RepLearn is a learning method that applies to unlabelled, large data-sets and collects data based on the semantics of each term in relation to one another; therefore, allowing easily for the determination of semantic relationships within large volumes of unlabelled data. While both are guided techniques, many researchers use Self-Supervised Contrastive Learning (SSCL) and contrastive attention (CAT) as a method for categorizing or utilizing unsupervised machine learning techniques. For example, SSCL can help identify the correct representation of a specific segment of a comment by training two alternative representations of a comment to reach a maximum level of agreement between the two representations and thus, producing the appropriate target embedded within the correct representation of the target/embedded comment segment [24]. Another method, CAT, will use a Radial-Basis Function to find and remove information that does not relate to a target product from a comment to produce an appropriate representative sample of the specific category of the corresponding comment segment.
Thus, these methods are consistent with previous studies using target-oriented emotion word extraction preferred, IOG [25], maxSAT (maximum satisfiable clause) [26], Position Embed [27], and ONG [28] methods and/or focused on the second or positional dimension. The first method for which the DeepWmaxSAT has been developed has not previously been described as a combination of information on deep weighting as defined to generate a target term extraction and/or the maxSAT (maximum satisfiable clause) with the intent to maximize the number of maximum semantic-coherency sentences through mathematical means to generate maximum satisfiability clauses. The distance (i.e., relative position) of the words embedded at varying distances from the targeted emotions, will be considered through the target emotions, referred to in previously disclosed Position Embed methods, in relation to the mean distance between the emotional embedded word(s), and, therefore, the proximity of the target emotional word(s). According to IOG's, their model is an LSTM neural network. The authors compared the corpus of text with the target terms being present (inward and outward) versus not being present in their corpus (with no target term). The authors then analysed the dataset regarding their expressions in the global context with respect to the target emotion being inferred from the dataset values.
There are other studies in the literature that combine the first three subtasks all together to derive target-based analysis from the reviews written in Czech and English Restaurant reviews [29]. Using models that were created to perform sentiment analysis using HAL, CBOW, COALS, LDA, SKIP, and GloVe to generate results from two datasets (1. Reviews about laptops and 2. Reviews about restaurants) based on the data, the F1 scores were found to be 75.66% and 71.48% for the Czech and English results in identifying the target terms and 77.68% and 71.68% for the target categories. The accuracy of the sentiment polarity values for the same datasets was measured at 67.48% and 69.68% respectively. Another study [30] utilized a machine learning approach for completing four subtasks within one data source in conjunction with another data source in terms of restaurant and laptop data provided for SemEval-2014.Using structured learning, the UNITOR method was both applied to the laptop and restaurant data, obtaining F1 Score results of 75% and 84%, respectively, for detecting target-term, and all other results indicating an accuracy of 80.95% and 70.48%, respectively, for determining whether a given target term has positive or negative polarity. Next, to determine target category, only using restaurant data, the authors reported that they reached maximum F1 score performance of 89%. Past literature has shown that sentiment analysis has been mainly used to classify whether a given expression belongs to a positive or negative class within a specific dataset. Sentiment analysis gives individuals the knowledge they need to make informed decisions about which products to purchase, etc. In this research study, The findings of the research study showed that the classifier model performed well when compared to the high dimensional data, as well as produced a high accuracy level for performing a sentiment analysis of restaurant reviews. The remaining sections of this paper will provide further discussion of the enhancements that using topic modeling has made to the performance metrics of machine learning algorithms (i.e., accuracy and precision levels) when the two features (i.e., topic modeling feature and word feature) are combined using the TF-IDF vectorization technique. The most significant contribution our work has made to the research study compared to other published studies is our ability to represent the data at the semantic topic level (with respect to the term importance). Additionally, we have thoroughly evaluated the differences between the two datasets by providing a comprehensive evaluation of the XGBoost Classifier against the associated code and thus the differences from the topic analysis distributions. In Section III of the paper, we discuss the proposed methodologies for the study, including how to pre-process the data, how to model the topics, and how to extract features (topic and word) from the data. In Section IV, we visually report the results of our research study to show how the performance of the classifier was enhanced with the addition of the combined feature sets. Section V concludes with a summary of the research study and recommendations for future research directions.
3. Proposed Methodology
This proposed methodology aims to improve the sentiment analysis performance over restaurant reviews through a series of multi layered approach which is Topic Modeling using Latent Dirichlet Allocation (LDA) for feature extraction through Term Frequency Inverse Document frequency (TF-IDF) and classification through XGBoost. In this manner, the framework is going to help in gaining better understanding of customer sentiments using advanced data mining techniques and machine leaning classifiers. LDA is used to extract latent semantic topic distributions which complement TF-IDF features by capturing thematic structure beyond surface word frequency. Clearly, the flow diagram of the proposed methodology is shown in Fig. 1.
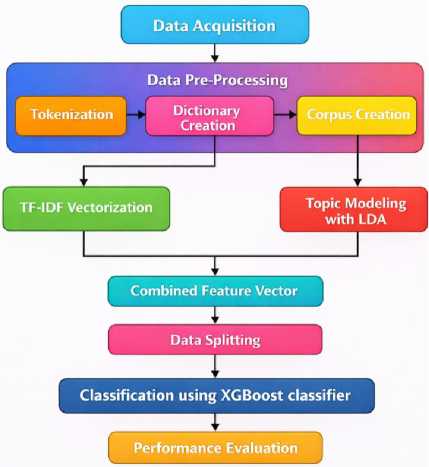
Fig.1. Overall architecture of the proposed LDA–TF-IDF–XGBoost sentiment classification framework
Each step is detailed in the following sections and the theoretical foundation and mathematical formulations are included for each step.
-
3.1. Data Acquisition and Preprocessing
The study uses the Kaggle Restaurant Review Dataset
consisting of 10000 reviews, with a balanced distribution of positive and negative classes. restaurant reviews which are in form of textual feedback from consumers need to be acquired and this process requires some level of preprocessing. D = {R1, R2,..., Rn}, where each review R^ comprises of the sentiment label y t (y^ £ {0,1}, negative (0) or positive (1) sentiment. Standard preprocessing including tokenization, stopword removal, lemmatization, and cleaning was applied before feature extraction.
-
A. Tokenization and Data Cleaning
The process of cleaning and tokenization of raw text data is done such that it is ready for further analysis. In this step, unnecessary characters are removed and the text is broken into individual units (tokens).
Cleaning Formula: Cleaned Text i = RemoveHTML(RemovePunctuation(Review i )) (1)
The function Review i is the original text with HTML removed using the function RemoveHTML and punctuation removed, using the function RemovePunctuation.
-
B. Lemmatization
-
3.2. Feature Extraction: LDA and TF-IDF
To make the analysis more efficient lemmatization is done to reduce words to their root forms. For example, "running" becomes "run". This guarantees the same form of the words will be treated as equivalent.
Mathematical Representation: Lemma(t) = troot, troot £ {run,play,eat,...] (2)
Given t a token in the review, and troot is its associated root form.
The second stage is the transformation of the text data into numerical format which is suitable for the machine learning model. The two techniques used are LDA for topic modelling and TF-IDF for the feature representation. Although LDA and TF-IDF are statistically related, LDA captures semantic topic distributions while TF-IDF captures term importance. Their combination improves representation richness.
-
A. Latent Dirichlet Allocation (LDA) for Topic Modeling
Probability model, Latent Dirichlet Allocation (LDA), is adopted to discover hidden thematic structures (topics), which are underlying in the reviews. Assuming that each review is a mixture of topics, it takes that each topic can be modelled by a word distribution. The topic distributions are modelled using Dirichlet distributions out of the LDA model. Mathematical formulation is given by assuming the corpus D = {D 1 ,D2, ■■■,Dn} as the set of n reviews denoted by sequences of words W [ . It is assumed that each review Dt is generated from a mixture of К topics {z 1 , z2,..., zK}.
Topic-Document Distribution: в [ is the topic distribution for each review Dt , and it follows a Dirichlet distribution.
Qi ~ Dirichlet(a) (3)
Where a is a parameter which controls sparsity of topic assignments.
Topic-Word Distribution: The vocabulary has an associated word distribution фк per topic zk . A Dirichlet prior models this distribution.
фк ~ Dirichlet(^)
Where P sets the sparsity of word assignments within each topic.
Generative Process: The way words are generated in a review is a topic distribution Q j is sampled from a Dirichlet distribution under each review Dt . For each word W [j in review Dt , a topic zt j is sampled from в [ , and generate a word from фг1 j .
zU
~ Multinomial(el),wlj
~
Multinomial
(^zi i }
LDA’s output is a matrix of topic distributions в [ for each review D^ where each в [ is a probability vector over К topics.
-
B. TF-IDF Vectorization for Feature Representation
To measure the importance of each word in the document relative to the whole corpus, TF-IDF (Term FrequencyInverse Document Frequency) is applied. The aim is to increase the value of the words which are prevalent in some specific document but rare over the whole corpus.
Term Frequency (TF): The term frequency of a word t in a review Di is given by:
Count of t tn D i
To ta I number of terms tn D i
Inverse Document Frequency (IDF): The term t with IDF is calculated as:
--—<( .". : (7)
Where N is total number of documents, and df(t) is number of documents containing term t.
TF-IDF Calculation: Define the TF-IDF score of a word t in a document Di as:
TF-IDF(t,Di) = TF(t,Di) x IDF(f) (8)
-
3.3. Combining LDA and TF-IDF Features
-
3.4. Classification using XGBoost
Both the LDA topic distributions and TF IDF features are concatenated to get further enhance the feature representation. The use of LDA and TF-IDF enables us to create a richer feature vector that contains both the semantic topics of the reviews as specified by LDA and the importance of individual words according to TF-IDF.
Combined Feature Representation: We denote FLDA as the nx К matrix of LDA topic distributions, and F tfidf as the nxT TF-IDF matrix, where T is the vocabulary size. These two matrices are concatenated to obtain the combined feature matrix F C ombined .
Combined = [ F LDA 1 F TFIDF ] (9)
Fcombine d is combined to have size nx (К + T) combining both topical and term-based feature.
With the features extracted, the sentiment is classified using XGBoost (Extreme Gradient Boosting). The dataset was divided into training and testing sets using an 80:20 split. XGBoost is a gradient boosting algorithm that makes use of decision tree as its base learner, to optimize the objective function.
-
A. Model Initialization and Objective Function
XGBoost has an objective function made up of two parts: a loss function and regularization term. The error is measured by a loss function based on the difference between predicted and true labels, and regularization term acts to prevent overfitting. The objective function is mathematically represented as:
Lte^T^ i Lossty iJ tX i^ +ATf^ (10)
Where:
-
• yi is the true sentiment for review i,
-
• f(xi) is the predicted sentiment for review i,
-
• A is the regularization parameter,
-
• Q j is a parameter of the decision tree.
Loss Function: For binary classification, the loss function is usually taken to be logistic loss:
Loss(yi,f(xi)') = log(1 + e ~y i f(X l ) (11)
-
B. Training the Model
The XGBoost model is an iterative procedure in which it adds one decision tree at a time to minimize the loss function. The method is to add a new tree at each iteration to correct the errors of previous discovered trees. The gradient and Hessian of the loss function are used to inform the tree building process.
Gradient Calculation: Gradient i
dLoss df(xt)
Hessian Calculation: Hessiani
d2Loss df^ t )2
Tree Update: The computed gradients and Hessians are used to update each tree in turn.
f new (x i ) = f oid&d + ^x Gradient
Where ^ symbolizes for the learning rate.
-
C. Model Evaluation
Various metrics such as accuracy, precision, recall and F1 score are used to evaluate the model performance. Thus, these metrics give an overall idea of the model’s ability of classifying sentiments correctly.
Accuracy =
TP+TN
TP+TN+FP+FN
TP, TN, FP, and FN are interpreted as counts of true positives, true negatives, false positives, and false negatives, respectively.
|
TP Precisian = TP+FP |
(16) |
|
TP Recall = TP+FN |
(17) |
|
PreclslonxRecall F1-Score = 2 x Precision+Recall |
(18) |
3.5. Results Visualization
4. Results and Discussion4.1. Evaluation Parameters
The results of the classification task are visualized such that additional insights about the model's performance and behaviour can be gained.
Sentiment Distribution: The distribution of positive, negative, and neutral sentiments of the dataset is shown using a bar plot.
Feature Importance Visualization: The most influential features (terms or topics) in the prediction of sentiments are shown in a bar chart or word cloud.
The improvement in classification performance can be attributed to the incorporation of LDA-based topic distributions, which provide a higher-level semantic abstraction of the review content. While TF-IDF captures term importance at the lexical level, LDA identifies latent thematic structures that help distinguish sentiment-bearing patterns across documents. This additional semantic representation enhances feature separability in the feature space, allowing the XGBoost classifier to make more discriminative decisions. As a result, the combined feature representation improves overall robustness and classification accuracy.
The evaluation parameters used to assess the performance of sentiment classification models include True Positive (TP), True Negative (TN), False Positive (FP), and False Negative (FN). True Positive (TP) refers to the number of restaurant reviews that are correctly classified as having a positive sentiment. True Negative (TN) denotes the count of reviews that are accurately identified as not possessing a positive sentiment, indicating correct classification of negative or neutral sentiments. False Positive (FP) captures the number of reviews that are mistakenly classified as positive when they convey a negative sentiment. Lastly, False Negative (FN) represents the number of reviews that are incorrectly labeled as negative, even though they genuinely express a positive sentiment. These parameters form the foundation for calculating key performance metrics such as accuracy, precision, recall, and F1-score, which are critical for evaluating the effectiveness of sentiment analysis models.
Table 1. Definition of evaluation parameters used for sentiment classification
|
Parameters |
Description |
|
TP (True Positive) |
The number of restaurant reviews accurately classified as having a positive sentiment. |
|
TN (True Negative) |
The count of reviews correctly identified as not having the positive sentiment. |
|
FP (False Positive) |
The count of reviews misclassified as positive when they have a negative sentiment. |
|
FN (False Negative) |
The number of reviews incorrectly classified as negative when they truly have a positive sentiment. |
-
4.2. Comprehensive Visualization of Textual Data Analysis
Fig. 2, shows a bar chart of the most common words (called unigrams) found in a set of reviews, likely about food or drinks. Each bar represents how many times a word appeared. For example, the word "like" was used the most, followed by "good", "taste", "flavor", and "great", which are mostly positive words. This suggests that many reviews had a positive tone. Some words like "coffee", "chip", "tea", and "product" show that the reviews were about food items. One word, "br", seems to be an error or formatting issue. Overall, the chart helps to understand what words people used most often in their reviews.
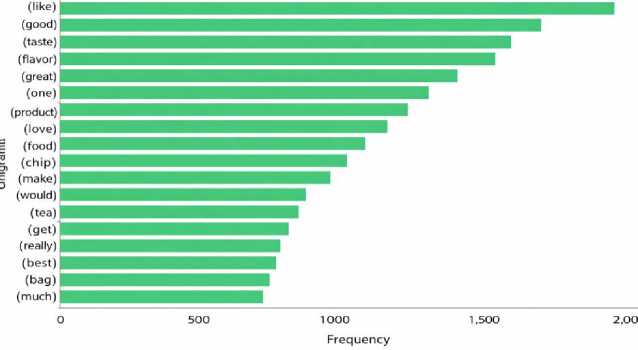
Fig.2. Top 20 most frequent unigrams extracted from positive restaurant reviews
Fig. 3, is a bar chart showing the top 20 unigrams (individual words) that appear most frequently in negative statements within a dataset, likely containing product reviews. Each bar shows how often a word appears in negative reviews. The most common word is "product", followed by "taste", "br" (which is likely a formatting issue), "like", and "one". Words like "bad", "don’t", "would", and "dog" suggest dissatisfaction or complaints. Words like "chip", "tea", and "box" show that users were referring to specific food items or packaging. This chart helps to understand which words are often used when customers express negative opinions, which can be useful for improving product quality or customer experience.
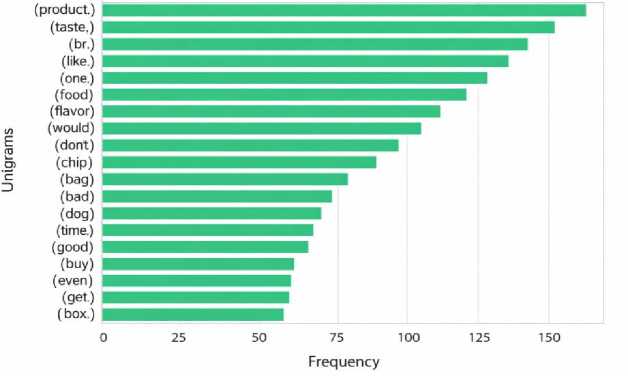
Fig.3. Top 20 most frequent unigrams extracted from negative restaurant reviews
Fig. 4 shows a horizontal bar chart of the top 20 bigrams (pairs of consecutive words) found in positive statements from a dataset, likely customer reviews. This highlights the most frequent word pairs used in reviews expressing positive sentiment. The most common bigram is "dog food", followed by "gluten free", "grocery store", and "taste like". These combinations suggest customers often praised the food quality (especially pet food), dietary features (like gluten-free), and availability in stores. Bigrams such as "highly recommend", "potato chip", "hot chocolate", and "taste great" reflect favourable opinions about taste and product recommendations. Other positive expressions include "much better", "really good", and "variety pack", which indicate customer satisfaction with flavor, quality, and packaging options.
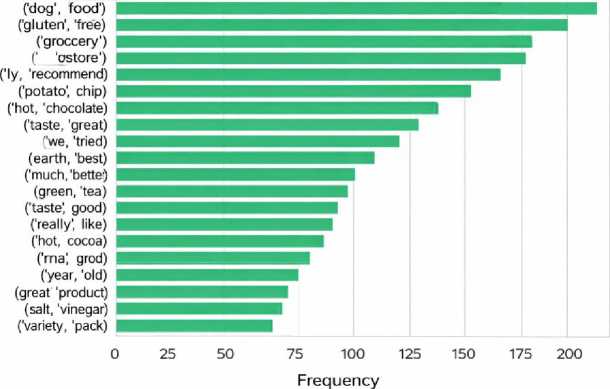
Fig.4. Top 20 most frequent bigrams identified in positive restaurant reviews
Fig. 5, displays a horizontal bar chart of the top 20 bigrams (two-word combinations) found in negative statements, likely from customer reviews. This highlights common word pairs used when customers expressed dissatisfaction. The most frequent bigram is "dog food", which might indicate recurring issues in pet food reviews. Other frequently used negative phrases include "taste like", "cannot", and "don't know", reflecting uncertainty, dislike, or limitations. Bigrams such as "waste money", "never buy", and "don't like" clearly indicate disappointment or regret. Also, phrases like "hot chocolate", "grocery store", "potato chip", and "coconut water" suggest that specific product types were often criticized. Overall, this figure helps identify the most common complaints or concerns among users, offering insights that can help businesses improve their products or services based on customer feedback.
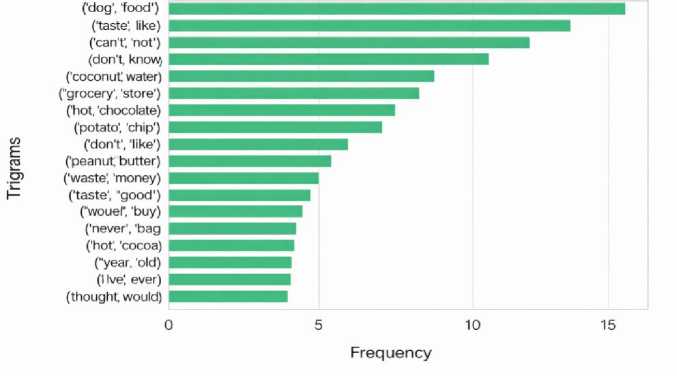
Fig.5. Top 20 most frequent bigrams identified in negative restaurant reviews
Fig. 6, presents a horizontal bar chart showing the top 20 trigrams (three-word combinations) found in positive statements, likely taken from product reviews. This chart highlights the most common trigrams used when people expressed satisfaction. The most frequent trigram is "grocery store", suggesting many users discussed product availability or purchase experience positively. Other popular trigrams include "recommend product", "sea salt vinegar", and "highly recommend chip", showing that users often praised product quality, especially snacks. Trigrams like "can’t go wrong", "health food store", and "key lime pie" also appear, indicating appreciation for flavor, health aspects, or specific products. The frequent use of positive action words like "recommend", "like", and "love" shows overall customer satisfaction. This figure helps identify not only what customers liked but also how they described their positive experiences, which can be useful for marketing and product improvement. Overall, the chart helps identify phrases that frequently appear in positive feedback, offering useful insights into what customers appreciate most.
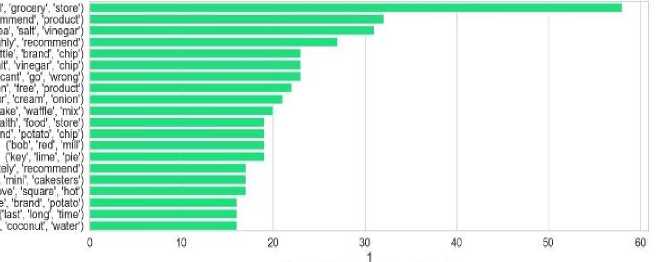
Fig.6. Top 20 most frequent trigrams identified in positive restaurant reviews
Fig. 7, displays a horizontal bar chart of the top 20 trigrams (three-word combinations) found in negative statements, most likely from product reviews. This figure which word combinations are most used when people write negative reviews. The most frequent trigram is "fructose corn syrup", suggesting concern about unhealthy ingredients. Other commonly seen trigrams include "grocery store", "corn syrup", "low carb diet", and "packet per oz", which point to customer dissatisfaction related to ingredients, diet compatibility, or packaging. Phrases like "waste money", "hard find store", and "hydrogenated oil" express frustration with product value, availability, or unhealthy content. Additionally, trigrams such as "even taste good", "least nothing like", and "steak tasty time" show disappointment with taste or quality.
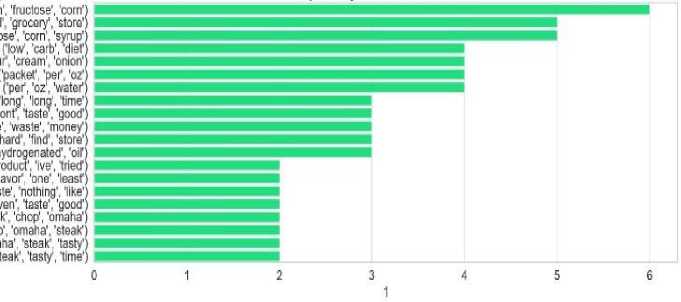
Fig.7. Top 20 most frequent trigrams identified in negative restaurant reviews
Overall, this chart highlights specific phrases customers use when expressing negative feedback, helping businesses understand product areas needing improvement. To describe Fig. 8, titled Positive Sentiment (a), Negative Sentiment (b), and Neutral Sentiment (c) illustrates the distribution of sentiments positive, negative, and neutral found within the analyzed reviews. In subfigure (a), the chart likely highlights that a significant portion of the reviews express positive sentiment, indicated by frequent use of favorable words or phrases. Subfigure (b) focuses on negative sentiment, showing commonly used critical or unfavorable terms that suggest dissatisfaction. Subfigure (c) represents neutral sentiment, which includes reviews that are neither strongly positive nor negative, often containing balanced or factual statements. Together, these visualizations help in understanding the overall emotional tone of the customer feedback and the key expressions associated with each sentiment category.
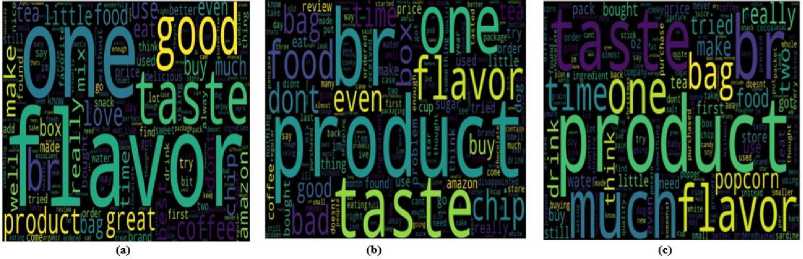
Fig.8. Distribution of sentiment classes in the dataset: (a) Positive, (b) Negative, and (c) Neutral
A detailed comparison of performance metric of the Corpus based as well as LDA enhanced TF-IDF approaches with sentiment analysis is presented in Table 2. The metrics show that LDA based TF-IDF method outperforms Corpus for all the metrics shown on the table. More specifically, 96.07% accuracy is the accuracy for the LDA based TF IDF approach whereas the accuracy for the Corpus approach is 94.21%. We provide other metrics of this improvement in accuracy: the LDA based TF IDF approach has less error rate (3.93% vs. 5.79%), more sensitivity (95.43% vs. 93.85%), greater specificity (97.12% vs. 94.56%), and higher precision (95.78% vs. 92.85%). The high performance may be attributed to balanced class distribution and enriched feature representation.
Table 2. Performance comparison between corpus-based TF-IDF and proposed LDA-enhanced TF-IDF approach
|
Performance Parameters |
Corpus |
LDA-based TF-IDF |
|
Accuracy |
94.21% |
96.07% |
|
Error Rate |
5.79% |
3.93% |
|
Sensitivity |
93.85% |
95.43% |
|
Specificity |
94.56% |
97.12% |
|
Precision |
92.85% |
95.78% |
|
False Positive Rate |
5.15% |
4.22% |
|
F1-Score |
93.33% |
96.16% |
Moreover, the LDA based TF IDF approach has better performance in terms of false positive rate and F SCORE (the lower false positive rate (4.22% vs 5.15%) and higher F SCORE (96.16% vs 93.33%)) overall. This shows that including LDA based topic model in text classification is effective to enhance the accuracy and robustness in text classification.
Table 3. Comparative analysis of the proposed model with existing sentiment classification approaches
|
Method |
Dataset Used |
Accuracy |
Precision |
Recall |
F-Score |
|
Li et al., [31] |
Dianping.com Dataset |
-- |
85.51% |
93.77% |
89.45% |
|
Zuheros et al., [32] |
TripR-2020 Dataset |
80.12% |
-- |
-- |
78.31% |
|
Patil et al., [33] |
Kaggle Dataset with SVM |
78% |
89% |
65% |
-- |
|
Kaggle Dataset with Naïve Bayes |
78% |
89% |
65% |
-- |
|
|
Kaggle Dataset with Logistic Regression |
69% |
75% |
59% |
-- |
|
|
Proposed approach using LDA-based TF-IDF |
Kaggle Dataset |
96.07% |
95.78% |
97.12% |
96.16% |
Table 3 shows, the proposed LDA based TF-IDF along with the XGBoost classifier is superior to previous research works in sentiment analysis. The corpus-based baseline includes traditional TF-IDF with conventional classifiers such as SVM and Naïve Bayes. According to Li et al. [31], they obtain an F-Score of 89.45% on the Dianping.com dataset and, according to Zuheros et al. [32], 80.12% in terms of accuracy and 78.31% of F-Score on TripR-2020 dataset. Kaggle dataset was used by Patil et al. [33] who reported 78% accuracy for both SVM and Naïve Bayes and 69% for Logistic Regression. On the other hand, our proposed approach, however, obtained an accuracy of 96.07%, precision of 95.78%, recall of 97.12%, and F-Score of 96.16%, which is quite remarkable, especially as this came using the same Kaggle dataset as before.
5. Conclusions
In this paper, the subject of sentiment analysis in restaurant reviews is discussed with the use of LDA-based topic modelling with TF-IDF vectorization and XGBoost classifier. The integrated method performs much better than traditional corpus-based methods for sentiment analysis. The proposed method incorporates topic modeling to refine the representation of text and makes use of the robust classification ability of XGBoost and results in significant improvement in accuracy, sensitivity, specificity and F1 score, indicating that it effectively deals with complex and high dimensional data. Using unigrams, bigrams, and trigrams, beyond their significance in the sentiment analysis, we can see linguistic patterns that fuel the sentiment, and hence gain a deeper understanding of the customer feedback. Finally, the comparative performance metrics show that the LDA based TF IDF approach along with the XGBoost method supersede any other expected methodology to perform sentiment analysis. Further work can leverage these findings to investigate ensemble of learning techniques and apply this approach to other domains to augment the adaptability and scalability of sentiment analyses across different domains (i.e. other industries). The model can be applied in automated review monitoring and business intelligence systems. Future work may address sarcasm detection, multilingual datasets, and bias mitigation.
Author Contributions Statement
Vijay Gupta – Conceptualization, Dataset preprocessing, Visualization, and Statistical Analysis, Methodology, Model
Training, Writing.
Punam Rattan – Drafted the initial manuscript, Formal Analysis, Validation, and Performance Evaluation.
Mukesh Kumar – Model Training, Validation, and Performance Evaluation.
All authors have read and agreed to the published version of the manuscript.
Conflict of Interest Statement
The authors declare no conflicts of interest.
Funding Declaration
This research received no external funding.
Data Availability Statement
The data used in this study are publicly available. The datasets and results supporting the findings of this research can be accessed at “”, accessed on “15/04/2025.”
Ethical Declarations
This study utilized publicly available data and did not involve direct human participants or animals. Therefore, ethical approval and informed consent were not required.
Acknowledgments
The authors sincerely thank the experts and reviewers for their professional evaluation and valuable suggestions, which significantly improved the quality and reliability of this research.
Declaration of Generative AI in Scholarly Writing
During the preparation of this manuscript, the authors used generative AI tools to assist with language refinement, grammar checking, and structural improvements. The authors reviewed and edited all AI-generated content and take full responsibility for the accuracy, integrity, and originality of the manuscript.
Abbreviations
The following abbreviations are used in this manuscript:
CD - Category Detection
TTE - Target Term Extraction
LDA - Latent Dirichlet Allocation
CGC - Consumer-Generated Content
CMLA - Coupled Multi-Layer Attentions
SSCL - Self-Supervised Contrastive Learning
LICD - Language Independent Category Detection
TF-IDF - Term Frequency Inverse Document frequency
HAST - History Attention and Selective Transformation
