Intelligent Autoencoder with LSTM based Intrusion Detection and Recommender System

Author: V. G. Aishvarya Shree, M. Thangaraj, "Intelligent Autoencoder with LSTM based Intrusion Detection and Recommender System
Journal: International Journal of Computer Network and Information Security @ijcnis
Article in issue: 5 vol.17, 2025.
Free access
With the swift growth of digital networks and information in both public and private sectors, it is essential to deal with the considerable threat that network attacks pose to data integrity and confidentiality. Consequently, there is a pressing requirement for the establishment of effective mechanisms to detect and provide recommendations for addressing intrusion attacks. In this paper, we propose a semantic-based intrusion detection system that aims to improve performance by incorporating semantic representations consisting of feature groups and their associated weights, leading to the creation of a weighted knowledge graph. The weights of the features are determined using sparse autoencoders. From these weights, the most significant features are normalized to a specific range. This approach comprises a combination of a Deep Auto Encoder (AE) and Long Short-Term Memory (LSTM) networks for intrusion detection. Furthermore, the ensemble method of Extreme Gradient Boosting (XGBoost) is used to identify and recommend high-probability attack scenarios. The dataset used to evaluate is the CSE-CIC-IDS dataset. Performance metrics such as accuracy, precision, recall, false positive rate, receiver operating characteristic metrics, loss, and error rate are used to measure the performance, and the results show the approach demonstrates substantial improvements in detection accuracy, minimizing false positives, enhancing reliability, and outperforming existing models. The combination of semantic knowledge, deep learning, and ensemble learning ensures a proactive and adaptive cybersecurity framework.
Deep Learning, Intrusion Detection, Auto Encoder, Ensemble Technique, Knowledge Graph
Short address: https://sciup.org/15019996
IDR: 15019996 | DOI: 10.5815/ijcnis.2025.05.04
Text of the scientific article Intelligent Autoencoder with LSTM based Intrusion Detection and Recommender System
In the present digital age, network security has evolved into an absolute necessity, driven by a multitude of compelling factors. These factors encompass the vital tasks of safeguarding sensitive data, countering cyber threats, and fortifying the resilience of critical infrastructure. Undoubtedly, Intrusion Detection System (IDS) stands as an indispensable element within the realm of modern cybersecurity. It operates as a comprehensive security management system, assuming a pivotal role in the protection of both computers and networks. Through the meticulous collection and analysis of data gleaned from these systems, an IDS diligently scrutinizes for any indications of abnormal or potentially malicious activities. IDS manifests in two primary forms: network-based and host-based. The network-based IDS are chiefly concerned with monitoring network traffic, scrutinizing it for recognizable patterns and signatures associated with known cyber-attacks or deviations from the established norms of network behavior. Conversely, the host-based IDS focuses its attention on individual devices or hosts, meticulously examining system logs and tracking changes in files to identify any irregularities or anomalies. The seamless integration of network security measures, coupled with the deployment of intrusion detection systems, reflects the current landscape of digital security. In this era of digital dominance, where reliance on interconnected systems is omnipresent, ensuring the protection of sensitive data, resilience against continually evolving cyber threats, and the fortification of critical infrastructure are not mere optional strategies; they are indisputable imperatives.
Traditional signature-based systems are increasingly inadequate for novel attack strategies. It was reported in recent studies that deep learning architectures like convolutional neural networks and recurrent neural networks are capable of extracting complex features from vast datasets and achieving superior levels of detection accuracy [1]. Despite the promising performance of many existing intrusion detection frameworks based on deep learning and machine techniques, there are challenges to address the seamless integration of network security measures [2]. The high false positive rate is a constant limitation for many state-of-the-art deep learning approaches apart from diminished detection rates and difficulties in generalizing to heterogeneous real-world environments, all compounded by data imbalance and privacy concerns [3]. Enhancing detection accuracy while minimizing false positives contributes to advancements in intrusion detection research, fostering the development of more reliable and interpretable security solutions for real-world applications [4]. However, frameworks face significant challenges, including high false-positive rates, limited generalizability, data imbalance, and privacy concerns. Emerging hybrid models, especially those that incorporate semantic knowledge through knowledge graphs, offer a promising pathway to address these current limitations [5].
Motivated by these challenges, our work proposes a novel semantic-based IDRS framework that integrates deep learning with knowledge graph techniques to overcome current limitations. Our work proposes a novel framework that integrates deep learning with knowledge graph techniques to overcome current limitations. Specifically, our approach employs a deep autoencoder combined with long short-term memory (AE-LSTM) to detect anomalies, improve detection capability, and reduce false alarms. A key innovation of this framework is constructing a weighted knowledge graph using sparse autoencoders, which computes feature importance across grouped features to enrich the detection process with a domain-specific semantic context. To further enhance the system's performance, we incorporate an ensemble method based on Extreme Gradient Boosting (XGBoost) to conduct recommend high probability attack for proactive threat mitigation. The proposed framework is not just a theoretical concept but a practical solution that has been rigorously evaluated using diverse performance metrics on real-world datasets, ensuring its robustness and practical applicability.
The main contribution of the current proposed model is
• This model combines anomaly detection with semantic knowledge to recommend high-probability attacks.
• Semantic Knowledge Graph includes feature groups and their associated weights.
• Anomaly detection involves the use of both autoencoders and LSTM.
• Various techniques, including Synthetic Minority Over-sampling Technique (SMOTE) and Early Stopping, are incorporated into the model.
• To recommend high-probability attacks, ensemble methods such as Extreme Gradient Boosting (XG Boosting) are employed.
• Another noteworthy contribution of this model is the assessment of its performance using diverse metrics, which ensures its robustness.
2. Background
Section 2 deals with literatures review and identifying the research gaps, Section 3 has a proposed framework with algorithm. In Section 4 the performance analysis with result is presented and Section 5 is a conclusion.
A neural network, a foundational component of deep learning, draws inspiration from the structure and function of biological neural networks in the human brain. It serves as a fundamental building block for a wide array of tasks related to traditional techniques, which include but are not specific to image and speech recognition and natural language processing. In one instance the FireFly Optimization (FFO) technique was harnessed within this neural network for intrusion detection [6]. Accompanied by the Probabilistic Neural Network, this amalgamation achieved an impressive accuracy rate of 98.99%. Similarly, another framework, identified by the researcher [7], fuses ensemble methods with neural networks. Specifically, it incorporates LSTM, Gated Recurrent Unit (GRU), and Simple RNN components. In experiments conducted on the NSL-KDD dataset, the XGBoost-LSTM configuration emerged as the top performer, boasting a test accuracy (TAC) of 88.13%, a validation accuracy (VAC) of 99.49%, and a training time of 225.46 seconds. When applied to the UNSW-NB15 dataset, the XGBoost-Simple-RNN model demonstrated superior efficiency with a TAC of 87.07%.
In a multi-class classification scenario, focusing on the NSL-KDD dataset, the XGBoost-LSTM configuration achieved a TAC of 86.93%. Simultaneously, the XGBoost-GRU model delivered a TAC of 78.40% for the UNSW-NB15 dataset. Another tab transformer model, which outperformed the existing machine learning models by its potential to handle continuous data, achieves 98.35% in binary classification and 98.35% in multi classification [8]. In a similar fashion the researcher [9] adopted a machine learning based predictive model with the recent IoTID20 dataset. Other than the deep feature engineering process that is done to enhance the efficiency of the models, includes shallow neural networks (SNN), decision trees (DT), bagging trees (BT), k-nearest neighbor (kNN), and support vector machine (SVM) which results accuracy ranges from 99.4% to 99.9%. Benaddi et al. [10] presented a model, to boost the robustness of IDS system using Distributional Reinforcement Learning (DRL) and the Generative Adversarial Network (GAN), is tested with the Distributed Smart Space Orchestration System (DS2OS) dataset. The performance was evaluated, which results accuracy of DRL - 98.85% and DRL-GAN 99.05% models.
In a recent research work a standard Bot-IoT dataset is undergoes preprocessing, feature selection, and finally the classification is done with three novel models CNN, LSTM, and GRU and among these LSTM outperforms with an accuracy of 99.8%, while the CNN and GRU achieves 99.7% and 99.6% [11].
Backdoor computing scenario involves authorized and unauthorized users being able to utilize the system, and network without normal security employs the NSL-KDD dataset, using AlertNet as the primary model for backdoor attacks [12]. Decision tree based attacks are constructed using the independent features, which enhances the success rate of the attack the validation of the anomaly regions using KL-divergence, one class SVM, and manual inspection. The Ayantayo et al. [13] developed a feature fusion model using the UNSW-NB15 and NSL-KDD datasets which addressed the challenges in multiclass classification. Also, late fusion and late ensemble model showed better generalization than early fusion. The overall model achieved an accuracy of 77.84% in the UNSW-NB15 dataset and 86.81% in the NSL-KDD dataset [13].
Variant Gated Recurrent Units (GRU) include an Encoded Gated Recurrent Unit (E-GRU) and an Encoded Binarized Gated Recurrent Unit (E-BinGRU) cutting-edge in IDS. Variant GRU automatically learns network packet payload and header features, which improves the detection rate. Experimentation involves ISCX2012 dataset results with accuracy rates of E-GRU and E-BinGRU are up to 99.9% and 99.7%, respectively, and the detection rates of E-GRU and E-BinGRU are up to 99.9% and 99.8%, respectively [14]. Abusitta et al. [15] proposed a framework, which relies on a denoising autoencoder, excels at efficiently extracting features capable of withstanding the diverse environments and noise commonly encountered in IoT systems. It achieves an accuracy rate of 94.9%. Additionally, when combined with neural networks, it exhibits remarkable efficiency in defending against adversarial attacks. Alzughaibi and El Khediri [16] introduced two models, multi-layer perceptron (MLP) with backpropagation and MLP with particle swarm optimization (PSO) to deal with binary and multi-classification achieved 98.97% and 98.41%. Similarly, this model employs Spark MLlib's for anomaly detection and utilizes a state-of-the-art convolutional autoencoder technique for the detection of misuse attacks. It has been tested on the publicly available CSE-CIC-IDS 2018 dataset, using various metrics to evaluate its performance. The model achieved a detection rate of 98.20% [17].
Hamdi [20] introduced a federated-based Intrusion Detection System (IDS) featuring client-side evaluation involving seven clients. To maintain model stability, performance metrics are calculated locally, utilizing an aggregation function that consolidates results on the server, thereby achieving high detection accuracy.
Atefinia and Ahmadi [21] developed a multi-architectural modular deep neural network designed to minimize the occurrence of false positives. This model had four distinct modules, alongside an aggregator module that integrated all four inputs using an averaging technique to generate an output. Seth et al. [22] introduced the ensemble framework, integrating the detection abilities of multiple classifiers which improved detection accuracy of 96.97%, and a recall rate 97.4%. Similarly, another hybrid model is a bidirectional recurrent neural network and LSTM used a public dataset CICIDS2017, which results in 99.31% prediction accuracy [23].
Hao et al. [24] implemented the application of advanced statistical models in understanding and mitigating cyber threats using Markov decision processes. The researcher Liu et al. [25] introduced a probabilistic modeling framework that utilizes continuous-time Markov chains and semi-Markov processes to assess the occurrence probability of security risks in systems subjected to sequential cyber-attacks.
Early intrusion detection implementations primarily relied on rule-based and statistical methods, which, although computationally efficient, were limited by their dependence on predefined signatures and inability to detect novel, unknown attacks. Since signature-based detection can look only for existing threats, systems protected this way tend to be susceptible to new ones, including zero-day attacks now[26, 27]. The static nature of rule-based systems and simplistic assumptions underlying many statistical models do not adequately capture the complexity of current network behaviors [28]. As network environments have grown more complex—with the advent of the Internet of Things and increasing interconnectivity—these conventional approaches have become increasingly inadequate in modern network environments characterized by high data volume, heterogeneity, and sophisticated, rapidly evolving attack strategies [29].
A cybersecurity-focused knowledge graph has been built using the Collaborative Semantic Entity Alignment (CSEA) approach, which employs ensemble learning and adversarial training techniques [32]. This knowledge graph effectively incorporates the interconnections between entities while also differentiating entities based on angular information. It is derived from the CVE, CWE, and CAPEC databases, providing a comprehensive depiction of the cybersecurity domain.
Shen et al. [33] introduced the model, a deep residual convolutional neural network, in conjunction with an attention mechanism, effectively mitigates noise while simultaneously extracting semantic features from the sentences. As a result, this model attains the highest accuracy in relation extraction. Liu et al. [34] demonstrates the construction of cyber security knowledge graph, and the attack chain optimization-pruning technique put forward therein enhances the accuracy and efficiency of attack chain mining.
Kiesling et al. [35] introduced the SEPSES knowledge graph, which consolidates critical information on real-world vulnerabilities, weaknesses, and attack patterns from various public sources, providing a comprehensive resource for enhancing cybersecurity measures. Kurniawan et al. [36] illustrated that KG-based frameworks can unify heterogeneous data sources, providing a tactical foundation for anomaly detection and strategic incident responses. Recent advancements in intrusion detection systems (IDSs) have highlighted the pivotal role of knowledge graphs (KGs) to capture contextual information and interrelationships among network features. The researcher Sikos [37] provides a comprehensive overview of how KGs can process vast amounts of complex cybersecurity data from diverse sources, thereby assisting security analysts in obtaining cyber threat intelligence and achieving high levels of cyber-situational awareness. Recent innovations, such as advanced graph convolutional networks and semantic-enhanced KG completion methods, are beginning to address these issues by enabling better feature propagation and richer contextual representations [38].
3. Proposed System
The proposed framework, Intrusion Detection and Recommender System (IDRS), is depicted in Fig. 1. This framework comprises three layers, each with distinct responsibilities. The three layers are the data layer, the semantic layer, and the recommendation layer. The data layer is focused on preprocessing the dataset. The semantic layer generates a weighted knowledge graph that involves domain grouping and the computation of feature importance. Finally, the recommendation layer encompasses crucial tasks such as feature engineering, intrusion detection, and recommending high-probability attacks.
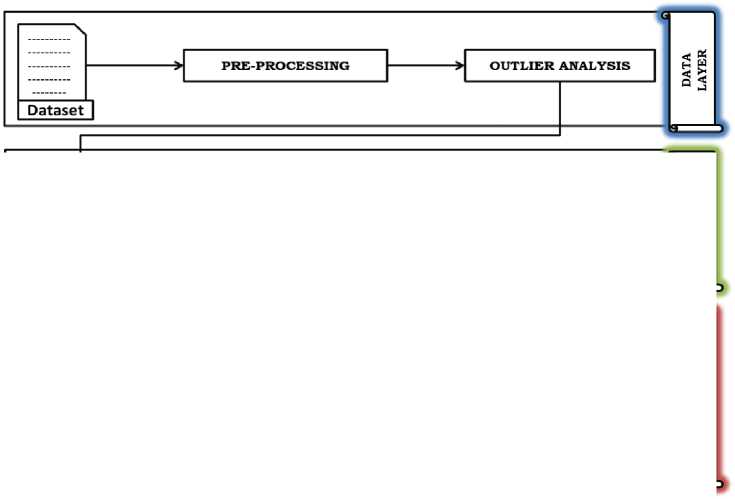
Fig.1. Intrusion detection and recommender system (IDRS) framework
-
3.1. Data Layer
The proposed framework utilizes the standard dataset for experimentation, which includes data related to network traffic and system logs for each machine, along with 80 features extracted from the captured traffic using CICFlowMeter [39]. The dataset is real-world and known for its deep-rooted challenges, which include errors, missing features, and outliers. Data preprocessing plays a big role in dealing with these challenges.
Pre-processing
Most real-time datasets contain noisy, missing, or garbage data. These datasets must be preprocessed to build reliable intrusion detection and recommendation analysis. Data processing plays a significant role in addressing these challenges. The following pre-processing steps were required to eliminate unwanted data.
Handling missing values
Identifying and dealing effectively with missing values ensures that the data analysis and models operate optimally.
It involves eradicating NaN and infinity values using drop (), which interrupts the analysis and computations.
Label encoding
Label encoding signifies categorical variables as numerical values, rendering them more useful in computations and calculations. Typically, every type of attack is assigned a unique value. For instance, benign is encoded as 0, and the attack's encoded values are listed in Table 1.
Outlier Analysis
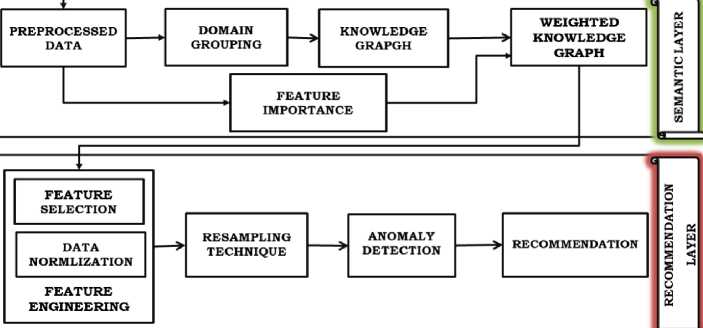
Outlier analysis is an important step to identify weird and unexpected data within the dataset. In summary, these data preprocessing steps are extremely important to make sure that the dataset is clean, well-structured, and good for later analysis or modeling tasks. Fig. 2 shows the class distribution of various labels.
Table 1. Break down of the normal and intrusion
|
Attack Label |
Encoded as |
No. of Observation |
|
Benign |
0 |
663808 |
|
FTP – Brute Force |
1 |
193354 |
|
SSH Brute Force |
2 |
187589 |
|
Dos attacks Golden Eye |
3 |
41508 |
|
Dos attacks slowloris |
4 |
10990 |
|
Dos Attack Hulk |
5 |
461912 |
|
DDos Attacks HOIC |
6 |
686012 |
|
Bot |
7 |
286191 |
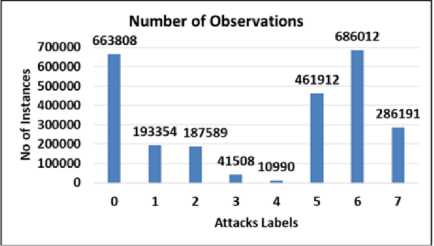
Fig.2. Class distribution
-
3.2. Semantic Layer
The semantic layer comprises two main components: domain grouping and feature importance. These steps promote a deeper understanding of the features and allow for the analysis of their weights, which is crucial to the intrusion detection process.
Domain Grouping
A semantic knowledge graph is a graph-based data representation that consists of entities represented as nodes, and the relationship between these entities is identified as an edge. A knowledge graph is a simple and intuitive way of representing nodes and edges that allows for well-informed decision-making by understanding the interrelationship between features. The knowledge graph in intrusion detection is often dynamic and must be updated in real-time scenarios. In this scenario, NetworkX was employed to represent the features as a graph with relationships and context. In this proposed system, the dataset consists of 80 features that undergo domain grouping based on different aspects of network behavior. It is categorized under 18 different groups to organize the related features together listed in Table 2. After the establishment of groupings, which enables better domain understanding it helps to identify which group has the most influential feature can be depicted as a knowledge graph in Fig. 3. The interactive visualization graph was created using Pyvis, a Python library that allows interactive functions such as tooltip, hover, and zoom for better readability and understanding. The source of the interactive feature graph is:
Weighted Knowledge Graph
Sparse autoencoders are designed to acquire a compressed representation of input data (encoding) in the bottleneck layer, which is a hidden layer with four units, as shown in Fig. 4. Subsequently, they aimed to decode the initial input data based on its representation (decoding). It shows a fully connected network. The input layer consists of a full feature as an input, along with the hidden layers of a sparse autoencoder. The layers represent the weights connecting one layer to the next layer. During training, lasso regularization was added to every dense layer to enforce sparsity in the weights, which enabled a more generalizable model that was less prone to overfitting. The model was then trained using the Adam optimizer and mean squared error (MSE) as a loss function. Using a batch size of 32, the model trained the autoencoder to reconstruct the input data over 100 epochs.
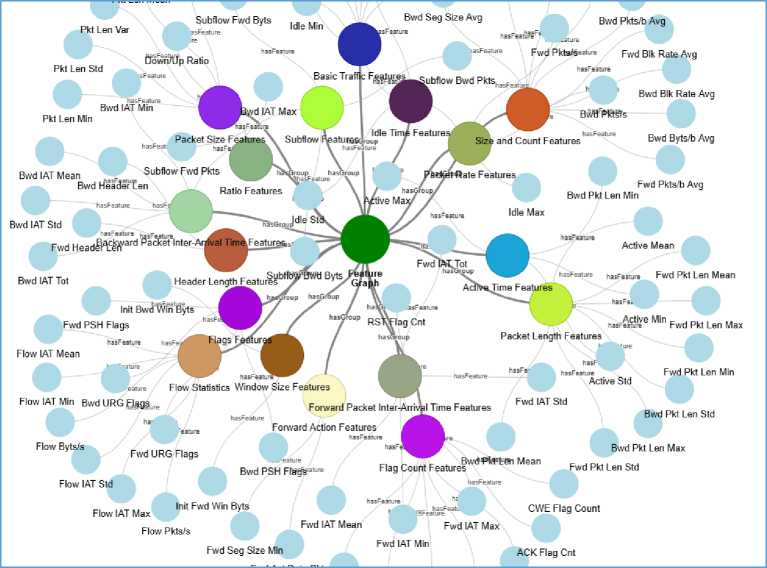
Fig.3. Feature groups
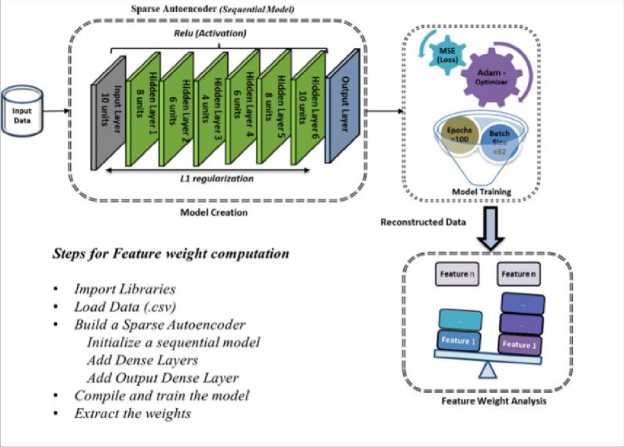
Fig.4. Structure of sparse autoencoders
The weights associated with the feature in Fig. 5 are calculated using the final phase of the layer in the sparse autoencoder. These weights represent the learned parameters, which hold significant importance in the prediction process in Table 3. In these circumstances, a knowledge graph is a visual representation where groups of related features are depicted as nodes. Analyzing the nodes of the graph along with the weights enables us to identify the most influential features within the group that has the highest weight.
Table 2. Domain grouping
|
Feature Group |
Features |
|
Basic Traffic Features |
{Dst Port, Protocol, Tot Fwd Pkts, Tot Bwd Pkts, TotLen Fwd Pkts, TotLen Bwd Pkts} |
|
Packet Length Features |
{Fwd Pkt Len Mean, Fwd Pkt Len Std Bwd Pkt Len Min, Bwd Pkt Len Mean, Bwd Pkt Len Std, , Bwd Pkt Len Max, Fwd Pkt Len Max, Fwd Pkt Len Min} |
|
Flow Statistics |
{Flow Byts/s, Flow Pkts/s, Flow IAT Mean, Flow IAT Std, Flow IAT Max, Flow IAT Min} |
|
Forward Packet Inter-Arrival Time Features |
{Fwd IAT Tot, Fwd IAT Mean, Fwd IAT Std, Fwd IAT Max, Fwd IAT Min} |
|
Backward Packet InterArrival Time Features |
{Bwd IAT Tot, Bwd IAT Mean, Bwd IAT Std, Bwd IAT Max, Bwd IAT Min} |
|
Flags Features |
{Fwd PSH Flags, Bwd PSH Flags, Fwd URG Flags, Bwd URG Flags} |
|
Header Length Features |
{Fwd Header Len, Bwd Header Len} |
|
Packet Rate Features |
{Fwd Pkts/s, Bwd Pkts/s} |
|
Packet Size Features |
{Pkt Len Min, Pkt Len Max, Pkt Len Mean, Pkt Len Std, Pkt Len Var} |
|
Flag Count Features |
{FIN Flag Cnt, SYN Flag Cnt, RST Flag Cnt, PSH Flag Cnt, ACK Flag Cnt, URG Flag Cnt, CWE Flag Count, ECE Flag Cnt} |
|
Ratio Features |
{Down/Up Ratio} |
|
Size and Count Features |
{Pkt Size Avg, Fwd Seg Size Avg, Bwd Seg Size Avg, Fwd Byts/b Avg, Fwd Pkts/b Avg, Fwd Blk Rate Avg, Bwd Byts/b Avg, Bwd Pkts/b Avg, Bwd Blk Rate Avg} |
|
Subflow Features |
{Subflow Fwd Pkts, Subflow Fwd Byts, Subflow Bwd Pkts, Subflow Bwd Byts} |
|
Window Size Features |
{Init Fwd Win Byts, Init Bwd Win Byts} |
|
Forward Action Features |
{Fwd Act Data Pkts, Fwd Seg Size Min} |
|
Active Time Features |
{Active Mean, Active Std, Active Max, Active Min} |
|
Idle Time Features |
{Idle Mean, Idle Std, Idle Max, Idle Min} |
|
Label |
{Label} |
Table 3. Feature computation
|
Fwd IAT Tot |
100 |
Fwd IAT Mean |
67.05 |
|
Bwd IAT Tot |
86.77 |
Bwd Seg Size Avg |
66.44 |
|
Subflow Bwd Byts |
83.13 |
Flow IAT Max |
65.43 |
|
Flow Pkts/s |
73.92 |
Fwd Pkts/b Avg |
64.49 |
|
Idle Max |
73.87 |
Bwd Pkt Len Max |
64.29 |
|
Flow IAT Min |
73.35 |
PSH Flag Cnt |
63.88 |
|
Fwd Pkt Len Max |
72.3 |
Flow IAT Mean |
63.05 |
|
Bwd IAT Mean |
71.27 |
Bwd Pkt Len Mean |
62.95 |
|
Idle Min |
70.45 |
CWE Flag Count |
62.88 |
|
Idle Mean |
70.35 |
Bwd PSH Flags |
62.45 |
|
Flow Byts/s |
69.86 |
Fwd Header Len |
61.59 |
|
Bwd Blk Rate Avg |
68.67 |
Active Mean |
61.05 |
|
Fwd Pkt Len Mean |
67.85 |
Tot Len Fwd Pkts |
60.62 |
|
Fwd URG Flags |
60.39 |
Bwd Header Len |
54.8 |
|
Bwd Pkts/s |
60.35 |
Pkt Size Avg |
54.52 |
|
Subflow Bwd Pkts |
58.35 |
Bwd IAT Std |
54.5 |
|
Fwd IAT Std |
57.85 |
Active Min |
54.06 |
|
Subflow Fwd Byts |
57.74 |
ECE Flag Cnt |
53.99 |
|
Fwd IAT Max |
57.62 |
SYN Flag Cnt |
53.7 |
|
Label |
57.42 |
Fwd IAT Min |
51.9 |
|
Fwd PSH Flags |
57.3 |
Pkt Len Var |
51.83 |
|
Idle Std |
57.23 |
Dst Port |
51.45 |
|
Active Std |
56.93 |
Pkt Len Std |
51.39 |
|
Subflow Fwd Pkts |
56.38 |
Init Fwd Win Byts |
51.31 |
|
Flow IAT Std |
55.93 |
Fwd Pkt Len Std |
50.64 |
|
Bwd IAT Min |
54.87 |
The connections between these nodes illustrate the relationships or associations between the feature groups. Each node in the knowledge graph represents a group of features that are semantically related, along with their computed weights, resulting in a weighted knowledge graph depicted in Fig. 6. The source of the interactive weighted knowledge graph is:
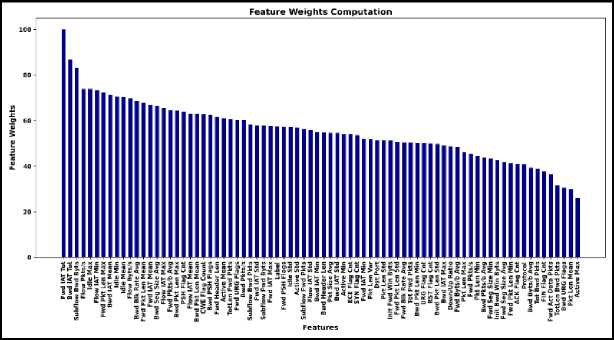
Fig.5. Feature importance
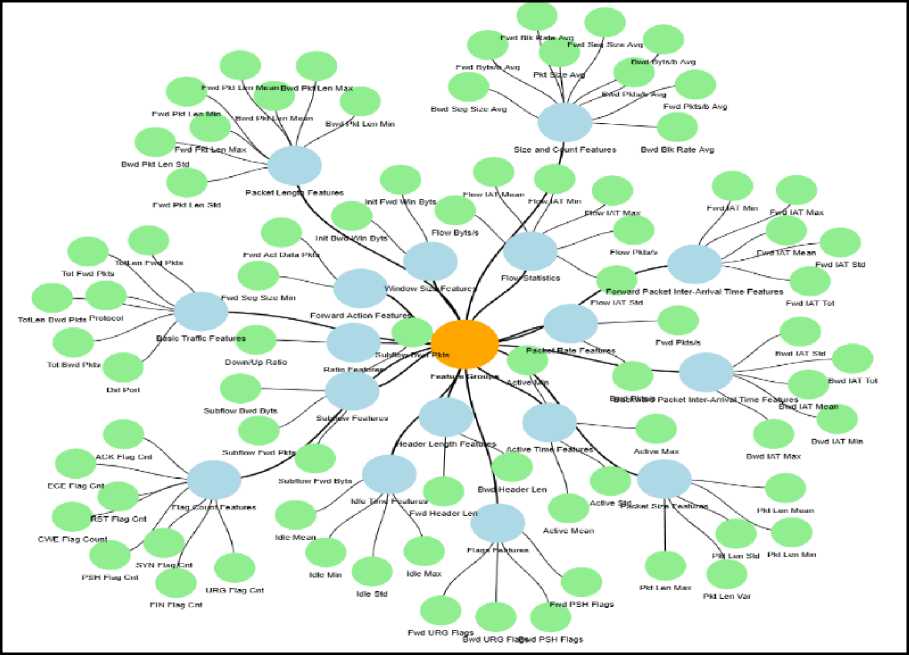
Fig.6. Weighted knowledge graph
-
3.3. Recommendation Layer
After the data layer, the weighted knowledge graph is used in the recommendation layer to identify the relevant features based on the weights and to detect anomalies and recommendation of attacks. The recommendation layer consists of four major tasks, as follows.
-
A. Feature Engineering
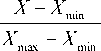
Feature engineering encompasses two critical steps: feature selection along with data normalization. Firstly, to recognize the most relevant features using computed weights, while the insignificant ones are neglected in Table 3. The cause behind feature selection is to retain only the most informative and influential features, which enhances the model's performance and reduces over fitting; also, any unnecessary noise or irrelevant information is neglected. Subsequently, data normalization is incorporated to standardize the selected features to a dependable and efficient performance using MinMax Scaler.
X normalized
-
B. Resampling Technique (SMOTE)
By adding synthetic instances to the minority class, SMOTE helps balance the class distribution, making the dataset more suitable for training the models. This can improve the model's performance, particularly when the imbalanced class distribution leads to biased predictions or poor generalization using the SMOTE function with random_state 42, ensuring reproducibility. SMOTE results in more realistic and representative synthetic samples when the features are normalized before. Volume of dataset before and after the SMOTE technique is depicted in Fig. 7. In this scenario, resampling the minority class enhances the model’s performance.
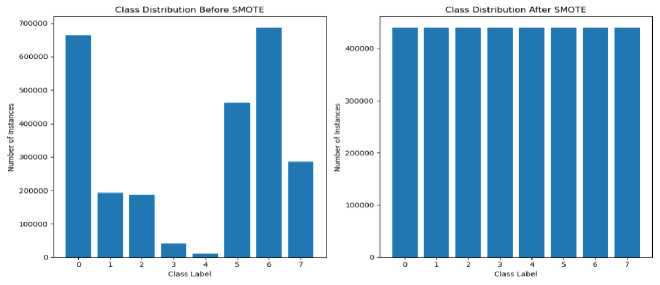
Fig.7. Class distribution before and after SMOTE
-
C. Anomaly Detection
Anomaly detection using a fusion of autoencoder and LSTM is a powerful method to identify anomalies or unusual patterns in sequential data. This approach leverages the capabilities of both autoencoders and LSTM, usage of deep autoencoder promotes dimensionality reduction, which incorporates the compressed form of input data into lowerdimensional representation and reconstructs it. Through the learning of reconstructed data, the autoencoder learns the most salient feature of the input.
This layer defines and compiles a deep autoencoder with encoding and decoding components. It employs an optimizer (Adam) and a loss function (binary cross-entropy) to identify the error between the input and the output in the autoencoder. The training step incorporates backpropagation, wherein during each epoch, gradients of the loss in relation to the parameters of the model are calculated. The optimizer then modifies these settings in a way that minimizes the loss and the overall performance.
Table 4. Parameters and its value
|
Parameter |
Value |
|
|
0 |
Input Dimensions |
50 |
|
1 |
Hidden Dimensions 1 |
128 |
|
2 |
Hidden Dimensions 2 |
64 |
|
3 |
Hidden Dimensions 3 |
32 |
|
4 |
Encoding Dimensions |
16 |
|
5 |
Number of Epochs |
20 |
|
6 |
Batch Size |
128 |
|
7 |
Activation Functions |
Relu |
|
8 |
Loss Function (Autoencoder) |
binary_crossentropy |
|
9 |
Optimizer (Autoencoder) |
Adam |
|
10 |
Loss Function (Classifier) |
sparse_categorical_ crossentropy |
|
11 |
Optimizer (Classifier) |
Adam |
|
12 |
Cross-Validation Folds |
5 |
|
13 |
Early Stopping Patience |
3 |
Additionally, a classification part featuring an LSTM layer, an optimizer (Adam), and a sparse categorical crossentropy (loss function) is included in the classification. LSTM avoids the vanishing gradient problem when compared to other traditional methods. It processes the compressed input from the autoencoder. The output of the LSTM layer is used for classification, making it effective in detecting anomalies in time-series or sequential data with the following hyperparameter values in Table 4.
The model performance observations carefully tuned these parameters. Manual tuning offers greater flexibility than other automatic tuning techniques, leading to a model with a core specific to the dataset and research gaps. It is important to select pertinent model parameters during manual tuning, such as the neural network batch size, activation, and loss function. For ease of understanding, we start with an initial value after selecting the parameters. For instance, the model experiences underfitting during training, which can be fixed by reducing regularization or adding hidden layers or neurons to boost the model’s capacity.
On the other hand, to improve the training performance when the model experiences overfitting, either regularization is increased or the number of neurons is decreased. Until the model’s performance is improved, these tuning procedures are repeated while monitoring the results. Cross-validation ensures that the model works effectively with various subsets of data once the optimal set of hyperparameters has been determined.
The combined autoencoder and LSTM model extracts meaningful features from the input and feeds it to LSTM, which makes the better detection of anomalies.
D. Recommendation
4. Performance Analysis4.1. Dataset Description
A recommender system is a commonly used tool across various real-time applications. However, one area that has not been sufficiently addressed is attack recommendation within intrusion systems. To address this gap, our model proposes an ensemble-based recommender system designed to recommend potential attacks with a high probability of occurrence in the intrusion system. For instance, the IDS model generally classifies attacks and benign data. However, this framework labels the attacks as suspicious and calculates the probability across several potential attacks (DDoS, DoS, and brute force). For example, a DDoS has a high probability when the system immediately alerts the system. For the brute force, a medium probability may initiate a secondary level of monitoring to handle the attacks.
This is part of the model that employs Extreme Gradient Boosting (XGBoost), which efficiently handles the highdimensional data from the autoencoder and LSTM part, the encoding from the autoencoder enables dimensionality, which enables the ensemble model to process and classify the data.
This phase includes various steps such as model creation, cross-validation, training, generating the prediction, mapping and filtering recommendations, and evaluating recommendations. Overall, the model incorporates crossvalidation to see how well the model generalizes to unseen data by splitting the training data into multiple folds and train the model to create a robust classifier. The next step is prediction, provides both the predicted attack types and their likelihoods, which helps in making informed decisions about the detected anomalies. Mapping enables the predicted labels in the human-readable format to focus on the actual threat. Finally, evaluate the accuracy of the recommendation and filters out the high-probability attacks.
This system aims to enhance security measures by proactively identifying and suggesting potential threats or malicious activities, thus helping organizations better protect their networks and data.
IDRS is implemented, and performance is evaluated with metrics. The system was implemented in an Anaconda environment using Python 3, and the necessary libraries were compatible with both the Python version and the Ubuntu 22.04 operating system. The system operated on a PowerEdge R750 server with a 128GB RAM capacity.
The dataset utilized in this experimentation is a significant collection of real-time data related to network traffic specifically designed for cybersecurity research and assessing the intrusion detection systems. It was developed by the Canadian Institute for Cybersecurity (CIC) as part of their ongoing commitment to support cybersecurity research.
This dataset is substantial in size, as in Table 1, containing a vast number of network flow records, which makes it highly suitable for conducting comprehensive research. It encompasses a wide spectrum of network activities and potential attack scenarios, providing researchers with the opportunity to assess the resilience and effectiveness of their intrusion detection models. Notably, it includes both benign (normal) network traffic and distinct malicious traffic, such as Distributed Denial of Service (DDoS) attacks, brute-force attacks and more.
Moreover, the dataset comprises the captured network traffic data and system logs from each machine, complemented by 80 features extracted from the captured traffic using CICFlowMeter-V3. This rich set of data enables researchers to explore innovative techniques aimed at addressing the intricate challenges posed by cybersecurity. In summary, the dataset is a valuable resource for cybersecurity research, offering a diverse and comprehensive collection of data to lift the development and evaluation of IDS and to tackle complex cybersecurity issues.
-
4.2. Implementation with Results
To assess the performance by comparing IDRS with the existing models such as MLP-BP, FFO-PNN, Conv-AE, BWO-CONV-LSTM and Federated IDS are used. The model has been assessed using seven metrics such as accuracy, precision, recall, F1 score, false discovery rate, AUC, and reconstruction error. To gauge the usefulness of the intended intrusion detection system, Table 5 provides a comparison with other systems.
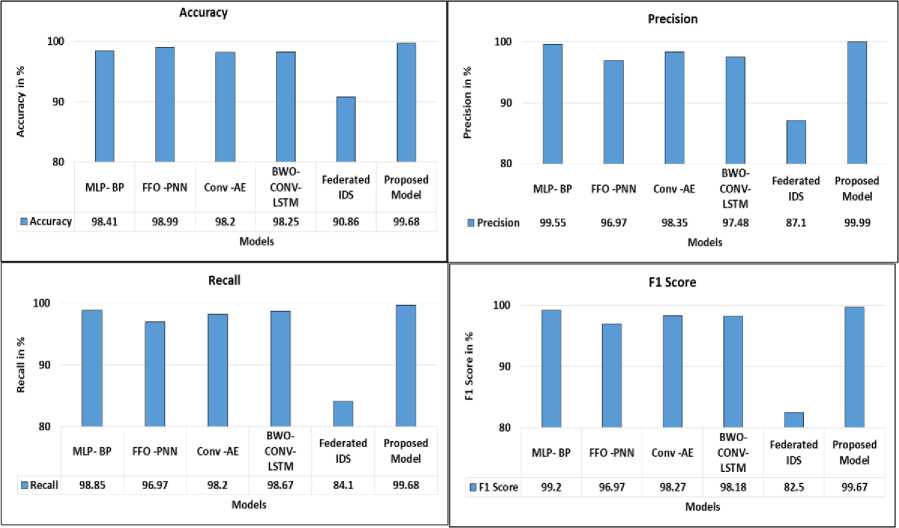
Fig.8(a). Model performance
Table 5 . Comparative analysis
|
Model |
Approach |
Dataset |
Accuracy |
Recall |
Precision |
F1 Score |
|
[16] |
MLP- BP |
CIC IDS 2018 |
98.41 |
98.85 |
99.55 |
99.20 |
|
[6] |
FFO –PNN |
KDD-CUP 99 |
98.99 |
96.97 |
96.97 |
96.97 |
|
[17] |
Conv-AE |
CIC IDS 2018 |
98.20 |
98.20 |
98.35 |
98.27 |
|
[18] |
BWO-CONV-LSTM |
CIC IDS 2018 |
98.25 |
98.67 |
97.48 |
98.18 |
|
[20] |
Federated IDS |
CIC IDS 2018 |
90.86 |
84.1 |
87.1 |
82.5 |
|
Proposed System |
AE-LSTM |
CIC IDS 2018 |
99.68 |
99.68 |
99.99 |
99.67 |
Performance Metrics
Experiment: I Accuracy, Recall, Precision and F1- score
The overall average of Precision, Recall, F1- score and Accuracy among MLP-BP, FFO-PNN, Conv-AE, BWO-CONV-LSTM and Federated IDS and AE-LSTM is given in Fig. 8(a) using the formulas given below.
Accuracy: It assesses the overall correctness of the model.
, True Positive + True Negative
Accuracy =-------------------------------------------------------- (1)
True Positive + True Negative + False Positive + False Negative
Recall: Recall is a measure of how many of the positive cases the classifier correctly predicted.
Recall =
True Positive
True Positive + False Negative
Precision: It is a measure of how many of the positive predictions made are correct.
True Positive Precision =----------------------------
True Positive + False Positive
F1-Score: It is a measure combining both precision and recall.
precision * recall
F 1 - Score = 2 *---------------- precision + recall
The graph shows that the AE-LSTM model used the CSE-CIC-IDS dataset for experimentation, which outperforms the subsist models in terms of accuracy – 99.68%, recall – 99.68%, precision – 99.99%, and F1 score – 99.67%.
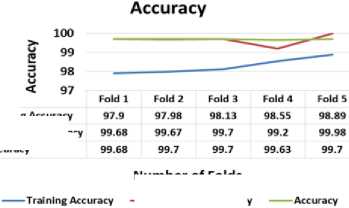
Number of Folds
----Validation Accuracy
Fig. 8(b) denotes test and validation accuracy of all the folds while test accuracy is quite stable and improves gradually.
Training Accuracy Validation Accuracy
Accuracy
Fig.8(b). Accuracy of all folds
Classification Report
The classification report is particularly useful in multi-class classification consisting of more than two classes or labels. Fig. 9 assesses how accurate the model accomplishes for each class individually and can reveal potential issues with imbalanced datasets or classes that the model struggles to predict.
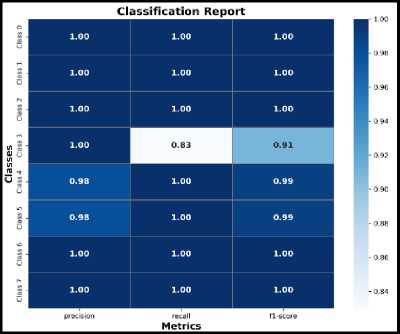
Fig.9. Classification report
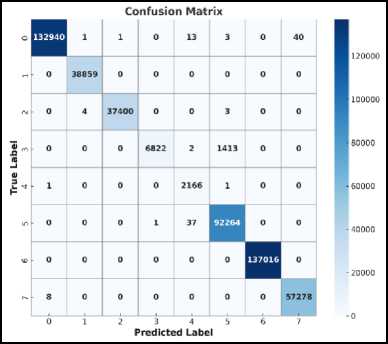
Fig.10. Confusion matrix
Confusion Matrix
A confusion matrix is particularly for evaluating the performance of classification models. Fig. 10 dispenses a detailed breakdown of a model's predictions and its outcomes, allowing you to understand how correctly the model is performing with regard to classifying data into different categories.
Experiment: II Loss
The training loss evaluates how effectively a model is tailored to the training data, while the validation loss gauges the model's capacity to apply its learnings to novel, unseen data. Both loss measures are pivotal for constructing a model that excels in real-world scenarios. The equilibrium connecting these two loss values is of utmost importance in deciding the optimal model complexity in which the loss gradually decreases, which enhances the model performance, as illustrated in Fig. 11.
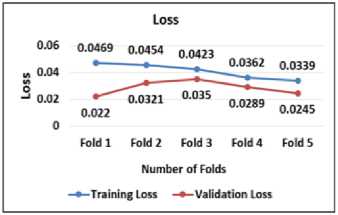
Fig.11.Training and validation loss
To mitigate the case of overfitting, we employ the practice of early stopping, which involves tracking the loss on a validation dataset. This assists in preventing the model from excessively fitting the training data. Fig. 12 illustrates the idea of early stopping with regard to cross-validation folds.
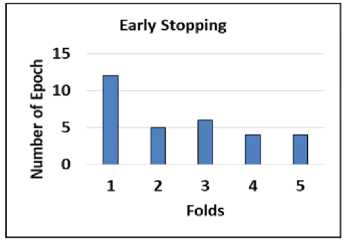
Fig.12. Early stopping
Similarly, the reconstruction error metric is specific to autoencoders and measures the error in reconstructing input data. A reconstruction error of 0.0813, depicted in Fig. 13, suggests that the autoencoder model is quite accurate in reproducing the input data.
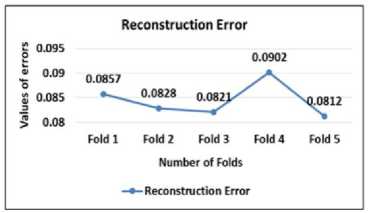
Fig.13. Reconstruction error
Table 6 and Fig. 14 illustrate the overall performance of intrusion detection, showcasing its superior performance in terms of a False Discovery Rate (FDR) of 0.0000 and a Positive Predictive Rate (PPR) of 0.9999.
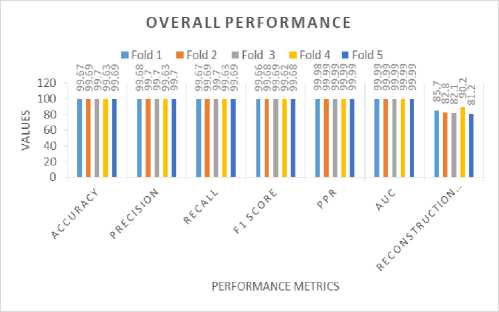
Fig.14. Overall performance
Table 6. Overall performance
|
Fold |
Epochs |
Accuracy |
Precision |
Recall |
F1 Score |
FDR |
PPR |
AUC |
Reconstruction Error |
|
1 |
12 |
0.9967 |
0.9968 |
0.9967 |
0.9966 |
0.0 |
0.9998 |
0.9999 |
0.0857 |
|
2 |
5 |
0.9969 |
0.9970 |
0.9969 |
0.9968 |
0.0 |
0.9999 |
0.9999 |
0.0828 |
|
3 |
6 |
0.9970 |
0.9970 |
0.9970 |
0.9969 |
0.0 |
0.9999 |
0.9999 |
0.0821 |
|
4 |
4 |
0.9963 |
0.9963 |
0.9963 |
0.9962 |
0.0 |
0.9999 |
0.9999 |
0.0902 |
|
5 |
4 |
0.9969 |
0.9970 |
0.9969 |
0.9968 |
0.0 |
0.9999 |
0.9999 |
0.0812 |
|
Average |
0.9968 |
0.9969 |
0.9968 |
0.9967 |
0.0 |
0.9999 |
0.9999 |
0.0813 |
|
After intrusion detection, the final process is a recommendation process that recommends the high-probability attacks by using the XGBoost ensemble method and achieves a recommendation accuracy: 0.9999. It concludes that attacks with high recommendation probability in Table 7.
Table 7. Number of probabilities
|
Label |
Count |
|
DDos Attacks HOIC |
137016 |
|
Dos Attacks Hulk |
92302 |
|
Bot |
57283 |
|
FTP Brute Force |
38863 |
|
SSH Brute Force |
37403 |
|
Golden Eye |
8238 |
|
Dos Attacks slowloris |
2169 |
-
4.3. Discussion
The findings of this study provide compelling evidence for an effective and scalable solution for cybersecurity. The proposed IDRS achieves superior detection accuracy by integrating autoencoder-LSTM for anomaly detection and XGBoost for attack recommendation while maintaining computational efficiency. The following discussion explores how these findings translate into real-world applications, supported by the empirical results from this study and the relevant literature.
One of the most salient contributions of this study was the enhanced detection capabilities demonstrated by the model. The study achieved an impressive 99.68% accuracy rate, outperforming existing IDS solutions, including MLP- BP, FFO –PNN, Conv-AE, BWO-CONV-LSTM and Federated IDS. This high accuracy was attributed to the fusion of deep learning architectures, which effectively capture complex attack patterns and improve anomaly detection rates [13]. Unlike traditional signature-based IDS models, which struggle against zero-day attacks owing to their reliance on predefined attack signatures, our IDRS model dynamically learns from new attack patterns, making it more adaptable to evolving cyber threats [40]. The low False Discovery Rate (0.0%) further validates its reliability in real-time monitoring environments by minimizing false alarms, a significant drawback of conventional IDS approaches [41, 42]. Given these performance metrics, the model is well suited for deployment in enterprise security systems, financial institutions, and cloud-based infrastructures where precise and timely intrusion detection is critical.
Scalability is another essential aspect of real-world applications. This study demonstrates that the proposed IDS can handle diverse network sizes and configurations owing to its feature selection mechanism using Sparse Autoencoders complemented by other studies [43, 44]. By reducing the dimensionality of the dataset while preserving essential features, the model optimizes computational efficiency without sacrificing detection accuracy. The ability to process over 2.5 million network flow records with high precision suggests that the system can be deployed in small-scale enterprise networks and large-scale cloud environments. Furthermore, the model’s adaptability across various attack types, including DDoS, DoS, Brute Force, and Botnet attacks, reinforces its versatility in protecting networks with dynamic security demands [10]. Given that organizations increasingly rely on scalable and automated security solutions to manage expanding cyber risks, this IDRS offers a robust alternative to conventional models that struggle with scalability and realtime responsiveness.
Despite leveraging deep learning techniques, the model maintains high computational efficiency, making it feasible for deployment in resource-constrained environments. This is achieved through early stopping mechanisms, optimized batch processing, and dimensionality reduction, collectively minimizing the processing overhead [45, 46]. The study confirmed that the system achieved a low reconstruction error (0.0813) while maintaining optimal performance across multiple cross-validation folds. IDS models are computationally expensive and not suitable for real-world implementations [47]. This ensures that deep-learning inference can be improved on a wide range of mobile and other platforms without undue resources. This makes it a relevant solution for corporate networks, cloud-based security infrastructures, and IoT environments, where clients’ computational efficiency is a major concern [23].
Several critical limitations arise in intrusion detection systems when handling data imbalance, which causes class sensitivity after SMOTE, as it raises the false positive rate and fails to address the real attack patterns. Incorporating both undersampling and oversampling is one of the effective ways to build balanced IDS to overcome class sensitivity [48, 49]. Deploying IDS in real-time presents several challenges, including latency handling, which means the system must proactively detect threats and respond to achieve low-latency early exit [50] using memristor hardware architecture; model pruning can be employed, and resource constraints include storage, GPU processing, and its ability to handle high-throughput environments. To mitigate this hybrid deployment across cloud, edge enhances system agility while using low resources [51]. Model compression is utilized to ease resource-constrained environments by applying pruning, knowledge distillation, and quantization, autoencoder-based compression without compromising the performance of the model [5254].
One of the key advantages of this model is its capacity to adjust to new cyber threats, a persistent challenge in contemporary cybersecurity systems. By incorporating XGBoost-based attack recommendation, it adds an extra layer of protection by ranking threats according to their risk levels. The research demonstrates that this ensemble method facilitates dynamic categorization of attacks, lowers misclassification rates, and enhances overall accuracy in threat detection. Unlike traditional Intrusion Detection Systems that only identify anomalies, this IDRS assesses the probability of specific attacks, providing more practical insights for cybersecurity teams. However, since the study utilized the CSE-CIC-IDS2018 dataset, the claims of adaptability are currently substantiated only for the threats present in this dataset. Future investigations should explore real-world network traffic to confirm its effectiveness against new attack vectors.
This study provides robust empirical evidence supporting the practical use of the model; however, it is important to recognize certain limitations. Firstly, the reliance on a single benchmark dataset raises questions about its applicability to real-time, evolving threats. Secondly, despite a low false-positive rate, further improvements are necessary to prevent alert fatigue from becoming a persistent problem. Moreover, while the model was evaluated in a high-performance computing setup (PowerEdge R750 with 128GB RAM), future research should assess its effectiveness in real-time operational settings with diverse computational resources also by incorporating model compression techniques. These limitations outline a path for future investigations, which should prioritize testing in live network environments, enhancing strategies to reduce false positives, and incorporating adaptive learning models for ongoing enhancement.
The results of this research confirm that the proposed IDRS is a highly effective, scalable, and precise security solution. With its impressive detection accuracy, computational efficiency, and ability to adapt to various types of attacks, the IDRS Framework represents a significant step forward in the field of cybersecurity. Nonetheless, it is crucial to conduct further validation in real-time settings and across diverse network environments to fully demonstrate its practical effectiveness. Future studies could improve the model’s relevance to next-generation cybersecurity frameworks by focusing on these areas.
5. Conclusions
The rapid expansion of data and the increasing prevalence of cyber threats underscore the critical role of cyber security. It goes beyond being just a technological concern; it is a fundamental aspect of safeguarding our digital lives, businesses, and even national security. The Internet of Things (IoT) encompasses a vast network of interconnected devices, spanning from smart thermostats and wearable gadgets to industrial sensors and autonomous vehicles. While IoT offers numerous advantages, its rapid growth has exposed vulnerabilities that can be exploited by malicious actors. Investing in cyber security measures is an imperative component of safely and responsibly navigating the digital landscape. The intrusion detection system is already widely available in many systems.
The main objective of the proposed system is to combine anomaly detection with semantic knowledge to recommend potential high-probability cyber-attacks. To conduct experiments, the CSE-CIC-IDS dataset is employed. After preprocessing, features are grouped, and its weightages are computed using a sparse autoencoder. Following feature selection and data normalization, the fusion of autoencoder and LSTM results in outstanding performance, achieving an overall accuracy of 99.68% with no false positives and minimal reconstruction errors. Additionally, the proposed model addresses over fitting by implementing early stopping, to minimize the loss backpropagation is incorporated and handles data imbalance by utilizing the SMOTE technique.
The recommender system suggests attacks with a high probability, achieving an accuracy rate of 99.99% with the use of ensemble methods. As we look ahead, it is vital to integrate this system into a real-time environment. IDS realtime deployment has multiple challenges, including latency handling, which means the system must proactively detect threats and respond to achieve low-latency early exit; model pruning can be employed, and resource constraints include storage, GPU processing, and its ability to handle high-throughput environments. Model compression using pruning and knowledge distillation is one of the feasible solutions for real-time deployment. Moreover, continuous initiatives are focused on enhancing and optimizing the outcomes. So far, we have successfully identified and recommended potential attacks. However, a potential future endeavor could involve developing methods to proactively block these intrusions.
Acknowledgment
The authors gratefully acknowledge the RUSA-Phase II (Rashtriya Uchchatar Shiksha Abiyan, Ref -016/RUSA/MKU/2020-2021), Department of Computer Science, School of Information Technology, Madurai Kamaraj University, Madurai- 625021 for their financial support in carrying out the publishing of this research work.
