Intelligent training algorithm for artificial neural network EEG classifications

Author: Hanan A. R. Akkar, Faris B. Ali Jasim
Journal: International Journal of Intelligent Systems and Applications @ijisa
Article in issue: 5 vol.10, 2018.
Free access
Artificial neural networks (ANN) have been widely used in classification. They are complicated networks due to the training algorithm used to fix their weights. To achieve better neural network performance, many evolutionary and meta-heuristic algorithms are used to optimize the network weights. The aim of this paper is to implement recently evolutionary algorithms for optimizing neural weights such as Grass Root Optimization (GRO), Artificial Bee Colony (ABC), Cuckoo Search Optimization (CSA) and Practical Swarm Optimization (PSO). This ANN was examined to classify three classes of EEG signals healthy subjects, subjects with interictal epilepsy seizure, and subjects with ictal epilepsy seizures. The above training algorithms are compared according to classification rate, training and testing mean square error, average time, and maximum iteration.
Artificial neural network, Energy distribution, EEG, GRO, ABC, CSA, PSO, evolutionary algorithms
Short address: https://sciup.org/15016487
IDR: 15016487 | DOI: 10.5815/ijisa.2018.05.04
Text of the scientific article Intelligent training algorithm for artificial neural network EEG classifications
The electroencephalogram (EEG) is a low amplitude signal generated in the brain, as a result of information flow during the communication of several neurons. Hence, careful analysis of these signals could be useful in understanding many human brain disorder diseases. One such disease topic is epileptic seizure identification, which can be identified via a classification process of the EEG signal after preprocessing [1].
Epilepsy is a major neurological diesis occurring in the brain characterized by recurrent seizures [1]. The abnormal electrical activity of brain cells caused temporary variation in brain functions which is known as epileptic seizures. Routinely EEG signal is used to diagnose epilepsy clinically [2]. EEG is an important tool used to identify and analyze human epileptic seizures activity. Traditional epileptic seizure diagnosis relies on verbose visual screening by neurologists from EEG recording. Recently, there are many automatic systems helping the neurologists to quickly find interesting segments of seizure detection [3].
Over many years for various biomedical signal analyses neural networks NN have been very widely used since they split the signals efficiently for decisionmaking. Over the years there are several other architectures of NN model that have been used such as Multilayer Perceptron Neural Network (MLPNN), Radial Basis Function (RBF), Recurrent Neural Network (RNN), etc. [4]. In addition to these methods, heuristic optimization algorithms are used to increase the speed of these methods. Particle swarm optimization (PSO) as a heuristic optimization method has been successfully applied to train ANNs. It has been proposed to update network weights because of its easy implementation and realization [5].
II. Related Works
Up to now, several techniques have been proposed on the classification of EEG signals in different literature and diverse classification accuracies have been reported in the last decade for the EEG epileptic data. Brief descriptions of the previous research are provided below.
Guler et al. [8] assessed the diagnostic accuracy of recurrent neural networks (RNNs) using Lapunov exponents trained with the Levenberg-Marquardt algorithm on the EEG epileptic database. Jahankhanni et al. [9] used a wavelet transform for feature extraction and neural networks for EEG signal classification on the EEG epileptic database. Polat et al.[10] used an approach for the classification of epileptiform EEG using a hybrid system based on a decision tree classifier and the fast Fourier Transform. Guo et al. [11] introduced relative wavelet energy and artificial neural networks for the classification of EEG signals. Chandaka et al. [12] also utilized a cross-correlation aided SVM classifier for classifying EEG signals of the healthy subjects and epileptic patients. Vahid Fathi et al.[13] have proposed a novel PSO-OSD algorithm to improve the RBF learning algorithm in real time applications for EEG classification.
III. Methods
This section explains extensively on the overall processes that were implemented for this work. It consists of EEG data collection, pre-processing and filtering, feature extraction and normalization, and finally the development of brain dieses classification model using ANN as illustrated in Figure 1.
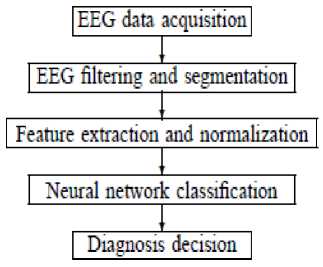
Fig.1. Proposed system block diagram
-
A. Data acquisition
-
23.6 second and 4096 sampling points. The eye movement artifacts have been manually removed by visual inspection. Set A and B are carried out from healthy subjects with open eyes and closed eyes respectively. Set C and D segments recorded within an epileptogenic zone which contains only activities measured during free interval seizure (interictal period). Set E contains only seizure activity segments (ictal period). All EEG signals were sampled at a sampling frequency of 173.6 Hz.
In our experiment, we foster the data set, which is widely adopted by previous researchers [8-10], from the University of Bonn, German [14]. It includes five sets (A – E). Each set has 100 single channel EEG segments over
In our study, EEG signals from sets A, C, and E have been used to classify the healthy, interictal seizures, and ictal seizures.
-
B. Filtering
EEG signal is usually contaminated by different noise sources. This noise needs to be removed before analyzing the signal. plenty of noise removal techniques are implemented. Brain waves are classified according to frequency as Delta (0.1 – 4 Hz), Theta (4 – 8 Hz), Alpha (8 – 12 Hz), Beta (12 – 30 HZ), and Gamma (> 30 Hz) [15]. In our study, we propose FIR bank filter to denoise the signals as shown in figure 2. Also, the FIR bank filter used to split the raw EEG data signals into the brainwaves frequency bands. The frequency bands extracted and carried out in our study are delta, theta, alpha, and beta (0.1 – 30Hz) only since EEG signals do not have any useful frequency components above 30Hz [16].
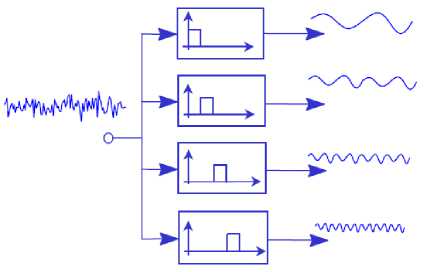
Fig.2. FIR bank filter
-
C. Feature extraction
Feature extraction is the process of transforming the input data into a set of features. In order to perform the desired task optimally, the feature set must extract the relevant information from the input data. In our study, the energy distribution for each frequency bands is used for feature extraction. According to Parseval's theorem, the energy of original signal can be partitioned at different bands or levels and mathematically can be represented as [16].
ED ij = Z 7=i lOi;l 2 (1)
Where N is the number of samples or number of volunteers, i= (1 – 5) which represent the signal frequency bands. Figures 3 illustrate the energy band of set A, set C, and set E. These signals are plotted according to feed the input sets to FIR bank filter and then calculate the energy for each frequency bands using equation (1). The filter and the energy distribution calculation is simulated and implemented using MATLAB 2013 software environment.
-
D. Classification
Multi-layer Perceptron (MLP) neural network has been implemented to classify EEG signal by many researchers [17-19]. MLP networks are the most popular feed forward supervised artificial neural networks that map set of input data to a set of appropriate output. MLP taking advantage of supervised learning technique called back propagation trains the network. Any MLP has an input layer, output layer, one or more hidden layers. Each layer or neuron inputs are connected to an output of previous layer or neurons whereas output layer neurons determine input class. Using more than one hidden layer
(processing layer) may improve the network performance but may lead to converging to local minima. Usually, one processing layer is sufficient to classify the input data [20]. Each layer consists of one or multiple neurons depending on the solving problems. Each neuron realizes a function of weighted summation and special linear or nonlinear activation function. The connection between neurons called weight. Adjusting these weights is the way to solve the problem which is identified as training or learning process. When the number of neurons in the hidden layer has been selected, the network weights must be optimized to minimize the mean square error made by the network. The fully connected MLP neural network with the input layer, output layer, and one hidden layer is illustrated in figure 4. As shown in the figure each connection line represents a weight that must be adjusted to a suitable value in order to minimize the mean square error [21].
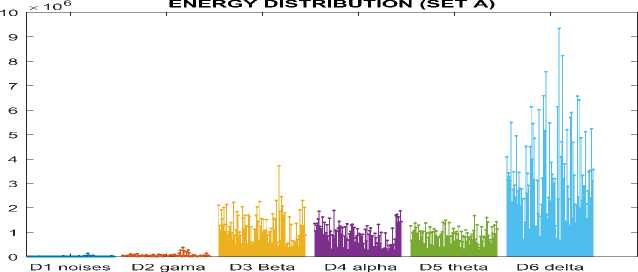
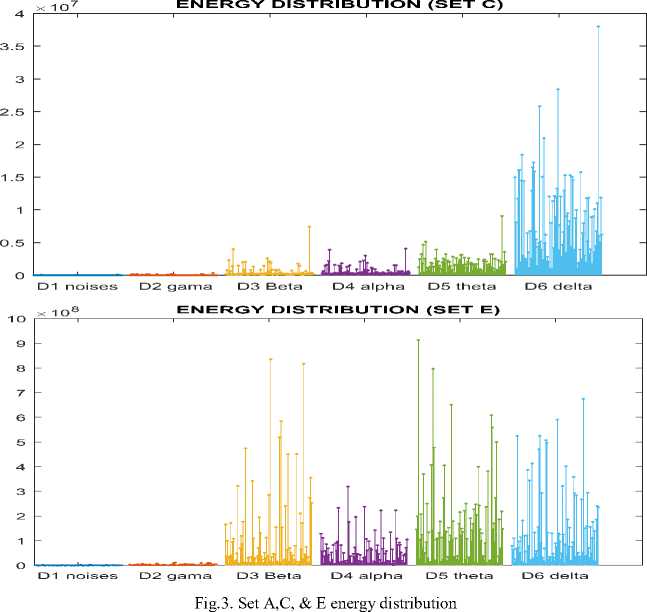
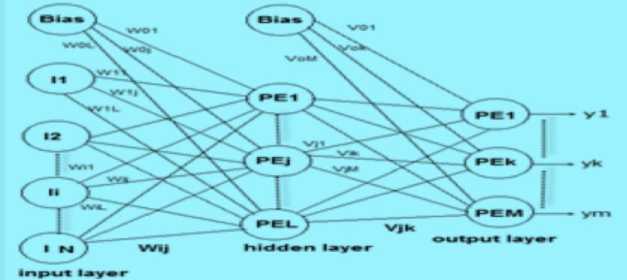
Fig.4. Fully connected single hidden layer ANN
IV. Ann Weights Optimization Algorithms
The most important issue related to neural networks is how to learn the network to give the right solution with the most optimized weights. Training of neural network is the process of adjusting the weights of the network. One of the most popular training algorithms is the Back Propagation Algorithm (BPA), this algorithm has been extensively used for the network training purpose. BPA seems to be suffering from multiple problems, such as easily fall into local minima and its low convergence speed. Many attempts have been made to improve the performance of BPA, while other just used Evolutionary Algorithms (EAs) to replace BPA in the training phase [22].
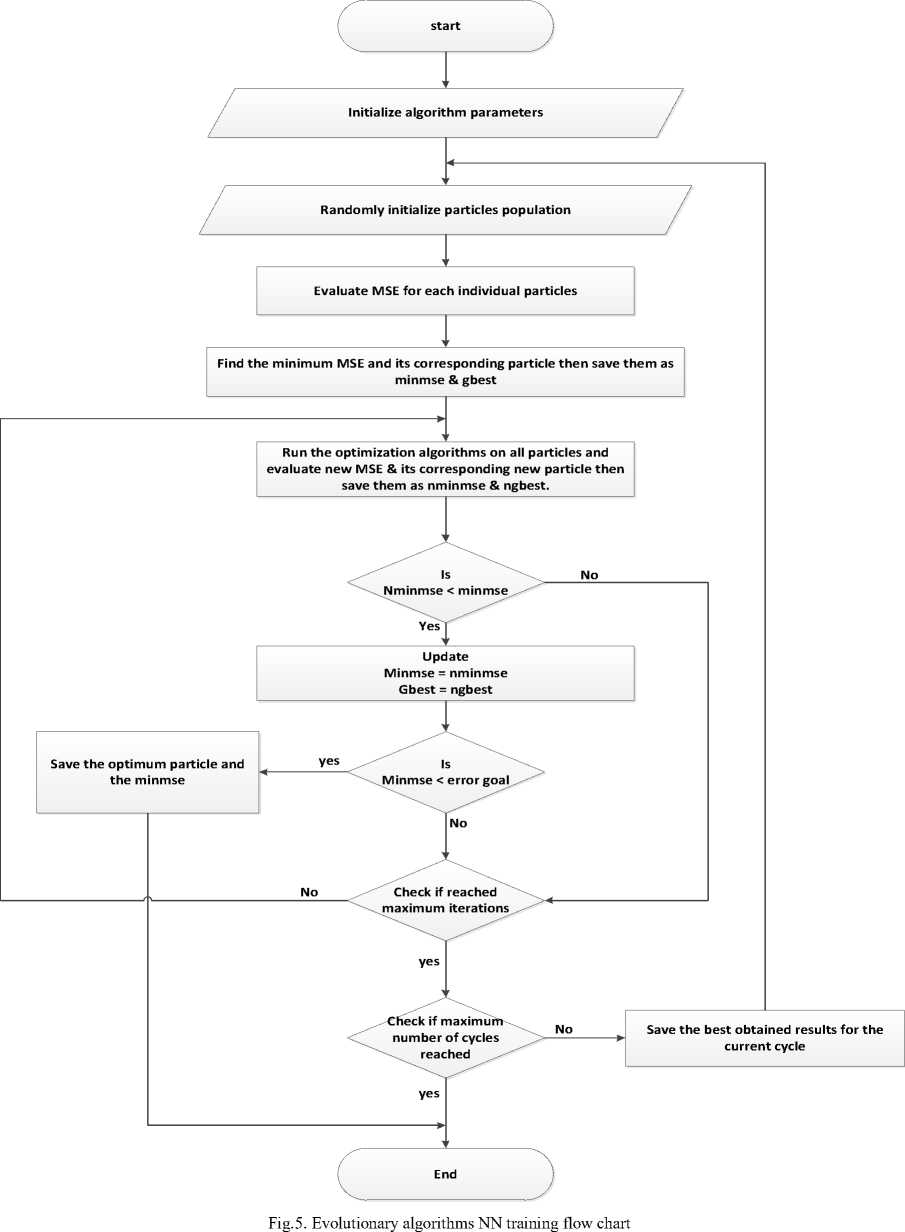
EAs are generic population-based meta-heuristic optimization algorithms. Most of the EAs were inspired by natural phenomena or living creatures. EAs use mechanisms inspired by biological evolution, such as reproduction, mutation, recombination, and selection. Each individual in the population is a candidate solution. Fitness function determines the quality of the candidate solutions. Each EA has its global and local search mechanism to guide population towards an optimum or near optimum solution by iterations. The general rules used to optimize neural network weights using EAs can be summarized as [23]:
-
• Consider the weights vector of the neural network as a single population particle in the swarm.
-
• Each swarm is a matrix consists of population size (popsize) rows and a number of weights (ndim) columns.
-
• Initialize the swarm matrix randomly according to the limits of the search space.
-
• Evaluate the Mean Square Error (MSE) for each particle, and evaluate the best particle and its location in the swarm matrix.
-
• Consider the particle with the minimum MSE is the global best (gbest) solution and each other is a local solution ( lbest ).
-
• Run the optimization algorithm to modify each particle lbest and the global gbest .
-
• Check if the iteration reached its maximum value
or the MSE is at its minimum value.
-
• Repeat till one of the above conditions achieved.
This research implements and compares the performance of four evolutionary population-based algorithms using MATLAB 2013 for training neural networks. Some of these algorithms are very well known and have been previously used for training neural network such as Practical Swarm Optimization (PSO). Other algorithms are recently used such as Artificial Bee Colony (ABC), Cuckoo Search Optimization (CSA), and Grass Root Optimization (GRO). Sandeep et al. [24] have proposed a modified PSO algorithm to train the Radial Basis Function Neural Network (RBFNN) more efficiently to classify the epileptic brain seizures. Akkar et al. [25, 26] have proposed a GRO algorithm to control mobile robot path tracking; also they conclude that GRO has faster convergence with a minimum number of iterations than other ten compared algorithms.
The NNs general training flow chart with populationbased evolutionary algorithms is shown in figure 5.
V. Experiments and Results
There are three sets of data (A, C, and E). Each set contains 100 signals over 23.6 second and 4096 sampling points sampled at 173.6 Hz. Each set has been filtered and distributed to five bands delta, theta, alpha, beta, and gamma. The energy distribution of these bands has been extracted, and then these extracted data have been fed into the neural network. The network has 5 input neurons, 3 hidden neurons, and 2 output neurons.
We have used pure linear activation function for hidden and output layer neurons. Each 100 data sample has been divided into 75 training samples and 25 testing samples. This paper has considered four experiments for ANN training using mentioned algorithms to classify the EEG signal.
Recording the classification rate (CR), average training mean square error (MSE- TR), average testing mean square error (MSE- TS), average error between MSE of training and testing datasets (MSE- ERR), the processing time (T) in seconds, and maximum iteration (Max-it) for the four experiments.
The network has been tested with the following parameters: no. of hidden neurons(L)=3, neuron bias(B)=1, no. of population search(POP)=10, space search limits(LIM)=2, and maximum iteration=100). This network performance with these parameters is used as a reference to compare it with the following experiments as illustrated in table 1.
It is clear from table 1 that GRO has gotten the highest 100% CR with relatively low MSE-TR, MSE-TS, MSE-ERR, low processing time, and requires minimum iteration to reach to an optimum solution. While PSO has gotten the smallest CR (83.56%) with lower processing time and lower MSE-ERR but requires maximum iteration to optimum the solution.
-
❖ Experiment 1:
In this experiment, we study the effect of changing the hidden layer neurons on the network performance for the four algorithms. Table 2 illustrates the ANN performance results for 3 states (L=2, L=8, L=16).
Comparing these results with the reference table we can conclude that:
-
1. For GRO algorithm the CR still the highest 100%, and enhanced MSE for all changes. While the time was increased when L decreased. Increasing L produce decreasing in processing time except for increasing L to 16 neurons make the time increased. Decreasing L needs more iteration to reach the optimum solution.
-
2. For ABC algorithm, decreasing L enhanced MSE, CR, processing time, and need the lowest iteration.
-
3. For CSA algorithm, there was not any improvement in network performance with changing L.
-
4. For PSO algorithm, MSE, CR, processing time was enhanced when L=2 & 8, while these
parameters were decreased when L=16.
-
❖ Experiment 2:
Comparing these results with the reference (B=1) we can conclude:
-
1. GRO algorithm still has got highest CR 100%. For B=0.8, MSE & processing time was improved with minimum iteration. For B=0.5, MSE was improved while processing time was retarded with more iterations.
-
2. There were small improvements in ABC algorithm performance with changing neuron bias to 0.5. While the performance parameters were decreased with B=0.8. But it requires less processing time in both cases.
-
3. For CSA algorithm, CR relatively still the same, there was a small improvement in MSE & required time for both cases.
-
4. For POS algorithm, MSE & time relatively still the same, there was an improvement in CR.
-
❖ Experiment 3:
Comparing these results with the reference results (table 1) we can conclude:
-
1. For GRO, increasing number of population search will improve MSE but with more iteration and more processing time. There was no relatively
-
2. For ABC, decreasing POP will improve MSE, CR & processing time. There was small performance improvement increasing POP.
-
3. For CSA, there was no relative improvement in NN performance with changing a number of population search.
-
4. For PSO, increasing pop will improve CR, MSE & less processing time with less iteration. There was no relative improvement decreasing it.
performance improvement when decreasing it.
-
❖ Experiment 4:
In this experiment, we study the effect of space limits for algorithms search on the network performance. Table 5 shows the ANN performance for (LIM=10, LIM=20).
Comparing these results with the reference one shown in table 1 we conclude:
-
1. For GRO, increasing LIM to10 will produce little performance improvement. Increasing more requires more processing time and more iteration to optimum the solution.
-
2. For ABC, increasing LIM will retard the performance and reduces the classification rate to 0%.
-
3. For CSA, increasing LIM will retard the ANN performance parameters.
-
4. For PSO, increasing LIM also will retard the ANN performance and reduces the classification rate to 0%.
VI. Conclusion
The results have shown that the GRO performance has gotten highest classification rates 100% with a minimum number of iterations over the four experiments than other compared algorithms.
From the experiments we can conclude:
-
1. Using too many neurons in the hidden layer could result in an over fitting problem. Therefore some compromise must be reached between too many and few neurons in the hidden layer.
-
2. Decreasing neuron bias little bit will produce minimum improvement in performance parameters except ABC algorithm needs to more bias reduction.
-
3. Increasing number of population search will improve the classification rate but with more processing time.
-
4. The ANN performance parameters will be retarded when increasing the space limits of algorithm search.
Table 1. Network algorithms performance (reference)
network performance at (L=3, B=1, POP=10, LIM=2)
|
ALG. |
MSE-TR |
MSE-TS |
MSE-ERR |
CR% |
T(SEC.) |
MAX-it |
|
GRO |
0.014752602 |
0.009834469 |
0.004918133 |
100% |
0.1705709 |
10 |
|
ABC |
0.080803 |
0.076898 |
0.003905 |
90.67% |
0.237751 |
100 |
|
CSA |
0.049238 |
0.04147 |
0.007498 |
98.22% |
0.204564 |
100 |
|
PSO |
0.107543 |
0.105559 |
0.001984 |
83.56% |
0.165719 |
100 |
Table 2. Network algorithms performance (experiment 1)
|
ALG. |
MSE-TR |
MSE-TS |
MSE-ERR |
CR% |
T(sec.) |
MAX-it |
|
|
L=2 |
GRO |
0.01195 |
0.01504 |
-0.00309 |
100% |
0.34883 |
41 |
|
ABC |
0.03509 |
0.03985 |
-0.0047 |
100% |
0.1311 |
64 |
|
|
CSA |
0.08127 |
0.08538 |
-0.0041 |
89.33% |
0.14918 |
100 |
|
|
PSO |
0.07593 |
0.08499 |
-0.00906 |
89.78% |
0.1215 |
100 |
|
|
L=8 |
GRO |
0.007945 |
0.008485 |
-0.0005 |
100% |
0.051874 |
2 |
|
ABC |
0.86583 |
1.004548 |
-0.1387 |
34.22% |
0.185191 |
100 |
|
|
CSA |
0.073595 |
0.09282 |
-0.0192 |
97.33% |
0.168304 |
100 |
|
|
PSO |
0.023531 |
0.032184 |
-0.0087 |
100% |
0.10766 |
81 |
|
|
L=16 |
GRO |
0.020849 |
0.019343 |
0.00151 |
100% |
0.68148 |
32 |
|
ABC |
1.497217 |
1.235105 |
0.26211 |
31.11% |
0.19751 |
100 |
|
|
CSA |
0.185517 |
0.174933 |
0.01058 |
69.33% |
0.19098 |
100 |
|
|
PSO |
0.254977 |
0.254267 |
0.00071 |
70.67% |
0.1515 |
100 |
Table 3. Network algorithms performance (experiment 2)
|
ALG. |
MSE-TR |
MSE-TS |
MSE-ERR |
CR% |
T(sec.) |
MAX-it |
|
|
B=0.8 |
GRO |
0.02959 |
0.027971 |
0.00162 |
100% |
0.054813 |
3 |
|
ABC |
0.360529 |
0.207229 |
0.1533 |
68% |
0.177287 |
100 |
|
|
CSA |
0.032043 |
0.022409 |
0.009634 |
98.67% |
0.152466 |
100 |
|
|
PSO |
0.098595 |
0.096442 |
0.002152 |
90.67% |
0.159342 |
100 |
|
|
B=0.5 |
GRO |
0.005437 |
0.007173 |
-0.007173 |
100% |
0.396994 |
31 |
|
ABC |
0.061153 |
0.070631 |
-0.00948 |
92.89% |
0.179606 |
100 |
|
|
CSA |
0.037943 |
0.043997 |
-0.00605 |
96.44% |
0.156822 |
100 |
|
|
PSO |
0.093813 |
0.121625 |
-0.02781 |
86.67% |
0.122585 |
100 |
Table 4. Network algorithms performance (experiment 3)
|
ALG. |
MSE-TR |
MSE-TS |
MSE-ERR |
CR% |
T(sec.) |
MAX-it |
|
|
POP=8 |
GRO |
0.027372 |
0.030459 |
-0.00309 |
100% |
0.107105 |
7 |
|
ABC |
0.015478 |
0.039269 |
-0.02379 |
100% |
0.167347 |
100 |
|
|
CSA |
0.039957 |
0.042912 |
-0.00296 |
97.78% |
0.156383 |
100 |
|
|
PSO |
0.154228 |
0.177085 |
-0.02286 |
84.44% |
0.145807 |
100 |
|
|
POP=20 |
GRO |
0.005354 |
0.01705 |
-0.0117 |
100% |
1.093379 |
95 |
|
ABC |
0.047642 |
0.07349 |
-0.02585 |
95.56% |
0.2549 |
100 |
|
|
CSA |
0.041691 |
0.109692 |
-0.068 |
96.44% |
0.233736 |
100 |
|
|
PSO |
0.023798 |
0.021396 |
0.002402 |
100% |
0.146368 |
76 |
Table 5. Network algorithms performance (experiment 4)
|
ALG. |
MSE-TR |
MSE-TS |
MSE-ERR |
CR% |
T(sec.) |
MAX-it |
|
|
LIM=10 |
GRO |
0.019679 |
0.037678 |
-0.018 |
100% |
0.18416 |
14 |
|
ABC |
0.704651 |
0.715262 |
-0.01061 |
33.78% |
0.193584 |
100 |
|
|
CSA |
0.362427 |
0.350213 |
0.012214 |
61.33% |
0.151075 |
100 |
|
|
PSO |
0.607278 |
0.667325 |
-0.06005 |
60.44% |
0.122344 |
100 |
|
|
LIM=20 |
GRO |
0.014666 |
0.0154 |
-0.00073 |
100% |
0.788708 |
57 |
|
ABC |
3.071112 |
3.144232 |
-0.07312 |
0% |
0.223524 |
100 |
|
|
CSA |
1.881178 |
1.326047 |
0.555131 |
42.22% |
0.195444 |
100 |
|
|
PSO |
4.64444 |
4.73333 |
-0.08889 |
0% |
0.15077 |
100 |
References Intelligent training algorithm for artificial neural network EEG classifications
- Niedermeyer E, and Lopes da Silva F. "Electroencephalography: basic principles, clinical applications, and related fields," 5th ed. London: Lippincott Williams and Wilkins;2005
- K. Lehnertz, F. Mormann, T. Kreuz, R. Andrzejak, C. Rieke, P. David, and C. Elger, “Seizure prediction by nonlinear EEG analysis,” IEEE Engineering in Medicine and Biology Magazine, 2003.
- L. M. Patnaik and O. K. Manyamb, "Epileptic EEG detection using neural networks and post-classification," Computer methods and programs in biomedicine- Elsevier, vol. 91, pp. 100-109. 2008.
- A.T. Tzallas et al., "Automated epileptic seizure detection methods: A Review Study," in Epilepsy - Histological, Electroencephalographic and Psychological Aspects, D. Stefanovic, Ed. InTech, 2012. pp. 75-98.
- Satapathy SK, Jagadev AK, and Dehuri S. "An empirical analysis of training algorithms of neural networks: a case study of EEG signals classification using java framework," Adv Intell Syst Comput 2015;309:151–60.
- S. Nirkhi, "Potential use of Artificial Neural Network in Data Mining," Proc. IEEE, Computer and Automation Engineering (ICCAE), 2010 The 2nd International Conference on, Singapore, pp. 339-343. 2010.
- M. N. H. Siddique and M. O. Tokhi, "Training neural networks: backpropagation vs. genetic algorithms," Proc. IEEE, Neural Networks, 2001, Proceedings, IJCNN '01. International Joint Conference on, Washington, DC, pp. 2673-2678 vol.4.. 2001.
- Guler, N.F., Ubeylli, E. D. and Guler, I., "Recurrent neural networks employing Lyapunov exponents for EEG signals classification", Expert System with Applications Vol. 29, pp.506-514. 2005.
- Jahankhani, P., Kodogiannis, V. and Revett, K. ,"EEG Signal Classification Using Wavelet Feature Extraction and Neural Networks", IEEE John Vincent, International Symposium on Modern Computing (JVA’06), 2006.
- Polat, K. and Gunes, S., "Classification of epileptiform EEG using a hybrid system based on decision tree classifier and fast Fourier transform", Applied Mathematics and Computation, 187 1017-1026.2007.
- Guo, L., Rivero, D., Seoane, J.A. and Pazos, A., "Classification of EEG signals using relative wavelet energy and artificial neural networks", GCE, 12-14.2009
- Chandaka, S., Chatterjee, A. and Munshi, S. , "Cross-correlation aided support vector machine classifier for classification of EEG signals", Expert System with Applications, Vol. 36, pp. 1329-1336. 2009
- Fathi V, Montazer GA. "An improvement in RBF learning algorithm based on PSO for real time application. Neurocomputing" ;111:169–76.2013
- R. Andrzejak, K. Lehnertz, F. Mormann, C. Rieke, P. David, and C. Elger, “Indications of nonlinear deterministic and finite-dimensional structures in time series of brain electrical activity: Dependence on recording region and brain state,” Phys. Rev. E, vol. 64, no. 6, p. 061907, Nov 2001.
- Hanan A. Akar, and Faris Ali Jasim, " optimal mother wavelet function for EEG signal analysis based on packet wavelet transform", International Journal of Scientific & Engineering Research, Volume 8, Issue 2, February-2017.
- Sachin Garg, Rakesh Narvey, " De-noising & feature extraction of EEG signal using wavelet transform", International Journal of Engineering Science and Technology (IJEST), Vol. 5 No.06 June 2013.
- M. Poulos, M. Rangoussi, N. Alexandria, and A. Evangelou, "On the use of EEG features towards person identification via neural networks,", Medical Informatics & the Internet in Medicine, vol. 26, no. 1, 2001, pp. 35–48.
- R. Palaniappan and D. Mandic, "EEG based biometric framework for automatic identity verification,", Journal of VLSI Signal Processing, Issue 49, 2007, pp.243–250.
- Xin Yang, Jianhua Dai, Huaijian Zhang, Bian Wu, Yu Su, Weidong Chen, and Xiaoxiang Zheng, "P300 Wave based Person Identification using LVQ neural network," Journal of Convergence Information Technology, Volume 6, Number 3. March 2011.
- Taravat, A., Proud, S., Peronaci, S., Del Frate, F., & Oppelt, N. "Multilayer Perceptron Neural Networks Model for Mateo sat Second Generation SEVIRI daytime cloud masking,", Remote Sensing, 7(2),1529-1539, 2015.
- Hanan A. Akar, and Firas R. Mahdi, "Evolutionary algorithms for neural networks binary and real data classification", the international journal of scientific & technology research volume 5, issue 07, July 2016.
- M. N. H. Siddique and M. O. Tokhi, "Training neural networks: back propagation vs. genetic algorithms," Proc. IEEE, Neural Networks, 2001, Proceedings, IJCNN '01. International Joint Conference on, Washington, DC, pp. 2673-2678 vol.4, 2001. doi: 10.1109/IJCNN.2001.938792.
- M. Cheng, and D. Prayogo, " Symbiotic organisms search: a new met heuristic optimization algorithm", Elsevier Ltd. Computers & Structures, vol. 139, pp. 98–112, 2014.
- Sandeep Kumar Satapathy, Satchidananda Dehuri, and Alok Kumar Jagadev " EEG signal classification using PSO trained RBF neural network for epilepsy identification" Elsevier Ltd., Informatics in Medicine Unlocked, 08 December 2016
- Hanan A. R. Akkar, Firas R. Mahdi, "Adaptive Path Tracking Mobile Robot Controller Based on Neural Networks and Novel Grass Root Optimization Algorithm", International Journal of Intelligent Systems and Applications(IJISA), Vol.9, No.5, pp.1-9, 2017. DOI: 10.5815/ijisa.2017.05.01
- Hanan A. R. Akkar, Firas R. Mahdi,"Grass Fibrous Root Optimization Algorithm", International Journal of Intelligent Systems and Applications(IJISA), Vol.9, No.6, pp.15-23, 2017. DOI: 10.5815/ijisa.2017.06.02
