Internet Addiction and its Influence on University Students using Relationship Mining

Author: Geetika Johar, Ravindra Patel
Journal: International Journal of Intelligent Systems and Applications @ijisa
Article in issue: 2 vol.18, 2026.
Free access
Internet addition is a type of mental disorder. It is the result of the excessive internet usage and is concern for the physical and psychological well-being. This paper employs machine learning techniques to understand, evaluate and predict the severity of internet addiction and its impact on health. For this purpose, a real dataset of “Internet Addiction and Mental Health among College Students in Malawi” has been considered. It consists of self-assessed response of 984 university student participants. That includes demographic, behavioral and health-related information. Based on this dataset, two type of relationship have been discussed (1) relation between “demographic features” and “health complexities” and (2) relation between “Internet usage behaviors” and “health complexity”. Next, the key features were identified through comprehensive data analysis. Additionally, there machine learning algorithms namely Backpropagation Neural Network, Random Forest, and C4.5 Decision Tree— were tested to identify ‘internet addiction’ in a subject with the four severity levels (0 to 3). According to results, the Random Forest classifier achieved the highest accuracy of 91%. Additionally, C4.5 algorithm has been used for extracting rules for predicting “Internet addiction” severity level. These rules are demonstrating a relation between “Internet usages pattern” and “Internet addiction severity level”. Additionally, these rules are easy to interpret and can be utilized as a practical tool for self-assessment towards Internet addiction and additionally beneficial for healthcare professionals.
Decision Tree, Digital Addiction, Feature Relevance, Internet Addiction, Machine Learning, Rule based Learning, Physical and Mental Health
Short address: https://sciup.org/15020322
IDR: 15020322 | DOI: 10.5815/ijisa.2026.02.07
Text of the scientific article Internet Addiction and its Influence on University Students using Relationship Mining
Addiction is a type of mental disorder that affects the brain and behavior [1]. Now in these days due to excessive use of internet one more type of addiction is being developed in youth, which is known as internet addiction. It covers many channels like social media addiction and internet addiction [2]. Due to this youth are wasting a large amount of time on Internet-based activities. The ubiquitous nature of the internet can negatively impact internet users' physical and psychological health [3]. However, the Internet also used as educational resources to the youths [4]. Therefore, differentiation between healthy use of internet and addictive use of internet is essential to study. The internet addiction can change the youth’s behavior, which also negatively change the health conditions.
In this paper, the youngster’s behavioral attributes and health attributes are considered to establish relationship between ‘Internet usage pattern’ and ‘Health issues in youth’. Next, to measure the internet addiction in youngsters a machine learning model is presented. The model accepts “Internet usage behavior” related attributes and predict the severity level of internet addiction in a subject as a score between 0 and 3. The model is providing a set of rules based on internet usage behavior. Anyone can use these rules to evaluate their internet usage pattern and conclude the internet addiction level. These rules can be used in educational and health care industries to access subject’s mental health in terms of Internet addiction level.
This study is based on a recently published survey [5]. The survey is conducted among College Students in Malawi. The survey is known as Internet Addiction and Mental Health survey based on a set of questions. The data were collected from 984 participants (345 females and 639 males). 938 participants are undergraduates and 45 postgraduates, 749 from science and 233 from Humanities and Social Science disciplines. This dataset is used for understanding Internet addiction in university students. This dataset includes the students' internet usage behavior and the risk of internet addiction. This paper explores, discuss, and report the essential insights and relationship between ‘internet usage behavior’ and ‘internet addiction’. The paper also highlights the relation between Internet usage behavior and health complexities. Moreover, a machine learning model is introduced for predicting Internet addiction in university students. Therefore, the paper includes three main parts of discussion:
• Data exploration: The dataset is containing questions and answers provided by university students. The dataset features are answers to the asked questions in the survey. In this part, the potential features are identified, using the feature importance analysis [6]. Additionally, Machine Learning (ML) algorithms have been applied to validate the potential of behavioral features.
• Relationship Study: The dataset features can be categorized into three types: Behavioral features, Demographic Features, and Health complexities. The relationship between these features has been investigated under two scenarios: (1) Relationship between “behavioral features” and “health complexity” and (2) Relationship between “health issues” and “demographic features”. Based on this analysis potential features have been identified and a dataset has been constructed.
• Decision Rule Mining: By using the created dataset, ML algorithm has been trained and validated [7] to mine relationship rules. For this purpose, decision tree algorithm [8] has been used. The aim of applying to identify a set of rules that can represent a relationship between “Internet access behavior” and the “severity level of internet addiction”. These rules can minimize the effort of psychologists and academicians to identify the ‘internet addiction’ severity level in a subject to prevent health loss.
2. Experimental Dataset
For an effective discussion, this paper is organized as: This section provides an overview of the work involved in this paper. The next section provides a detailed study of the survey data by using machine learning-based data exploration. The third section addresses the relationship between “health issues”, “behavioral features” and “demographic features”. The fourth section introduces an Internet prediction model using the employment of a decision tree algorithm. This model is also transformed into the relationship rules for predicting internet addiction by using behavioral features. Finally, based on the experiments and findings the last section includes the conclusion of the discussed work.
The used dataset is called: “Data on Internet Addiction and Mental Health among university students in Malawi”, which is contributed by [1]. The dataset is available for download using the given URL [9]. The dataset features can be subdivided into three parts:
-
• First is containing the “demographic” information of the university students.
-
• Second part of data includes the “behavioral features”.
-
• Last part of the data contains the “psychological and physical” features.
-
2.1. Dataset Exploration
In addition, with these features relevant class labels are also associated to indicate ‘Internet addiction’. Internet addiction is defined as a severity level between a score of 0 and 3. The dataset sample includes the records of a total of 984 university students. The combined dataset has a total of 52 attributes.
The dataset includes a total of 52 attributes; thus, the dataset dimensions are higher. In this context, the dataset attributes are explored to find potential attributes. First, the attributes have been separated based on the categories. Next, each category of attributes has been evaluated. First, “socio-demographic” features have been analyzed, which contain five attributes as given in Table 1. Using these features, the influence of socio-demographic data on being Internet addicted has been measured.
Table 1. Socio-demographic features
|
S. No. |
Attribute |
Rank |
|
1 |
'Gender' |
3 |
|
2 |
'Age_grp' |
1 |
|
3 |
'Level_study' |
5 |
|
4 |
'Yr_study' |
2 |
|
5 |
'Discipline' |
4 |
The dependency on demographic features to predict internet addiction is measured using the feature relevance analysis. The relevance score is used to rank the features. According to rank, the features namely ‘year of study’ and ‘Age Group’ have the high potential to decide the internet addiction. Next, the “behavioral features” of the dataset have been considered. Here also the dependence of “behavioral features” on “internet addiction” has been measured using feature relevance analysis. The feature importance of “behavioral features” in terms of rank is given in Table 2. According to the ranks, ‘online_glued’ and ‘feel_depressed’ are the most potential features for indicating the internet addiction.
Table 2. Behavioral features
|
S. No. |
Attribute |
Rank |
S. No. |
Attribute |
Rank |
|
1 |
stay_online |
12 |
11 |
online_anticipation |
17 |
|
2 |
neglect_chores |
9 |
12 |
life_no_internet |
6 |
|
3 |
Excitement |
16 |
13 |
act_annoyed |
13 |
|
4 |
Relationships |
18 |
14 |
late_night_logins |
7 |
|
5 |
life_complaint |
11 |
15 |
feel_preoccupied |
3 |
|
6 |
school_work |
14 |
16 |
online_glued |
1 |
|
7 |
email_socialmedia |
20 |
17 |
time_cutdown |
10 |
|
8 |
job_performance |
19 |
18 |
hide_online |
8 |
|
9 |
defensive_secretive |
4 |
19 |
more_online_time |
5 |
|
10 |
disturbing_thoughts |
15 |
20 |
feel_depressed |
2 |
The remaining features contain the internet usage behavior using answers to 20 questions. These features include the “physical and psychological health” related features. The dependence between ‘health issues’ and “internet addiction” is given in Table 3. The ‘troubled’ feature is found most potential feature. After analysis of all three categories of features, we found, the dataset has a large dimension and may include some less informative attributes also. Therefore, a technique is required to filter out less relevant features and can select essential features from all categories of features.
Table 3. Health complexities Feature
|
S. No. |
Attribute |
Rank |
S. No. |
Attribute |
Rank |
|
1 |
headache |
2 |
11 |
enjoyment |
8 |
|
2 |
appetite |
11 |
12 |
Decisions |
10 |
|
3 |
Sleep |
16 |
13 |
Work |
3 |
|
4 |
Fear |
7 |
14 |
Play |
6 |
|
5 |
shaking |
18 |
15 |
interest |
14 |
|
6 |
nervous |
15 |
16 |
worthless |
20 |
|
7 |
digestion |
5 |
17 |
suicide |
19 |
|
8 |
troubled |
1 |
18 |
tiredness |
9 |
|
9 |
unhappy |
4 |
19 |
uncomfortable |
13 |
|
10 |
cry |
17 |
20 |
easily_tired |
12 |
-
2.2. Feature Dependency Analysis
-
2.3. Feature Validation
Next, the selected dataset features are validated by using ML algorithms. There are three ML algorithms have been considered, namely the C4.5 decision tree, Random Forest Classifier, and Backpropagation neural (BPN) network [1214]. These algorithms have some advantages over other algorithms. For instance, neural network is a scalable algorithm
The feature relevance analysis is useful in identifying potential features and helping to reduce the dimensions of the dataset [10]. The less-dimension data can reduce the computational complexity and improve the efficiency of a ML-based system [11]. First, the random forest tree is used to find rank of the features and then a threshold is applied to eliminate fewer essential features. For selecting appropriate features from the “behavioral” category of data a 5% threshold has been considered. By applying the threshold, a total of 7 features has been selected out of 20. The selected features are ‘defensive secretive’, ‘life no internet’, ‘late night logins’, ‘feel pre-occupied’, ‘online glued’, ‘hide online’, and ‘more online time’. Similarly, for selecting the features from the ‘health issue related features” the threshold of 4% has been used, because when we use a threshold of 5%, then only three features namely ‘troubled’, ‘headache’, and ‘work’ is selected. Therefore, we have used a threshold of 4% for selecting a greater number of features. The selected features from “health complexity” data are ‘headache’, ‘appetite’, ‘fear’, ‘digestion’, ‘troubled’, ‘unhappy’, ‘enjoyment’, ‘decisions’, ‘work’, ‘play’ and ‘tiredness’.
that can work with large and complex data too. Similarly, random forest is an ensemble learning technique, which guarantees the accurate data classification. Additionally, C4.5 is a transparent model, which can be used to demonstrate the relationship between attributes. This experiment also demonstrates “How the “behavioral features” and “health complexity” features can be used to predict internet addiction”. Therefore, both the type of dataset features has been treated separately. These features are selected by the random forest based relevance analysis. Additionally, missing values are completed by filling zeros in places of null or missing values. Additionally, the ML algorithms have been trained and validated. Additionally, the performance has been recorded in terms of accuracy (%), precision, recall, and f-score. For this purposed four fold cross validation has been used.
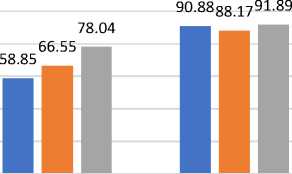
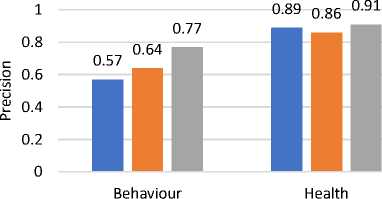
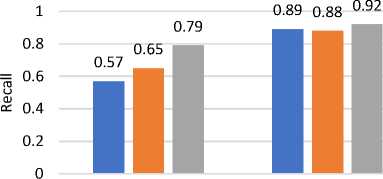
Fig. 1(a) demonstrates the ML algorithms' validation accuracy for predicting “internet addiction” using behavioral and health features independently. Additionally, the mean precision is given in Figure 1(b), mean recall is given by Figure 1(c), and F-score is given in Figure 1(d). In this figure, the X-axis shows the feature type, and the Y-axis shows the accuracy percentage, precision, recall and f-score, respectively. According to the results, the performance of ML algorithms is higher, when only “health features” (physical and psychological) are used for training. On the other side “behavioral features” are less accurate for internet addiction prediction. Additionally, the health-related features are more relevant for predicting “internet addiction”. These features can predict 91.89% accurately. Additionally, the “behavioral features” are less relevant and can predict only 78.04% accurate results.
Based on the performance of ML algorithms, all the evaluated parameters are providing similar results. It is found that the random forest classifier provided the highest accuracy 78.04% for ‘behavioral features’ and 91.89% for ‘health features. In second place, the C4.5 decision tree is found to be accurate. It provides 66.55% correct results for ‘behavioral features’ and 88.17% for ‘health features. At last, the ANN algorithm provides 58.85% accuracy for ‘behavioral features’ and 90.88% for ‘health features. Based on the accuracy, we can use Random Forest or C4.5 decision tree for further experiments.
Dataset Validation
Behaviour Health
Data Used
60 га
<
■ ANN ■ C4.5 ■ Random Forest
Fig.1(a). Accuracy of classifiers over selected features
Precision for Validation
Data Used
■ ANN ■ C4.5 ■ Random Forest
Fig.1(b). Precision of classifiers over selected features
Recall for Validation
Behaviour Health
Data Used
■ ANN ■ C4.5 ■ Random Forest
Fig.1(c). Recall of classifiers over selected features f-score for Validation

Data Used
■ ANN ■ C4.5 ■ Random Forest
Fig. 1(d). F-score of classifiers over selected features
Both the ML models are transparent models. The transparent models are able to describe how the prediction is made by using the considered set of features. Thus, these models can be transformed into suitable rules, which can be used for manual analysis of data. The advantage of such model is the ease of output interpretation [15]. The proposed work, requires visualization of the results in the form of rules. The rules predict the “Internet addiction” severity level by using the combinations of features and relevant values. In this context, the random forest is a bagging-based classification technique. It utilizes multiple trees or a set of decision trees for concluding the final prediction. On the other hand, the C4.5 decision tree results in simple and based on a single decision tree, which provides ease of understanding the rulebased outcomes. Therefore, it is decided to utilize the C4.5 decision tree for further experiments.
3. Explaining Dependencies
The selected features from the previous section have been used and key insights of the dataset have been explained in this section. Additionally, a relationship between “behavioral features”, “demographic features” and “health features” are discussed.
-
3.1. Behavioral Features
In the previous section, the seven behavioral features have been identified. These features are based on the following survey questions:
-
• Become defensive or secretive when anyone asks: “what do you do online”?
-
• Fear that: “life without the Internet would be boring, empty, and joyless”?
-
• Do you lose sleep due to late-night logins?
-
• Do you feel preoccupied when off-line, or fantasize about being online?
-
• Do you find yourself saying "a few more minutes" when online?
-
• Do you try to hide how long you've been online?
-
• Do you choose to spend more time online over going out with others?
The students were provided their answers on a scale between 0 and 5. The score is given to 0 when the question is “Not Applied”, 1 when she or he has “rare experience” when the answer is 2 which means “occasionally”, and 3 shows “frequent” behavior. In addition, when the answer is 4 then it means the behavior is “Often” and when 5 then it means it is “Always”. Table 4 shows the answers frequency given by the students. There are some of the students also who have not responded to the questions. That is indicated as the missing value. A total of 4.16% of students are belonging to this category.
Table 4. Answers given for the behavioral questions
|
Answers |
Defensive secretive |
Life no internet |
Late night logins |
Feel preoccupied |
Online glued |
Hide online |
More online time |
|
0 |
203 |
120 |
136 |
179 |
113 |
242 |
159 |
|
1 |
252 |
191 |
251 |
258 |
207 |
237 |
279 |
|
2 |
171 |
159 |
185 |
212 |
196 |
160 |
211 |
|
3 |
136 |
155 |
161 |
149 |
184 |
129 |
135 |
|
4 |
100 |
120 |
127 |
92 |
138 |
92 |
104 |
|
5 |
107 |
228 |
83 |
69 |
132 |
98 |
82 |
|
Missing |
15 |
11 |
41 |
25 |
14 |
26 |
14 |
Based on the results, there are a large number of students who either never or very few times misbehave with their normal routine. There are less than 21.6% of users are occasionally misbehaving, and less than 18.7% of users are always misbehaving. In addition, there are less than 13.41% of users who are highly influenced by behavior change. But there is a high number of users says 23.2% of users feel there is no life without the internet. It is also observed most of the students are giving answers in terms of 0 and 1. Students who answer in terms of 2 and 3 are less and answers 4 and 5 show a very low number of answers. But the behavior ‘life no internet’ shows a spike in answer giving pattern. Therefore, it is a normal human behavior. This section provides an analysis of the behavioral features and the next section includes the health complexities-based features.
Table 5. Health complexities feature
|
Complexities |
0 |
1 |
Missing |
|
Headache |
314 |
653 |
17 |
|
Appetite |
202 |
764 |
18 |
|
Fear |
195 |
771 |
18 |
|
Digestion |
179 |
786 |
19 |
|
Troubled |
236 |
729 |
19 |
|
Unhappy |
247 |
717 |
20 |
|
enjoyment |
247 |
711 |
26 |
|
decisions |
276 |
690 |
18 |
|
Work |
236 |
724 |
24 |
|
Play |
256 |
697 |
31 |
|
Tiredness |
195 |
759 |
30 |
-
3.2. Health Features (Physical and Psychological)
-
3.3. Relation Study
The health features are also obtained by the questions from these category eleven features were identified. These features are very common among most of the students. The students were provided their answers with yes or no. These features can be considered as the negative health effects due to internet addiction. There is only a maximum of 3.15% of users who are not provided any answers. It means the dataset also contains the missing values.
Table 5 shows answers to the health complexities. According to the results, 79.87% of users are facing digestion issues, 78.35% of users are feeling fear, 77.64% of users are facing appetite issues, and 77.13% of users are feeling tired. There are less than 31.91% of users have never suffered from any health complexities. Using this analysis, it can be said that the most common issues are digestion, feeling fear, appetite, and tiredness. Additionally, the highest 79.87% of users are affected with digestion issues. The digestion is the most common issue due to excessive use of the internet. In this section, the health complexities-based data has been investigated. The next section shows the study of the relationship between demographic data and health complexities-related features.
This section is establishing two relationships between:
-
A. Demographic features and Health complexities
-
3.3.2. Internet Usage Behavior and Health complexities
In this section, the relationship between demographic features and health issues has been measured. For this task, random forest classifier-based feature relevance has been considered. The aim is to identify, which demographic features are more responsible for health issues due to internet use. Table 6 shows the relationship between demographic features and health issues in terms of feature rank.
Table 6. Feature relevance rank of demographic features with respect to health issues
|
Health complexity |
Age Group |
Year of study |
Discipline |
Gender |
Level Study |
|
Headache |
5 |
4 |
3 |
2 |
1 |
|
Appetite |
5 |
4 |
2 |
3 |
1 |
|
Fear |
5 |
4 |
2 |
3 |
1 |
|
Digestion |
5 |
4 |
2 |
3 |
1 |
|
Troubled |
5 |
4 |
2 |
3 |
1 |
|
Unhappy |
5 |
4 |
3 |
2 |
1 |
|
Enjoyment |
5 |
4 |
3 |
2 |
1 |
|
Decisions |
5 |
4 |
3 |
2 |
1 |
|
Work ability |
5 |
4 |
2 |
3 |
1 |
|
Play |
5 |
4 |
3 |
2 |
1 |
|
Tiredness |
5 |
4 |
3 |
2 |
1 |
|
Total |
55 |
44 |
29 |
26 |
11 |
According to the table, the feature relevance between ‘demographic data’ and ‘headache and appetite’ shows the higher influence of features namely ‘age group’, ‘year of study’, and ‘discipline’ towards ‘headache and appetite’. Similarly, dependence between ‘fear’ and ‘demographic features’ shows most relevant features are ‘age group’, ‘year of study’, and ‘gender’. Additionally, ‘discipline’ has less relevance as compared to ‘gender’. The relevance between ‘Digestion’ and ‘demographic features’ shows only two features ‘age group’ and ‘year of study’ is most relevant. Feeling ‘troubled’ is a strong psychological disorder.
The relation between ‘demographic features’ and ‘Troubled’ shows the ‘age group’, ‘year of study’, and ‘gender’ are the most relevant features. Similarly, feeling ‘unhappy’ shows the higher dependence on ‘age group’, ‘year of study’, and ‘discipline’. Next, the relation between ‘demographic features’ and ‘feeling enjoyment’ shows that ‘age group’ and ‘year of study’ have higher relevance, and ‘discipline’ and ‘gender’ have similar relevance. The decision-making ability is one of the most important abilities of human beings. Internet addiction can also impact decision-making ability. The decision-making ability is highly influencing with ‘age group’, ‘year of study’, and ‘discipline’. Similarly, the workability shows high dependence on ‘age group’, ‘year of study’, and ‘gender’. Additionally, the demographic feature relevance concerning play shows ‘age group’, ‘year of study’, and ‘discipline’ is the most potential features. At the last, feeling tiredness is a side effect of over-internet usage. The features ‘age group’, ‘year of study’, and ‘Discipline’ are showing higher relevance with feeling tiredness. In this section relationship between health features and demographic features have been explained. In next section the relation between health and behavior is discussed.
Next, in Table 7 the relationship between ‘internet usage behavior’ and ‘health issues’ has been given. For the ‘headache’ the high relevance features are “More online Time”, “Online Glued”, “Feeling preoccupied” and being “defensive or secretive”. Additionally, when considering the Appetite then the behavioral features namely ‘hiding online’, ‘late night login’, ‘no life without internet’, and ‘sticking online’ are showing higher relevance then others. Next, the relation between ‘internet usage behaviors and ‘fear’ shows the attributes ‘online glued’, ‘defensive or secretive’, ‘late night logins’, and ‘more online time’ as the key factors of fear. Next, the ‘Digestion’ shows the features ‘defensive or secretive’, ‘late night logins’, ‘feeling preoccupied’, and ‘online glued’ are the most influencing.
Table 7. Feature relevance rank of internet usage ‘behavior’ and ‘health’
|
Health complexity |
More online time |
Online glued |
Feel preoccupied |
Defensive secretive |
Late night logins |
Life no internet |
Hide online |
|
Headache |
7 |
6 |
5 |
4 |
3 |
2 |
1 |
|
Appetite |
1 |
4 |
3 |
2 |
6 |
5 |
7 |
|
Fear |
4 |
7 |
3 |
6 |
5 |
1 |
2 |
|
Digestion |
1 |
4 |
5 |
7 |
6 |
3 |
2 |
|
Troubled |
3 |
7 |
4 |
5 |
6 |
1 |
2 |
|
Unhappy |
3 |
6 |
4 |
1 |
5 |
2 |
7 |
|
Enjoyment |
2 |
5 |
7 |
6 |
3 |
4 |
1 |
|
Decisions |
3 |
6 |
2 |
5 |
7 |
1 |
4 |
|
Work ability |
5 |
6 |
2 |
4 |
7 |
1 |
3 |
|
Play |
2 |
1 |
4 |
3 |
7 |
6 |
5 |
|
Tiredness |
4 |
1 |
5 |
6 |
7 |
3 |
2 |
|
Total |
35 |
53 |
44 |
49 |
62 |
29 |
36 |
Further, the rank of ‘internet usage behavior’ with ‘Troubled’ shows the higher ranks, of ‘online glued’, ‘late night login’, ‘defensive or secretive’, and ‘feel preoccupied’. Next, for “unhappy feelings” it is found the most relevant features are ‘hiding online’, ‘online glued’, ‘late night login’, and ‘feeling preoccupied’. Therefore, continuously utilizing the internet can make you unhappy and it can change student's mental health. Moreover, the enjoyment is a negative psychological disorder. The enjoyment shows high dependence of ‘Feeling preoccupied’, ‘defensive or secretive’, ‘online glued’, and ‘no life without internet’.
But, when considering the ‘internet usage behavior’ with ‘decision making’ then it is found ‘late night login’, ‘online glued’, ‘defensive or secretive’, and ‘hide online’ are the most potential features. Work ability shows the change in physical performance. That can negatively affect a person. Using the ranking, ‘late night login’, ‘online glued’, ‘more online time’, and ‘defensive or secretive’ are found more relevant behavior. Play is indicating the student is unable to play important part of life. It leads to disability and negative effects. The ‘internet usage behavior’ features namely ‘late night login’, ‘no life without internet’, ‘hiding online’, and ‘feeling preoccupied’ are shows a high influence on this feature. Tiredness also influences physical performance. The relationship with ‘internet usage behavior’ shows ‘late night login’, ‘defensive or secretive’, ‘feel preoccupied’, and ‘more online time’ are the most relevant features.
-
3.4. Summary
According to the overall analysis, the relevance of features is different for two different health complexities. Based on the feature ranking, the mean feature position has been calculated. Table 8 demonstrates the mean rank of demographic features for predicting “health issues”. According to the mean ranking values, ‘Age Group’ and ‘Year of Study’ are more relevant for predicting health complexities. In addition, features ‘discipline’ and ‘Gender’ are showing similar importance.
Table 8. Mean feature relevance ranking of demographic feature
|
Feature |
Mean Importance |
|
Age Group |
5 |
|
Year of study |
4 |
|
Discipline |
2.63 |
|
Gender |
2.36 |
|
Level Study |
1 |
Table 9. Mean feature relevance ranking of internet usage behavior
|
Features |
Mean Ranking |
|
More Online Time |
3.18 |
|
Online Glued |
4.81 |
|
Feel pre-occupied |
4 |
|
Defensive Secretive |
4.45 |
|
Late Night Logins |
5.63 |
|
Life No Internet |
2.63 |
|
Hide Online |
3.27 |
Similarly, Table 9 shows the mean position of ‘internet usage behavior’ for health complexity prediction. According to the ranks, ‘Late Night Login’ has high relevance. Additionally, ‘Online Glued’ and ‘Defensive Secretive’ have similar importance. Moreover, ‘Hide Online’ and ‘More Online Time’ are normal or common behaviors.
In this section, we have discussed the relationship between ‘health features’ with the ‘demographic’ and ‘internet usage behavior’ features. The next section provides the application of the ML algorithm in Internet addiction prediction.
4. Internet Addiction Prediction Model
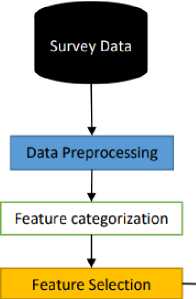
By using the analysis of previous sections, a mixed set of features (i.e. 5 features from demographic features and 7 features from ‘internet usage behavior’) are considered for developing an Internet addiction prediction model. The prediction model is based on decision tree rules, and by using these rules we can identify the severity level of the internet addiction. Additionally, by estimating the severity level of internet addiction a health expert can cure the future possible negative health impact on internet users. The proposed decision tree rules-based internet addiction prediction model can also help the psychologist to reduce the question and answering session by utilizing these extracted rules. These rules are also categorizing the addiction level of the internet user to support the university students. In this context, Figure 2 shows the proposed Internet addiction prediction system. The first component is the survey data, which is collected by the university students. In the dataset, a total of 52 features are available. Before utilizing the dataset, it is required to preprocess the dataset. Therefore, the missing values are replaced with the zero, which is currently indicated using value 99.
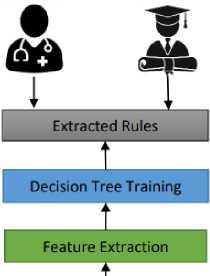
Combining Feature
Fig.2. Proposed internet addiction prediction model
Next, the dataset attributes are categorized into ‘demographic features’, ‘health complexities’, and ‘Internet usage behavior’. However, the prediction of Internet Addiction using health complexities is simple and accurate manner. Normally, it offers high detection accuracy up to 91%.
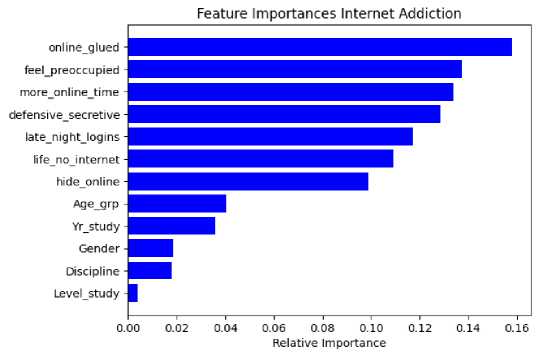
Fig.3. Feature ranking to predict internet addiction severity
However, the proposed work aims to identify Internet Addiction using the socio-demographic features and Internet Usage Behavior. Therefore, by using demographic features a total of 5 features, and by using the internet usage behavior a total of 7 features has been identified. By combining these features a mixed set of features has been prepared, which contains a total of 12 features. Next, the mixed features are used to measure feature importance concerning ‘internet addiction’. The obtained feature rank for internet addiction prediction is demonstrated in Fig. 3. Next, the feature selection has been performed, by applying a 5% threshold. The final obtained features are ‘defensive secretive’, ‘life no internet’, ‘late night login’, ‘feel preoccupied’, ‘online glued’, ‘hide online’, and ‘more online time’.
Finally, based on selected features, it is found that the “behavioral features” are the most relevant characteristics to decide Internet Addiction severity level. Thus, a total of seven potential internet usage features has been selected for decision rule mining. The decision rules are developed by using the C4.5 decision tree algorithm. The C4.5 decision tree is selected based on a comparative study between random forest, ANN, and C4.5 tree. The C4.5 algorithm utilizes the training samples for building the tree. The tree is further transformed into rules based on tree branches [16]. Table 3 shows the rules developed by the C4.5 decision tree algorithm. The rules are organized based on the severity level of internet addiction. There is a total of 16 rules prepared. For deciding “no internet addiction” one decision rule is prepared. For deciding level 1 of internet addiction 8 rules, for level 2 of internet addiction 6 rules, and for level 3 of internet addiction a single rule is prepared.
Table 10. Decision rules
|
Decision rules |
Class |
|
|
1. |
If ‘late night logins’ <= 2.50 & ‘online glued’ <= 1.50 & ‘feel preoccupied’ <= 0.50 & ‘life no internet’ <= 2.50 |
0 |
|
1. |
If ‘late night logins’ <= 2.50 & ‘online glued’ <= 1.50 & ‘feel preoccupied’ <= 0.50 & ‘life no internet’ > 2.50 |
|
|
2. |
If ‘late night logins’ <= 2.50 & ‘online glued’ <= 1.50 & ‘feel preoccupied’ > 0.50 & ‘hide online’ <= 1.50 |
|
|
3. |
If ‘late night logins’ <= 2.50 & ‘online glued’ <= 1.50 & ‘feel preoccupied’ > 0.50 & ‘hide online’ > 1.50 |
|
|
4. |
If ‘late night logins’ <= 2.50 & ‘online glued’ > 1.50 & ‘defensive secretive’ <= 1.50 & ‘feel preoccupied’ <= 2.50 |
1 |
|
5. |
If ‘late night logins’ <= 2.50 & ‘online glued’ > 1.50 & ‘defensive secretive’ <= 1.50 & ‘feel preoccupied’ > 2.50 |
|
|
6. |
If ‘late night logins’ <= 2.50 & ‘online glued’ > 1.50 & ‘defensive secretive’ > 1.50 & ‘more online time’ <= 1.50 |
|
|
7. |
If ‘late night logins’ > 2.50 & ‘more online time’ <= 1.50 & ‘online glued’ <= 3.50 & ‘defensive secretive’ <= 3.50 |
|
|
8. |
If ‘late night logins’ > 2.50 & ‘more online time’ <= 1.50 & ‘online glued’ > 3.50 & ‘defensive secretive’ <= 0.50 |
|
|
1. |
If ‘late night logins’ <= 2.50 & ‘online glued’ > 1.50 & ‘defensive secretive’ > 1.50 & ‘more online time’ > 1.50 |
|
|
2. |
If ‘late night logins’ > 2.50 & ‘more online time’ <= 1.50 & ‘online glued’ <= 3.50 & ‘defensive secretive’ > 3.50 |
|
|
3. |
If ‘late night logins’ > 2.50 & ‘more online time’ <= 1.50 & ‘online glued’ > 3.50 & ‘defensive secretive’ > 0.50 |
2 |
|
4. |
If ‘late night logins’ > 2.50 & ‘more online time’ > 1.50 & ‘online glued’ <= 3.50 & ‘defensive secretive’ <= 1.50 |
|
|
5. |
If ‘late night logins’ > 2.50 & ‘more online time’ > 1.50 & ‘online glued’ <= 3.50 & ‘defensive secretive’ > 1.50 |
|
|
6. |
If ‘late night logins’ > 2.50 & ‘more online time’ > 1.50 & ‘online glued’ > 3.50 & ‘more online time’ <= 3.50 |
|
|
1. |
If ‘late night logins’ > 2.50 & ‘more online time’ > 1.50 & ‘online glued’ > 3.50 & ‘more online time’ > 3.50 |
3 |
The generated rules are easy to understand. These rules can be understood in the form of the “IF Then Else” format. A common person can also perform an interpretation of developed decision rules for identifying internet addiction levels. Therefore, by asking simple 3 to 4 questions and relevant answers, anyone can compare the rules and select the fit rule to decide the level of internet addiction. Therefore, this system has a role in medicine as well as academics. By using these rules psychologist can analyze a victim to improve their health. Additionally, in academics, this model can be used to understand the current mental condition of university students. Because mental health can impact the academic performance of students. In addition, if the severity level of internet addiction is increased then it also impacts physical health.
We made this conclusion because, in this paper, we also measured the relationship between health features and internet usage behavior. Where we found the health features are highly dependent on internet usage behavior. Additionally, we can make more precise predictions of internet addiction using health features. Therefore, using these experiments and data analysis, we can say:
• The internet usage behavior can impact the physical as well as mental health
• In place of predicting internet addiction using physical and mental health, it is essential to keep monitoring the internet usage behavior of students.
• However, the demographic information is not simulating much influence in prediction of internet addiction. But, in light of health-related features, two demographic features namely ‘Age group’ and ‘year of study’ have more influence.
5. Conclusions
The Internet is one of the most used technologies among students. It helps students in many ways, but excessive internet use can create health issues. This paper presents a detailed investigation of “internet addiction” and its influencing factors. The aim is to explore and establish the relationship between “Internet usage behavior” and “health” in students. Therefore, the data collected from University Students in Malawi [1] has been considered. The dataset includes the “demographic features”, “behavioral features” and “health features”. The data analysis is performed using data visualization, feature importance analysis, and machine learning algorithms. First, dataset features are categorized and then the potential features are identified based on feature importance analysis and a thresholding-based technique.
The selected features are validated using the ML algorithm. Based on these experiments, it is found the “internet addiction” prediction is difficult with “internet usage behavior” features as compared to “health” features. Next, ML algorithms (namely random forest, ANN, and C4.5) are compared experimentally. According to results, by only ‘internet usage behavior’ features, the ML algorithms can predict up to 70% accurate ‘internet addiction’. On the other hand, if only “health features” are used, then ML algorithms provide high classification accuracy up to 91%.
In this study, it is found ‘appetite’, ‘fear’, ‘digestion’, and ‘tiredness’ are the most common health issues to identify ‘internet addiction’. Additionally, headache is not an indicator of excessive ‘internet usage’. Moreover, students are commonly feeling ‘life is nothing without the Internet’. Next, based on the relationship between (1) “demographic features” and “health features” and (2) ‘internet usage behavior’ and ‘health features’, it is found that when only “demographic” features are used then we can easily predict the possible health issues. But, when the “behavioral features” and “demographic features” both are used then “demographic features” has low relevance for predicting Internet addiction. In other words, ‘internet addiction’ prediction using “behavioral features” is more appropriate than prediction using “demographic features”.
Finally, ‘internet usage behavior’ features have been selected and the C4.5 decision tree has been used for mining the decision rules. The developed rules can be used to predict ‘internet addiction’ severity levels. According to the rules, the ‘internet usage behavior’ features namely ‘online glued’, ‘feel preoccupied’, ‘life no internet’, and ‘defensive secretive’ has the highest potential to predict the severity level of ‘Internet Addiction’. Based on the calculated rules, it is found:
-
• Internet usage behavior namely ‘online glued’, ‘feel preoccupied’, ‘life no internet’, and ‘defensive secretive’ is not a sign of internet addiction.
-
• Being less ‘defensive and secretive’, but requiring ‘more online time’ and ‘online glued’ is a strong indication of internet addiction. It means the behavior of ‘consuming time online’ without any hesitation and wanting to ‘consume more and more time online’ is a strong indicator of internet addiction.
As the final words, the paper provides an understanding about the relation between ‘Internet Usage Pattern’ and ‘Internet Addiction Severity level’ in terms of rules. These rules describe, which internet usages behavior is harmful for the students after a specific self-assessed value. These rules can be used by students, academicians, and practitioners to understand and identify the harmful internet usages patterns.
Author Contributions Statement
Geetika Johar: Designed the methodology for the work, gathered the data used in research, explored the dataset, analyzed the data, wrote the main manuscript text, prepared the figures, and tables.
Ravindra Patel: Conceptualized the study, developed the theoretical framework, supervised the complete work, revised and reviewed the manuscript.
All authors reviewed the manuscript and agreed to publish this version of manuscript.
Conflict of Interest Statement
On behalf of all the authors, the corresponding author states that there is no conflict of interest to declare that are relevant to the content of this article.
Funding Declaration
This research is not supported by any grant or funding.
Data Availability Statement
The data is available online, which is public and open access [9]
Ethical Declarations
We have used a survey data, which is publically available for conducting experiments. We are not collected any data from any one.
Acknowledgments
The author would like to express sincere gratitude to Dr. Ravindra Patel for valuable guidance and support during the completion of this research work. The author also extends heartfelt thanks to the RGPV, CSE Department, for providing the necessary support and academic environment for conducting this research. The author is also thankful to the experts and reviewers for their valuable suggestions and professional evaluation which helped improve the quality and reliability of this research work.
Declaration of Generative AI in Scholarly Writing
We did not utilized any AI tool during the writing process of this article.
Abbreviations
The following abbreviations are used in this manuscript:
ANN - Artificial Neural Network
BPN - Backpropagation neural
ML - Machine Learning
URL - Uniform Resource Locator
