Investigating the Effect of Implicit Browsing Behaviour on Students’ Performance in a Task Specific Context

Author: Stephen Akuma
Journal: International Journal of Information Technology and Computer Science(IJITCS) @ijitcs
Article in issue: 5 Vol. 6, 2014.
Free access
This paper focuses on how students access web pages in a task specific information retrieval. An investigation on how students search the web for their current needs was carried out and students’ behavioural characteristics as they surf the internet to answer some given online multiple choice questions was collected. Twenty three students participated in the study and a number of behavioural characteristics were captured. Camtasia studio 7 was used to record their searching activity. The result shows that 328 web pages were visited by the students, and among the parameters captured, the time spent on the search task has a stronger correlation with the students’ performance than any other captured parameter. The time spent on a document can be used as a good implicit indicator to infer learner’s interest in a context based recommender system.
Implicit Browsing Behaviour, Task Specific Context, Information Seeking Behaviour
Short address: https://sciup.org/15012076
IDR: 15012076
Text of the scientific article Investigating the Effect of Implicit Browsing Behaviour on Students’ Performance in a Task Specific Context
Published Online April 2014 in MECS
In this paper, we look at the effect of mouse click, time spent on a task, focus change between browser and the online task, query reformulation and website visited on the performance of students. The researcher
-
II. Related Work
The main source of information for students in an academic environment is the internet ([6][7][8][9]). Some students spend long duration browsing the internet while others search specifically for their needs. A good way of understanding students browsing behaviour is by observing their search activities in a given domain. This can be achieved through assessing them in a task specific context to obtain the variety of their implicit behaviour on the web. Multiple Choice Questions (MCQ) approach is one of the ways by which this assessment can be done. Liu et al. [10] say that such task specific approach can be used to evaluate student’s performance as well as model a feedback that can be used for their current activities. Liu used trained past answers of students in an MCQ test to categorize other student’s responses, providing them with an immediate feedback according to their level of knowledge. Alemán [11] designed an automated MCQ assessment process to show how it can improve students’ programmable ability. Task specific assessment can also be used for experimental purposes to group students according to their performance and behavioural characteristic.
One of the challenges in information retrieval is to understand what an ordinary user expects from an information retrieval system. Most students usually spend long duration of time searching the internet with no relevant information [12]. This might be as a result of general searching of the internet with no defined searching plan. Such general search often leads to massive retrieval of irrelevant resources [13]. Chapman and Ivankovi [9] conducted a study on the use of the internet as search tool. They found out that users of the internet first browse the websites then follow links; most of them end up not getting their desired needs. Different factors affect students’ ability to obtain relevant information for their current activities. George et al. [13] listed these factors as people, convenience, speed of the internet, course requirement, Internet, knowledge of service and sources. Zhu et al. [2] suggested browsing time, saving operation, colleting operation, and printing operation as features that influence browsing behaviour. Since users have different implicit behaviour, researchers are working on the possibility of obtaining the best user implicit behaviour that can be promising enough to predict users’ intention and for the development of a recommender system ([14][15][16][17]).
-
III. Methodology
The goal of the study was to investigate students’ browsing behaviour as well as to find out how their behavioural characteristics affect their performance in a task specific context. The study was carried out in a controlled environment. 23 students of Coventry University which include undergraduate, Masters and PhD students participated in the experiment. They were given an introduction to the experiment by the researcher. This was followed by a brief tutorial.
The experiment was an automated observation of user behaviour using Camtasia Studio 7 screen recording software. The participants were given 11 online MCQ task in the area of Internet security to freely surf the internet and answer them [24]. The researcher allowed the participants to search the internet as they normally do. They were allowed to use any search engine of their choice and input whatever query of their choice. The only restriction was that they were not allowed to get information relating to the search task from anybody. The online MCQ task was designed using Question Writer 4 software. Firefox web browser was used for the search process. The Camtasia Studio 7 screen recording software was run simultaneously with the Question Writer 4 software during the experiment. A time limit of one hour was given to each of participant to complete the task. If a participant finishes the task before the time limit, he was to say it loudly that he has finished. During the experiment, the following parameters were captured in one user session by the Camtasia Studio 7 video clip for each user: the number of mouse click(s), the time spent in answering the online question (dwell time), the number of times a query was reformulated (QR), the number of websites visited (NW), the change of focus between the browser and the working environment (CF). After the experiment, the participants were asked to state their level of satisfaction in finding relevant information and the level of difficulty in finding the relevant information.
-
IV. Results
-
4.1 Performance versus Dwell Time
This section presents the result obtained from the participant session analysis. Section IV is sub divided into 5 subsections: 4.1 is on dwell time and its correlation with the students’ performance. 4.2 is on mouse click and its correlation with students’ performance, 4.3 is on change focus and students’ performance, 4.4 is on Query Reformulation and students’ performance, 4.5 is on Number of websites visited and students’ performance. Table 1 shows the general performance of all the participants in the study. Table 2 shows the level of the participants (P) satisfaction and how the Observer (O) perceived the participants to be satisfied in the task. Table 2 also shows the participants (P) level of difficult in finding relevant information and what the Observer (O) felt about the participants after watching the video.
Correlation of Coefficient was used in analysing the relationship that exists between the participant’s performance and their captured behavioural characteristics. The Correlation of Coefficient is given by:
|
р = |
^xy ^CX Syy |
(1) |
|
S' ° XX |
= ^2 .0^ n |
(2) |
|
Syy |
= Zy2-^ |
(3) |
|
S' иху |
= Z ^ — (^ |
(4) |
Where x, y in equation (1, 2, 3, and 4) are two given data pairs, the Sigma symbol represents summation and n is the total number of data points.
The time spent by each participant during the task was captured by Camtasia studio 7. Table 3 shows the Computation of the correlation coefficient between time and performance (score). Variable x represents the time spent during the task and variable y represents the score. The result shows a correlation (though weak) between students’ performance and the time spent on the task. Fig. 1 shows the distribution of the performance against the dwell time.
Table 1: The general performance of all the participants in the study
|
Participants |
Time(min |
NW |
FC |
QR |
Score |
|
Participant 1 |
36.6 |
28 |
70 |
11 |
80 |
|
Participant 2 |
40 |
26 |
72 |
72 |
50 |
|
Participant 3 |
29.5 |
10 |
76 |
6 |
30 |
|
Participant 4 |
22.4 |
10 |
30 |
0 |
90 |
|
Participant 5 |
16 |
7 |
38 |
4 |
20 |
|
Participant 6 |
36.3 |
18 |
108 |
7 |
70 |
|
Participant 7 |
16.1 |
9 |
28 |
1 |
90 |
|
Participant 8 |
51.7 |
16 |
56 |
5 |
30 |
|
Participant 9 |
15.63 |
19 |
40 |
2 |
40 |
|
Participant 10 |
32.57 |
15 |
81 |
1 |
40 |
|
Participant 11 |
20.52 |
12 |
64 |
4 |
40 |
|
Participant 12 |
5 14 |
7 |
20 |
0 |
30 |
|
Participant 13 |
37.34 |
26 |
193 |
20 |
30 |
|
Participant 14 |
31.49 |
16 |
80 |
2 |
70 |
|
Participant 15 |
24.09 |
16 |
78 |
3 |
40 |
|
Participant 16 |
11.68 |
5 |
20 |
1 |
30 |
|
Participant 17 |
43.35 |
18 |
112 |
12 |
80 |
|
Participant 18 |
37.79 |
12 |
32 |
7 |
50 |
|
Participant 19 |
7.17 |
2 |
8 |
0 |
40 |
|
Participant 20 |
26.23 |
17 |
78 |
11 |
30 |
|
Participant 21 |
29.78 |
21 |
54 |
9 |
30 |
|
Participant 22 |
23.37 |
77 |
82 |
12 |
60 |
|
Participant 23 |
49.76 |
13 |
98 |
10 |
70 |
|
level of satisfaction |
Level of difficulty |
||||||
|
High |
Medium |
LOW |
High |
Medium |
Low |
||
|
1 |
p, o |
P, О |
|||||
|
2 |
P, o |
p, o |
|||||
|
3 |
p |
О |
p, о |
||||
|
4 |
P, о |
О |
p |
||||
|
5 |
p |
о |
о |
p |
|||
|
6 |
P, о |
p |
о |
||||
|
7 |
P, о |
P, о |
|||||
|
8 |
p |
о |
P, о |
||||
|
9 |
p |
о |
p |
о |
|||
|
10 |
P, о |
p |
о |
||||
|
11 |
Р, о |
P, о |
|||||
|
12 |
p |
о |
P, о |
||||
|
13 |
p |
о |
p |
о |
|||
|
14 |
P.O |
p |
о |
||||
|
15 |
P, о |
P, о |
|||||
|
16 |
p |
о |
p |
о |
|||
|
17 |
P, о |
P, о |
|||||
|
18 |
p |
о |
p |
о |
|||
|
19 |
p |
о |
p |
о |
|||
|
20 |
p |
о |
p |
о |
|||
|
21 |
p |
о |
P, о |
||||
|
22 |
P, о |
P, о |
|||||
|
23 |
P, о |
P, о |
|||||
Table 3: Computation of correlation coefficient between Dwell Time and students’ performance
|
Participants |
Score |
Time |
Хл2 |
Ул2 |
x*y |
|
(У) |
|||||
|
Participant 1 |
80 |
36.6 |
6400 |
1339.56 |
2928 |
|
Participant 2 |
50 |
40 |
2500 |
1600 |
2000 |
|
Participant 3 |
30 |
29.5 |
900 |
870.25 |
885 |
|
Participant 4 |
90 |
22.4 |
8100 |
501.76 |
2016 |
|
Participant 5 |
20 |
16 |
400 |
256 |
320 |
|
Participant 6 |
70 |
36.3 |
4900 |
1317.69 |
2541 |
|
Participant 7 |
90 |
16.1 |
8100 |
259.21 |
1449 |
|
Participant 8 |
30 |
51.7 |
900 |
2672.89 |
1551 |
|
Participant 9 |
40 |
15.6 |
1600 |
244.297 |
625.2 |
|
Participant 10 |
40 |
32.6 |
1600 |
1060.81 |
1302.8 |
|
Participant 11 |
40 |
20.5 |
1600 |
421.07 |
820.8 |
|
Participant 12 |
30 |
5.14 |
900 |
26.4196 |
154.2 |
|
Participant 13 |
30 |
37.3 |
900 |
1394.28 |
1120.2 |
|
Participant 14 |
70 |
31.5 |
4900 |
991.62 |
2204.3 |
|
Participant 15 |
40 |
24.1 |
1600 |
580.328 |
963.6 |
|
Participant 16 |
30 |
11.7 |
900 |
136.422 |
350.4 |
|
Participant 17 |
80 |
43.4 |
6400 |
1879.22 |
3468 |
|
Participant 18 |
50 |
37.8 |
2500 |
1428.08 |
1889.5 |
|
Participant 19 |
40 |
7.17 |
1600 |
51.4089 |
286.8 |
|
Participant 20 |
30 |
26.2 |
900 |
688.013 |
786.9 |
|
Participant 21 |
30 |
29.8 |
900 |
886.848 |
893.4 |
|
Participant 22 |
60 |
23.4 |
3600 |
546.157 |
1402.2 |
|
Participant 23 |
70 |
49.8 |
4900 |
2476.06 |
3483.2 |
|
Sum |
1140 |
645 |
67000 |
21628.4 |
33441.5 |
Sxx = 67000 –(1140 × 1140)/23 = 10495․65
Syy = 21628․39 – (644․51 × 644․51)/23 = 3567․82
Sxy = 33441․5 – (1140 × 644․51)/23 = 1496․22
The correlation coefficient
= 1496․22/√((10495․65 × 3567․82) ) = 0․24451
Performance vs Time spent 90 80 70 60 о 50 40 30 20
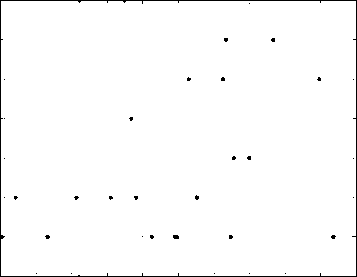
5 10 15 20 25 30 35 40 45 50 55
Time
Fig. 1: Distribution of time spent on a task, plotted against the students’ performance (score)
-
4.2 Performance versus Mouse Click
The mouse clicks represents only the clicks when the mouse is in the browser window. The mouse is said to be outside the browser when it is in the Question Writer 4 interface. All the participants mouse clicks were captured in one session during the experiment. Fig. 2 shows the mouse clicks distribution against the performance. The mouse click is next to dwell time in terms of correlation with the performance. It has a correlation coefficient of 0.2399.
-
4.3 Performance versus Focus change
The focus change or change focus is the number of time the participant switches his view between the online quiz and the browser. The researcher hypothesized that users who change focus quickly do so because of the complexity of the task or questions. It has a weak correlation of 0.0618 with the performance. Fig. 3 shows its distribution against the performance. The conclusion is that focus change does not really affect the students’ performance.
-
4.4 Performance versus Query Reformulation
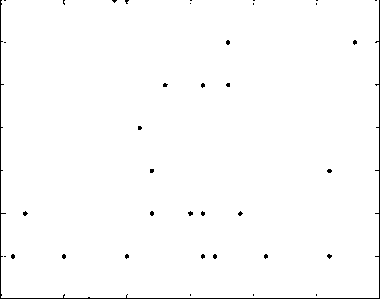
The query reformulation is the number of times a query is retyped in an attempt to answer each of the given questions in the online quiz. It has the weakest correlation with the students’ performance. The correlation coefficient between the query reformulation and the performance is 0.0122. A conclusion can be made that the number of times a query is reformulated has no effect on the students’ performance. Fig. 4 shows the number of query reformulation distribution against the performance.
Performance vs Focus Change 90 80 70 60
20 0 20 40 60 80 100 120 140 160 180 200
FC
Fig. 3: Distribution of the focus change, plotted against the students’ performance (score)
Fig. 2: Distribution of mouse clicks, plotted against the students’ performance (score)
QR
Fig. 4: Distribution of the number times queries were reformulated during the task, plotted against the students’ performance (score)
-
4.5 Performance versus Number of websites visited
The websites visited by each of the participants were extracted from the log history of Firefox browser. The log was cleared immediately a participant finishes his/her task. Students searching for information for their needs mostly visit Wikipedia online free-content encyclopaedia and they do not go beyond the first page of search engine result page [24]. This affects the quality of their result. In such a case, it is normally better for the user to input the best query. The correlation coefficient between the number of websites visited and the students’ performance is 0.1635. This is obviously very weak. Fig. 5 shows a distribution of number of websites visited against the performance.
Performance vs Number of website visited 90 80 70 60
0 5 10 15 20 25 30
NW
approach because relevant information can easily be obtained without installing any software at the client side. The server side data usually extracted include: user login/log out time, page reference (URL), I.P address, date and time stamp. Its disadvantage is that a restriction is placed on users without login details. Another disadvantage is that user navigation of web pages is limited.
An alternative to server side data collection is browser side approach. In this approach, data is collected implicitly from users as the browse the web in a natural way. The challenge in this approach is that there are no standard methods to determine how user’s activities on the web relate to their interest. It is important to determine those good implicit features that will indicate that a particular user activity is relevant to the user. In this paper, the researcher studied how some of the chosen implicit indicators correlate with students’ performance in a context specific task. The result shows that the time spent while performing a task is a key factor that can determine students’ performance and an indication of their interest in a web document.
The finding of this study implies that time spent (dwell time) on a document can be used as a good indicator of relevance to develop a recommender system based on implicit rating. Since the correlation of dwell time alone with students’ performance is not very strong, a new approach will be employed by combining dwell time and other implicit indicators of interest.
Fig. 5: Distribution of the number of websites visited, plotted against the students’ performance (score)
-
V. Discussion
With the volume of documents increasing day by day on the internet, users of the internet can easily get ‘lost in hyperspace’. Hearst [25] used three theoretical models of standard, Cognitive and Dynamic ways to explain the reason for the differences in user’s information seeking behaviour. Most users search dynamically; they start with a particular goal in mind then switch to another goal as the intensity of the search process increases. In most cases, they forget their initial goal. A possible way of keeping the user on track towards his/her initial goal is by understanding his/her implicit interest in a specific context and suggesting appropriate recommendations. The sharp differences in some of the participants’ scores as shown in result can be attributed to the difference in cognitive ability and knowledge base of the participants with regards to the current context.
To offer help to users via recommendation, we must understand how the user seek for information and how to represent the user’s interest. The system should also be able to remember and learn from previous interaction to improve its recommending strength.
Most analysis of user web data have been server-side based. Commercial websites use the server side
-
VI. Conclusions
This paper evaluates user implicit behavioural features in a task specific context and how they can affect students’ academic performance. Data was collected form 23 participants. The students’ behavioural characteristic examined in relation to the their performance were the number of mouse click(s), the time spent in answering the online question (Time), the number of times a query was reformulated (QR), the number of websites visited (NW), the change of focus between the browser and the working environment (CF). Among these features, the time spent on the task has a stronger correlation with students’ performance (score). It has the highest correlation coefficient of 0.24451 with the students’ scores. Next to the dwell times in terms of correlation is the mouse clicks, with a correlation coefficient of 0.2399. Though these correlations are not very strong, it however shows that the dwell time and mouse clicks are important factors in determining the performance of online searchers.
Future work will look at some limitations in this research. For instance, the capturing software used was not fully automated. Some of the parameters like Query reformulation, mouse clicks and focus change were manually extracted from the Camtasia studio 7 recorder. This possibly added noise to the data. The next phase of this research is the development of a framework for a context based recommender system which will use intelligent techniques to obtain homogenous group patterns based on the correlation of multiple implicit indicators. Feedback will be based on user profile and the ‘weight of interest’ assigned to the web pages they visit. Other implicit behavioural features like scroll movements, keystroke, printing, saving, bookmarking and eye gaze will also be captured and analysed.
Acknowledgement
I wish to thank my supervisor Dr. Rahat Iqbal for his direction and encouragement.
References Investigating the Effect of Implicit Browsing Behaviour on Students’ Performance in a Task Specific Context
- Brusilovsky, P., Tasso, C. “Preface to Special Issue on User Modeling for Web Information Retrieval User Model”, User-Adapt. Interact., 2004, Vol. 14, No. 2-3, pp. 147-157.
- Zhu, Z., Wang, J., Chen, M., Huang, R. “User interest modelling based on access behavior and its application in personalized information retrieval”, Proceedings of 3rd International Conference on Information Management, Innovation Management and Industrial Engineering, IEEE Conference Publishing Services, November 2010, 26-28, pp.266-270.
- Claypool M., Le P., Wased M., David Brown Implicit interest indicators, Proceedings of the 6th international conference on Intelligent user interfaces, p.33-40, Santa Fe, New Mexico, United States January 2001
- Vakkari, P. “Task-based information searching”. Annual Review of Information Science and Technology, 2003, 37, 413-464.
- Kim, H. & Chan P. Implicit Indicators for Interesting Web Pages, in WEBIST 2005 - 1st International Conference on Web Information Systems and Technologies, Proceedings, 2005, pp. 270-277.
- Ajiboye, J. & Tella, A. “University Undergraduate Students’ Information Seeking Behaviour: Implications For Quality In Higher Education In Africa”. The Turkish Online Journal of Educational Technology – TOJET 2007, 6(1), 40-54
- Owolabi, K., Jimoh, M., Okpeh S., Information Seeking Behaviour of Polytechnic Students: The Case of Akanu Ibiam Federal Polytechnic, Unwana Nigeria, Library Philosophy and Practice, 2010
- Siddiqui, S. “Information Seeking Behaviour of B.Tech. and M.B.B.S. Students in Lucknow: A Comparative Study”. Journal of Library & Information Science 2011, 1(1), 55-70
- Chapman, L. and Ivankovic, H. “Russian roulette or pandora’s box: Use of theInternet as a research tool”. A paper presented at VALA 2002 – e-volvinginformation futures. 11th Biennial Conference and Exhibition, Melbourne.
- Liu, P., & Wu, I. “Collaborative relevance assessment for task-based knowledge support”. Decision Support Systems, 2008, 44(2): 524-543
- Alemán, J. “Automated Assessment in a Programming Tools Course”. IEEE Trans. Education, 2011, 54(4): 576-581
- Junni, P. “Student seeking information for their Master’s thesis – the effect of the Internet”. Information Research, 2007, 12(2)
- George, C., et al. “Scholarly use of information: graduate students' information seeking behavior”. Information Research, 2006, 11 (4).
- Iqbal, R., Grzywaczewski, A., James, A., Doctor, F., Halloran, J. “Investigating the value of retention actions as a source of relevance information in the software development environment”. Proceedings of the IEEE 16th International Conference on Computer Supported Cooperative Work in Design, 2012, pp 121-127
- Liu, D., Tao, Q. “Hybrid Filtering Recommendation in E-Learning Environment”. Second International Workshop on Education Technology and Computer Science, 2010
- Tankano, K. & Li, K. “An Adaptive Personalized Recommender based on Web-Browsing Behavior Learning”. International Conference on Advanced Information Networking and Applications Workshops 2009
- Lee, S., Palmer-Brown, D. & Draganova, C. “Diagnostic Feedback by Snap-drift Question Response Grouping”, In proceedings of the 9th WSEAS International Conference on Neural Networks (NN'08), 2008, pp 208-214.
- Nichols, D. M. “Implicit Ratings and Filtering”. In Proceedings of the 5th DELOS Workshop on Filtering and Collaborative Filtering, Budapaest Hungary, ERCIM 1997, pp 10-12.
- D. Oard and J. Kim. “Implicit feedback for recommender systems”. In Proceedings of the AAAI Workshop on Recommender Systems. 1998
- Morita, M. & Shinoda, Y. “Information Filtering Based on User Behaviour Analysis and Best MatchText Retrieval”. In Proceedings of SIGIR Conference on Research and Development, 1994, pp 272 - 281
- Kellar, M., Watters, C., Duffy, J., and Shepherd, M. “Effect of Task on Time Spent Reading as an Implicit Measure of Interest”. In Proceedings of the 67th American Society for Information Science and Technology (ASIS and T) Annual Meeting, 2004, 41, pp. 168–175
- Liu C., Liu J., Belkin N., Cole M., Gwizdka J. “Using dwell time as an implicit measure of usefulness in different task types”. Proceedings of the American Society for Information Science and Technology 2011, 48:1–4.
- Huang, J., White, R., Buscher, G., & Wang, K. Improving searcher models using mouse cursor activity. In SIGIR. ACM 2012
- Akuma, S. and Iqbal R. “Investigation of Students’ Information Seeking Behaviour”. International Journal of Advanced Research in Computer Science and Software Engineering. 2012, 2(12): 28-35
- Hearst M. “Search User Interfaces”. Cambridge University Press, 2009.
