Investigation of Student Dropout Problem by Using Data Mining Technique

Author: Sadi Mohammad, Ibrahim Adnan Chowdhury, Niloy Roy, Md. Nazim Hasan, Dip Nandi
Journal: International Journal of Education and Management Engineering @ijeme
Article in issue: 5 vol.13, 2023.
Free access
Throughout the past twenty years, we've seen a huge increase in the number of school universities. Given the intense competition among major universities and schools, this attracts students to apply for admission to these institutions. Early school dropout prediction is a critical problem for learners, and it is hard to tackle. And a wide number of factors can impact student retention. In order to attain the best accuracy, the conclusion of the program, the standard classification approach that was used to solve this problem frequently needs to be applied the majority of organizations and courses launched by universities operate on either an auto model, therefore they always prefer course enrollment over student caliber. As a result, many students stop taking the course after the first year. In order to manage student dropout rates, this research provides a data mining application. The predictive model may provide an effective predictive list of students who typically require the greatest help from the student dropout program given updated data on new students. The results indicate that the object classification algorithm Random Forest data mining technique can create a reliable prediction model using existing student academic data. Future research on student dropout rates will continue to be vital for informing policy decisions, identifying at-risk populations, evaluating interventions, enhancing support services, predicting trends, understanding long-term consequences, and promoting global learning and collaboration in education.
Data-Mining, Machine Learning (ML) Algorithms, k-fold cross-validation, Dropout, Predictive Models, Systematic Literature Mapping (SLM)
Short address: https://sciup.org/15018676
IDR: 15018676 | DOI: 10.5815/ijeme.2023.05.04
Text of the scientific article Investigation of Student Dropout Problem by Using Data Mining Technique
A method known as data mining is used to spot trends, linkages, and changes in variables in databases and to explain how information is found. Techniques including statistics, mathematics, AI, and ML, may be used to evaluate the relationships discovered because they enable people to uncover and extract more data and knowledge than a straightforward analysis and querying method.
Dropout is a serious issue that affects educational institutions all around the world. To understand the causes of students stopping their studies, a lot of research has been done. The definition of a dropout is disputed, but in this study, it is defined as students who stop their studies and do not finish with their cohorts for whatever reason (course transfer, registration lock, financial hardship, family issues, etc.). A literature review identified a number of criteria for determining the relative impact of student dropout. These factors were then roughly divided into three categories: Personal reasons, Financial Crisis, and Program/course-related reasons. Given that one-fourth of students drop out of college or university after their first year, it is challenging to avoid student dropouts [1,2]. Current research indicates that intervention programs significantly affect dropout rates, especially in the first year. It is ideal to identify the kids who typically require help the most in advance so that the limited support resources for the intervention programs may be used as efficiently as possible. The major objective is to use data mining techniques to pinpoint the children who most drop out after their first year in school, they have a higher likelihood of leaving. In this study, student dropout data from prior years are analyzed using the categorization job. The Naive Bayes, KNN, Decision tree, Random Forest, and Logistic Regression approaches are employed in this study due to the wide variety of data categorization strategies.
Five sections make up the paper, which is arranged in the following order: The introduction is in part 1, followed by a brief summary of the overall picture of the face-to-face student dropout rate-related work and its issues in section 2, an analysis of the data collected, a comparison, and this paper's findings in section 3, a discussion of the results in section 4 and the conclusion in the final section 5.
2. Related Works
Dropout is a major problem that affects educational institutions all around the world [3]. The term "dropout" has no commonly recognized definition, however, it is generally understood to refer to students who leave their studies before their cohorts do for any reason (course transfer, registration locking, etc.) [4]. Retention is also a notion that may be thought of from the perspective of the student (in this case, it is called persistence) [5], and it refers to the student's drive to fulfill their academic objectives, first and foremost getting a degree. Students who quit college before completing their planned goals may be referred to as dropouts. Student drop-out or retention is a major issue for schools, university administrators, and instructors but is not an easy issue to solve. Since it has the potential to have a negative impact if there is a high student attrition rate. In addition to having an adverse impact on the students themselves, universities with high attrition rates suffer large losses in tuition, fees, and potential alumni gifts. Educational Statistics report says college dropouts are more likely than their more successful counterparts to have lower lifetime earnings. The research that is now available has revealed factors that may have an impact on how long online students are able to remain enrolled. From previous research papers four possible predictors have been collected such as:
1. Demographics, such as gender, race, place of residence, and manner of life (on or off campus) [6]
2. The combined SAT and ACT scores, high school GPA, and high school percentile rank are used as indicators of pre-college academic achievement. [7]
3. Enrollment: The proportion of time spent during the sophomore year earning credits from online courses. [8]
4. Success in the classroom: Freshman Stepwise logistic regression is a frequent technique for deciding which variables to include in a retention prediction model. A significant amount of data is frequently used in institutional analysis. This study is not an anomaly. [9]
3. Data Collection and Analysis
According to a published paper [10] in March 2007, Data mining methods may be used to forecast retention rates. For this experiment, two datasets are created by keeping track of ongoing enrollment and follow-up, respectively. 2005 enrolment at Arizona State University after a 2003 first-year dropout (ASU). Data mining with a retention emphasis 5. The dependent variable, which is dichotomous and retained, has four potential groups. From a group of 189 students who registered for the online information technologies certificate program between 2007 and 2009, Yukselturk et al.'s [11] proposal to apply data mining methods in an online curriculum was picked. The data was gathered using questionnaires that were completed online. Predictors include demographic variables including gender, race, residency, and on- or off-campus location. The sample size was substantial. They used stepwise regression, although it has been established that this approach is inappropriate for creating models. According to the current state of college students' innovation and entrepreneurship as well as the current state of the innovation and entrepreneurship education system in colleges and universities, Liu et al.'s [11,12] analysis of the practical issues with college students' education in innovation and entrepreneurship was based on both of these factors. In order to study the aspects related to retention by taking pattern recognition into consideration, classification trees are used in data mining. To map the issue of school dropouts in the actual world, see a different article, the approach used was either CRISP-DM, SEMMA, or KDD (structured strategy of detecting valid, useful, and intelligible patterns from large and complex data sets). They considered data gathering, pre-processing, pattern extraction from the data, and post-processing (validation). To find and evaluate the primary studies that are accessible in the literature to answer particular study questions, Systematic Literature Mapping was carried out [13]. They used different types of techniques to find the reason. They used postprocessing steps to validate the extracted patterns from the result. They observed early dropouts can occur at different levels of education, but higher levels stood out. The potential cause of this problem students are unable to pay the increased tuition, which wastes money that could have been used to assist their education. Students from other cities could take longer to travel back and forth between home and college, which has an impact on their academic performance. Additionally, some kids live alone and are not supported emotionally by their parents because of this. Last but not least, students who live off-campus may occasionally lack direct access to university facilities like computer laboratories or libraries. As a result, they have a lower retention percentage than students who reside on campus. From the previous research with the use of a decision tree, they were able to calculate that 99.9% of students with GPAs below 3.57 drop out of school. Additionally, the GPA varies from 3.27 to 3.55, the variable Failed SE is equal to or lower than 1, and there is a significant likelihood (80%) that students would quit the institution. Earlier data mining was used to find out the retention rate but it was not possible to get the accurate reason for retention through data mining.
There are two techniques for dealing with student dropout issues. The first one is Survey- Based and the other one is Data-Driven. From the Survey Base technique, Tinto [2] built theoretical models. Analytical methods are used to study institutional data in data-driven research. The theoretical model is Tinto's, which is commonly used in research on student retention. Tinto's study on student dropouts is directly related to social integration at the university level. In contrast in analytical solution Data mining is widely used now. In addition, a number of statistical techniques have been used to predict student dropout rates. Prediction models are produced at each step (from 0 to N-1), utilizing all of the easily accessible student information, using a specific classification approach, according to past research. They applied Interpretable Classification Rule Mining rather than standard categorization methods. Then, for better results, they can assess the performances of various categorizations. The method can discover precise categorization models using IF-THEN rules at the end of each phase. Using SMO, they found that students in their fourth semester have a high risk of dropping out (83.22%), while the ultimate forecast following the seventh and final semesters is 91.11%. At the conclusion of the research, a 99.8% accuracy rate produces by the Interpretable Classification Rule Mining 2 algorithm. And a 99.8% accuracy rate when compared to these other methodologies. Discriminant analysis and logistic regression are only two of the techniques used in various studies to determine the student dropout rate [9].
In this research, we applied KNN, Naïve Bayes, Decision tree, Random Forest, and Logistic Regression classification technique.
Table 1. The list of data mining methods that are frequently applied in the student dropout problem
|
Classification Technique |
Summary |
|
Naïve Bayes |
According to the Bayes theorem the likelihood of an event occurring is determined by multiplying the prior probability of the occurrence by the likelihood of the event occurring under certain circumstances [13,14]. This theory serves as the foundation for the supervised machine learning method known as Naive Bayes. Regarding Naive Bayes, the algorithm uses the probability of a certain class (e.g. dropped or not dropped) to classify a new data point. The algorithm calculates the probability of a given class for a given set of features (e.g. words in a dropout rate) and then classifies the data point with the highest probability. The "Naïve" part of the algorithm comes from the assumption that all features in a dataset are independent of each other [13]. This is a strong assumption that is rarely met in real-world data, but it allows the algorithm to make predictions quickly and with relatively high accuracy. |
|
K-Nearest Neighbors (KNN) |
The supervised machine learning method K-Nearest Neighbors (KNN) is used for classification and regression. [14]. It is based on the idea that comparable data points tend to have the same class or value. The KNN algorithm works by taking a new data point and finding the K number of data points in the training set that is closest to it (in terms of some distance metric, such as Euclidean distance). The algorithm then assigns the class or value that is most common among those K nearest neighbors to the new data point. The key benefit of KNN is that it is an easy-to-understand algorithm [15]. Furthermore, no assumptions about how the underlying data are distributed are required. One of KNN's main limitations is that it may be computationally expensive, especially for large datasets. It also requires a significant amount of memory to save the entire training set [16]. The best value of k may be chosen using strategies like cross-validation. |
|
Decision Tree |
A supervised machine-learning technique known as a decision tree is employed in applications for classification and regression [15]. It is a tree-based model [17] that is used to make predictions by recursively partitioning the input space into smaller regions. The leaf nodes of the tree indicate classes or values, and the core nodes represent characteristics. The training data is continually split up into the features that yield the most information gain, and this process creates the tree. Repeating the data splitting process until a stopping condition [18], such as a maximum depth or a minimum number of samples per leaf, is met. Decision trees are simple to comprehend and interpret. and can handle both continuous and categorical data. They are also capable of handling feature interactions and may be utilized for feature selection. Decision trees have a number of drawbacks, including the potential to overfit the training set of data if the tree is allowed to grow too deep. This can be mitigated by using techniques such as pruning or by using ensemble methods like random forests. Decision trees can be used for both classification and regression. Algorithms like ID3, C4.5, and CART are used to create a decision tree [19]. |
|
Logistic Regression |
Statistically, the relationship between a binary outcome variable one that can only have one of two values, like "yes" or "no" and one or more predictor variables is examined using logistic regression. It is a well-liked method for modeling binary classification issues in data analysis and machine learning. Given the values of the predictor variables, the aim of logistic regression is to estimate the likelihood that the binary outcome variable will take on one of the two possible values. The predictor variable values are converted into a probability between true and false using a logistic function in the logistic regression model. Because it is a simple process to use and interpret, beginners frequently choose logistic regression. Logistic regression can handle interactions between and among categorical and continuous predictor variables [20]. Real-time applications can benefit from the quick training of logistic regression on large datasets. Because it can only model binary outcome variables, logistic regression may not be appropriate for all problems. It's possible that the relationship between the predictor variables and the outcome variable is not always linear, which is what logistic regression assumes. If the dataset is too small or the model is too complex, logistic regression models risk overfitting the training data. |
|
Random Forest |
For both classification and regression tasks, the well-liked machine learning algorithm random forest is used. To create a more precise and reliable model, this ensemble learning technique combines different decision trees. Using portions of the training data and randomly choosing features for each tree, a random forest builds multiple decision trees. To create the final prediction, the predictions from each tree are then averaged or combined through voting. It is an effective and flexible algorithm that can accurately handle large and complicated datasets. This algorithm is strong and does well with missing data and outliers. There is no need for pre-processing or scaling because it can handle both categorical and continuous variables [21]. The computational cost of a random forest can be high, particularly when there are many trees and large datasets [21]. When there are many trees in a random forest, it can be challenging to interpret the results. Its sensitivity to distracting or irrelevant features may cause it to perform less accurately. |
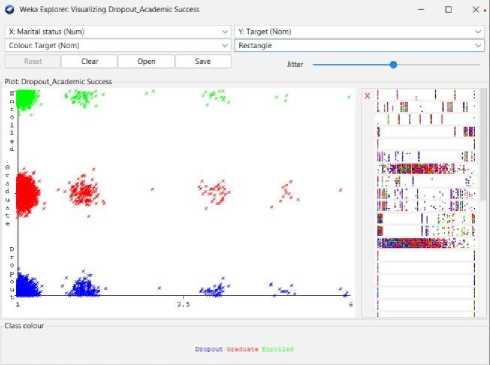
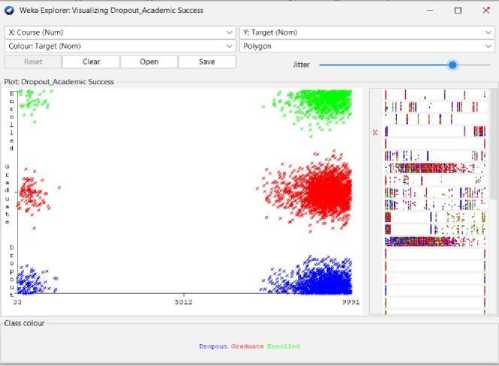
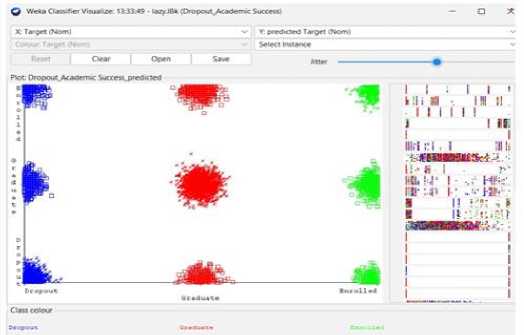
Fig. 1. Students' dropout and academic success scatter view from Weka-3.8.6 visualization
This dataset provides an accurate overview of enrolled students in different undergraduate programs at schools, colleges, and universities. It contains information on demographics, socioeconomics, and academic achievement that may be used to examine potential predictors of student dropout and academic success.
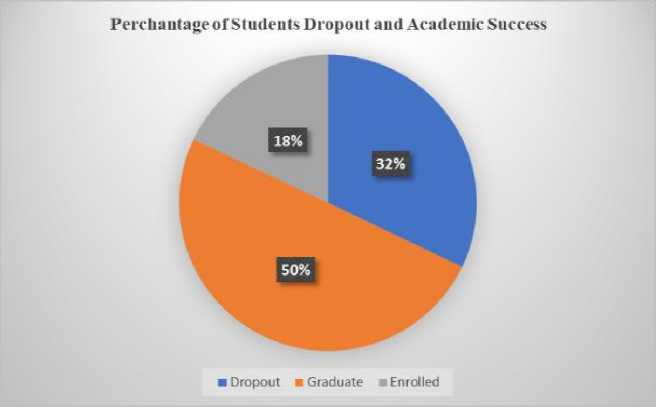
Fig. 2. Percentage of students' dropout and academic success
This dataset contains multiple disjoint databases consisting of relevant information available at the time of enrollment, such as application mode, relational status, the course chosen, and more. This information may also be used to estimate overall student success at the end of each semester by looking at the number of curricular units credited/enrolled/evaluated/approved together with the grades assigned to each. Finally, we have the region's unemployment rate, inflation rate, and GDP, which can help us further understand how economic factors play into student dropout rates or academic success outcomes. In order to pursue employment in a range of sectors, such as agronomy, design, education, nursing, journalism, management, social service, or technology, students may choose to continue their studies or discontinue them for a variety of reasons.
Table 2. Student-Related Variables from Dataset
|
Variable |
Value Type |
Description |
Possible Values |
|
Course |
Nominal |
Student Courses |
{CS, IT, ME, EEE, ECE, EIE, BBA, Arch, Civil} |
|
Status |
Nominal |
Student |
{Yes, No} |
|
Attendance |
Nominal |
Student Attendance |
{Daytime, Evening} |
|
Gender (Sex) |
Nominal |
Student Sex |
{Male, Female} |
|
Relationship status |
Nominal |
Marital status |
{Yes, No (single)} |
|
Nationality |
Nominal |
Birth Place |
{Local, Foreign} |
|
Application mode |
Nominal |
Drop Application |
{Yes, No} |
|
Category |
Nominal |
Students category |
{School, High School, University} |
|
Previous qualification |
Nominal |
Student Qualification |
{Primary school, high school, undergraduate} |
|
Education Level |
Nominal |
Educational Enrollment Status |
{1 st , 2 nd , 3 rd, . , final Semester, year, class} |
|
Occupation |
Nominal |
Parents Occupation |
{Father occupation, Mother occupation, None} |
|
Tuition |
Nominal |
Tuition Fees are up to date |
{Yes, No} |
|
Scholarship |
Nominal |
Academic Scholarship |
{Full, Partial, No} |
|
Target |
Nominal |
Expected or resulted property |
{Dropout, Graduate, Enrolled} |
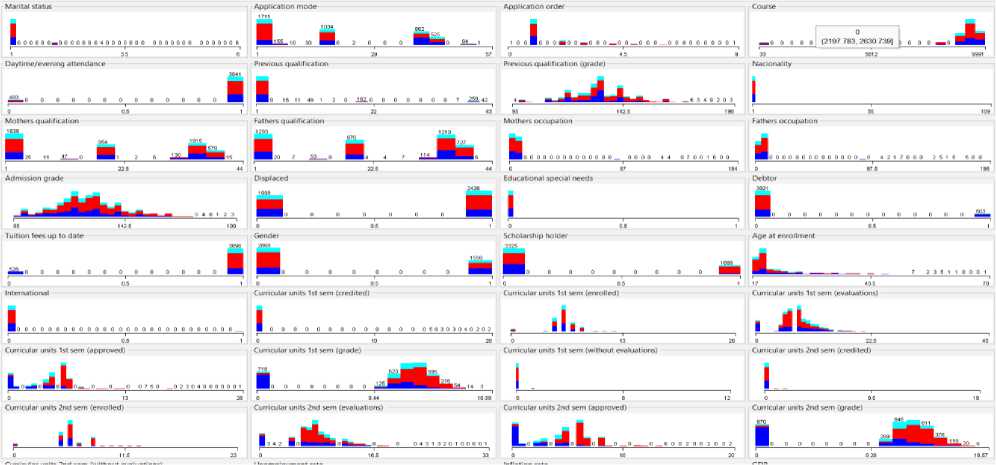
Fig. 3. Visualization of the Student’s Categorization data from Weka tools
Table 3. The list of classifier rules that are frequently applied in the student dropout problem
|
Classifier Rules |
Summary |
|
Classification |
Machine learning supports all classification approaches. Each dataset is categorized using these approaches into predetermined classifications. Decision trees, statistics, linear programming, and other mathematical methods resembling neural networks are used to categorize database information [22]. We make an effort to explain the classification issue using a practical example. Let's use a university as an example, where numerous students are enrolled. We can use classification algorithms to predict which students will leave school soon. We can also classify different students according to their performance in their studies [23,24]. |
|
Clustering |
Clustering is used to make clusters of comparatively similar instances or observations. A cluster of things is comparable to one another [24]. Furthermore, they are unattached to anything outside of the clusters. Let's use an example of a university with huge student enrollment. According to their characteristics, such as their course, grade, activity, age, gender, and whether [25] they are from a rural or urban area, various students can be grouped. With this, we can provide different types of facilities to different clusters according to their specific requirement. |
|
Prediction |
The value of an unknown property can be predicted with the help of a known attribute [23,25]. Using these methods, we may predict the student's future learning choices. These methods may be applied to evaluate a student's performance in the near future using academic data. Based on the student's prior performance on sessional tests, we may also forecast their outcomes [26]. In this case, Course marks are variables that are independent of the result. |
|
Association Rule mining |
It is well-known and leading technique in data mining. With this technique we can find the hidden patterns between different attributes of a single dataset. This technique is also known as relational data mining technique. The primary use of it is in market-basket analysis. In educational context, it is used to find the association between different attributes of the students by which the performance affects [26]. P. Sunil Kumar, D. Jena et al presented “Mining the factors affecting the high school dropouts in rural areas”. In this paper author considered seven different attributes to find out the relationship between attribute which affect the student to drop out. In his analysis, they found that the students who are not interested in the study are mostly going to be school dropout as compared to the teaching environment and poverty. They also tried AV analysis, Correlation and, conviction analysis and found that poverty as well as the teaching environment also make students interested in the study [25,27]. |
After applying Naïve Bayes Classification using K-Fold Cross Validation uses to identify issues like overfitting or selection bias, evaluate the model's capacity to forecast fresh data that was not utilized in its estimation and provide insight into how the model will generalize to an independent dataset.
Table 4. Naïve Bayes Classification Result summery
|
Classifier Algorithm |
Naïve Bayes |
|
Correctly Classified Instances |
69.462% (3073) |
|
Incorrectly Classified Instances |
30.538% (1351) |
|
Kappa statistic |
0.4927 |
|
Mean absolute error |
0.2182 |
|
Root mean squared error |
0.4092 |
|
Relative absolute error |
53.1857 % |
|
Root relative squared error |
90.3492 % |
|
Total Number of Instances |
4424 |
Naïve Bayes classification Confusion Matrix === a b c <-- classified as 932 244 245 | a = Dropout
157 1857 195 | b = Graduate
127 383 284 | c = Enrolled
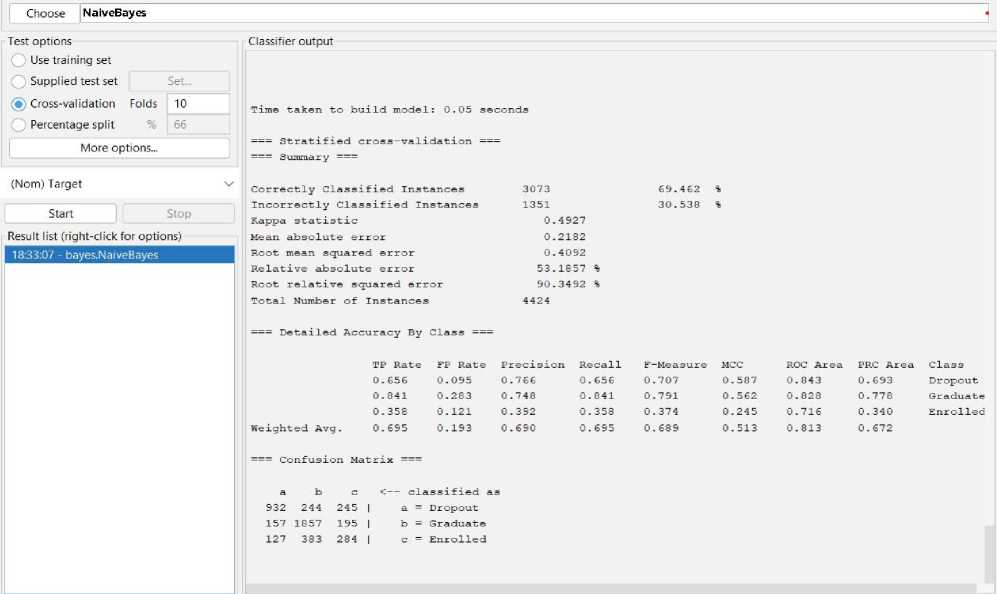
Fig. 4. The result of Naïve Bayes Classification using 10-fold cross-validation.
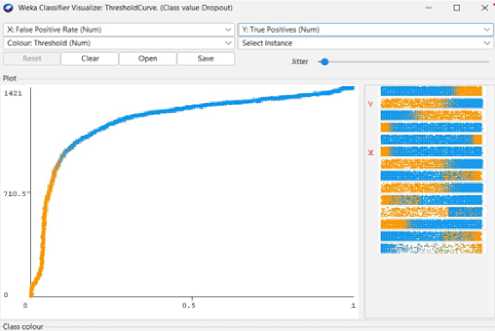
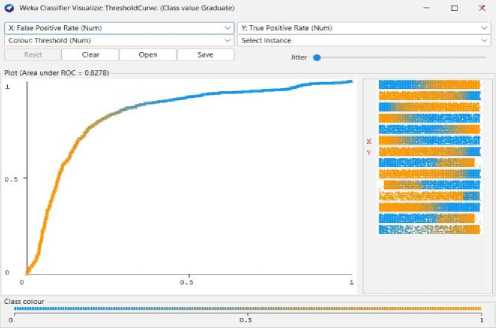
We can achieve 69% predictive accuracy by using Naïve Bayes Classifier Model as shown in Fig 4. In summary, from 4424 instances, Naïve Bayes can classify 3073 instances correctly and 1351 instances incorrectly. And the following Fig 5 to Fig 8 shows the threshold curve of student success, dropout, enrollment, and classifiers error.
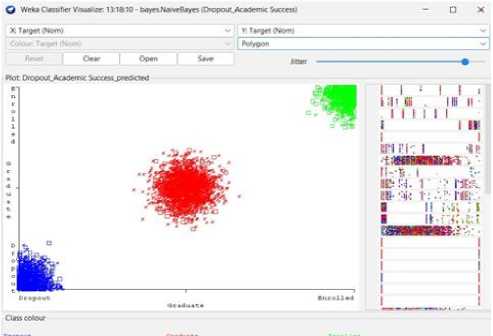
Fig. 5. Naïve Bayes Classification error.
-
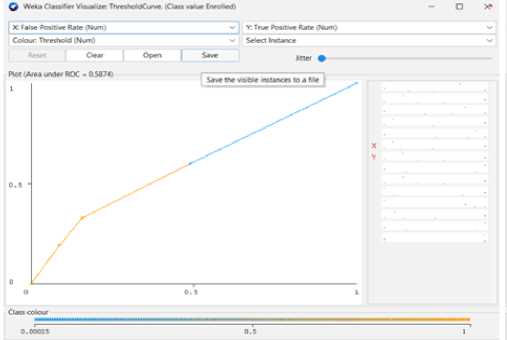
Fig. 6. Naïve Bayes Threshold Curve (Dropout).
-
Fig. 7. Naïve Bayes Threshold Curve (Graduate).
-
Fig. 8. Naïve Bayes Threshold Curve (Enrolled).
After applying K-Nearest Neighbor (KNN) classification K-Fold Cross Validation also uses to identify issues like overfitting or selection bias, evaluate the model's capacity to forecast fresh data that was not utilized in its estimation, and provide insight into how the model will generalize to an independent dataset [28].
Table 5. K-Nearest Neighbor (KNN) Classification Result
|
Classifier Algorithm |
KNN |
|
Correctly Classified Instances |
62.7939% (2778) |
|
Incorrectly Classified Instances |
37.2061% (1646) |
|
Kappa statistic |
0.3935 |
|
Mean absolute error |
0.2482 |
|
Root mean squared error |
0.4978 |
|
Relative absolute error |
60.501% |
|
Root relative squared error |
109.9302 % |
|
Total Number of Instances |
4424 |
KNN classification Confusion Matrix === a b c <-- classified as 904 300 217 | a = Dropout
236 1614 359 | b = Graduate
160 374 260 | c = Enrolled
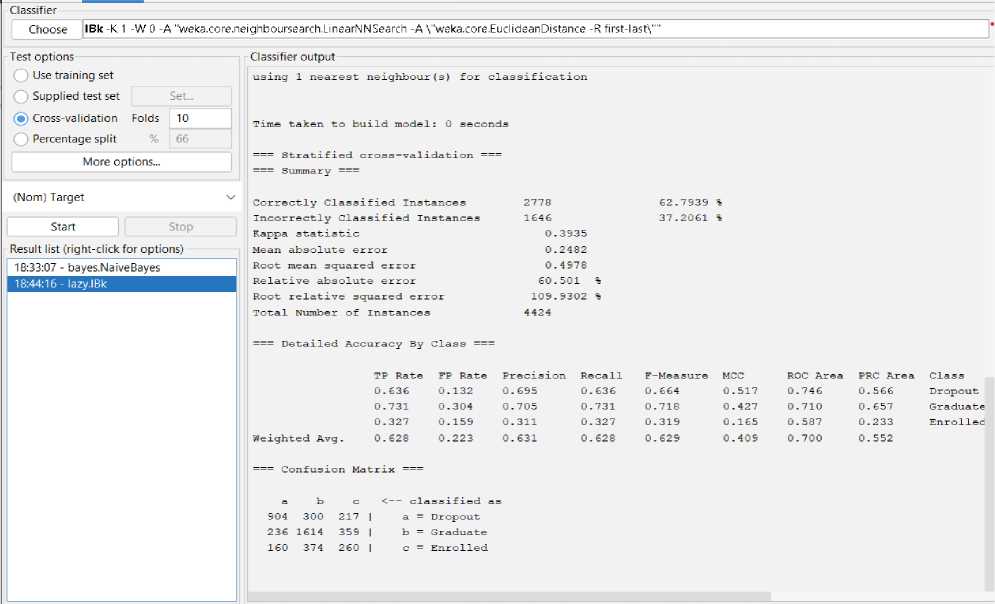
Fig. 9. The result of KNN Classification.
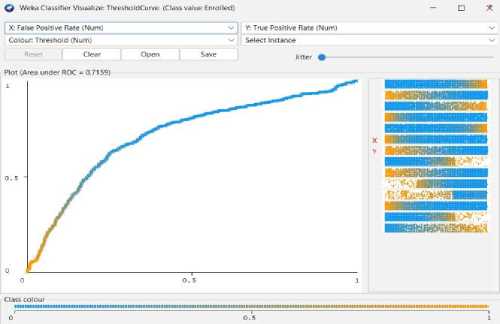
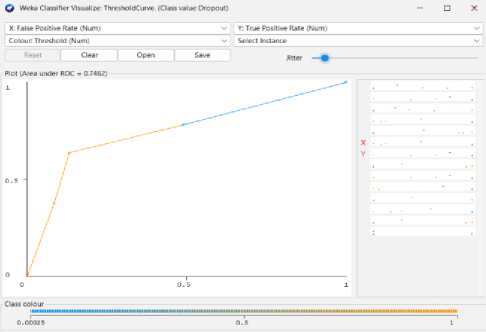
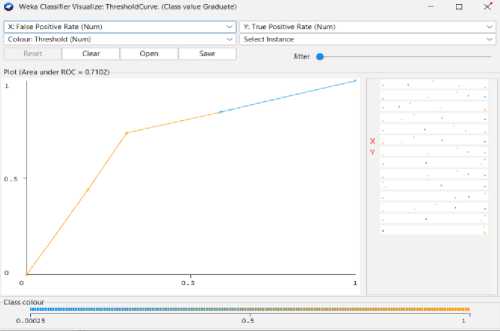
We can achieve 63% predictive accuracy by using KNN Classifier Model as shown in Fig 9. From 4424 instances, KNN can classify 2778 instances correctly and 1646 instances incorrectly. And the following Fig 10 to Fig 13 shows the threshold curve of student success, dropout, enrollment, and classifiers error.
-
Fig. 10. KNN Threshold Curve (Dropout).
-
Fig. 11. KNN Threshold Curve (Graduate).
-
Fig. 12. KNN Threshold Curve (Enrolled).
-
Fig. 13. KNN Classification error.
Decision and prediction nodes are both part of a decision tree. A predicate condition is specified by decision nodes. Prediction nodes only have one number in them. Prediction nodes usually serve as the root and leaves of decision trees. Using K-fold cross-validation. A Decision Tree categorizes an instance by traversing all routes for which all prediction nodes are true and adding any decision nodes that are true [29].
Decision Tree Classification Confusion Matrix == a b c <-- classified as 1067 189 165 | a = Dropout
121 1905 183 | b = Graduate
220 281 293 | c = Enrolled
Table 6. Decision Tree Classification Result
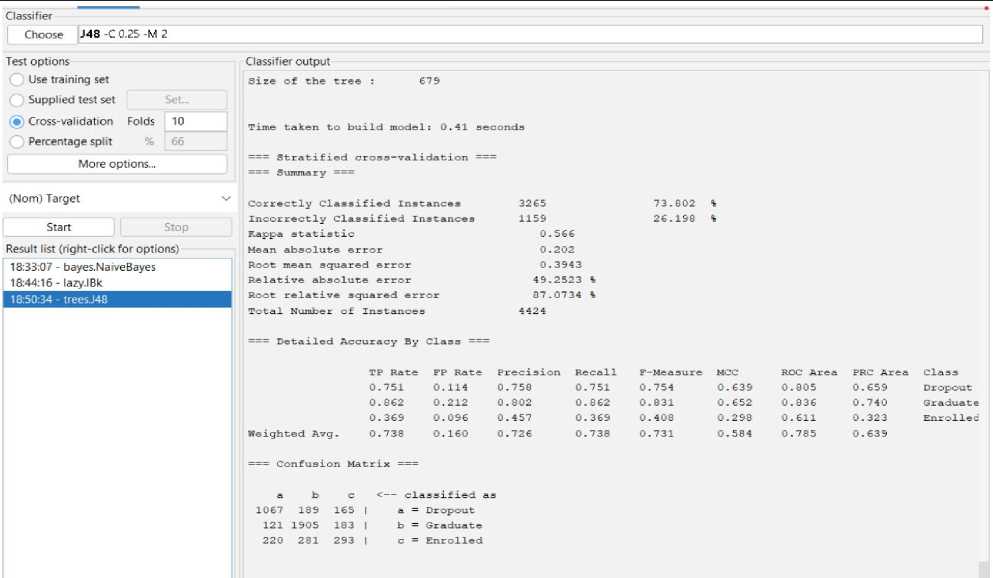
Fig. 14. The result of Decision Tree Classification.
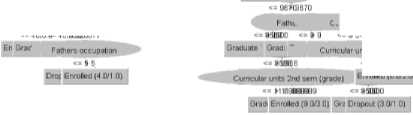
scholarship holder
-■ *Л7ЯЙНОВЗ bathers occupation
Curricular units 2nd sem (grade)
«=ii швваювм?
Curricular un« 2nd tern (gra-., Curricular units 2nd sem (grade;
«- 1СШ03
<=90850085 <=>11BH8HE5
И111В1®1В1в= ВШИТО
Curricular u En Fathers Graduate (20) |
Curricular units Er
*112ШНВ5
>ГП74= »118ЮИИ85
Drop Graduate ( Eni Gradu Gr
Enrolled (6 0/20)
Curricular units 2nd sem (grade)
iculw units 2nd si
Dro| Gri En-
Curricular units 2nd sem (grade! "T2 <= >21Q49El№7
Paths Gradua [> Enrol Dropou Course ' Dropout ^ Fathers oct Enroll! Gradur Cotlrse
Dropout course
0130 <=9SBK6 <=9№6
Curricular unit Grt Enrolled (4 0/1 0) |
*- JO10e- W1D2BZ0[F77
Curriculart* Oroi Droi Enrolled (130/4 0) | <=10810 8 <= №11675
■i a: ^8tiWB5 «=861И7«-енстз «^
Fathers occupation MiEr Fail. Fathi Dr°l> Dr°P01 Er
Fathen occupation
1 units 2nd sem i
Dropout (4 0/1 01
Curricular units 2nd sem (grade)
«- 914-79147
8 fr = »213аВИ1»11ВШН7114
Graduate course
Drop Enrolled (2 0) |
|
Classifier Algorithm |
Decision Tree |
|
Correctly Classified Instances |
73.802% (3265) |
|
Incorrectly Classified Instances |
26.198% (1159) |
|
Kappa statistic |
0.566 |
|
Mean absolute error |
0.202 |
|
Root mean squared error |
0.3943 |
|
Relative absolute error |
49.2523% |
|
Root relative squared error |
87.0734% |
|
Total Number of Instances |
4424 |
|
Size of Tree |
679 |
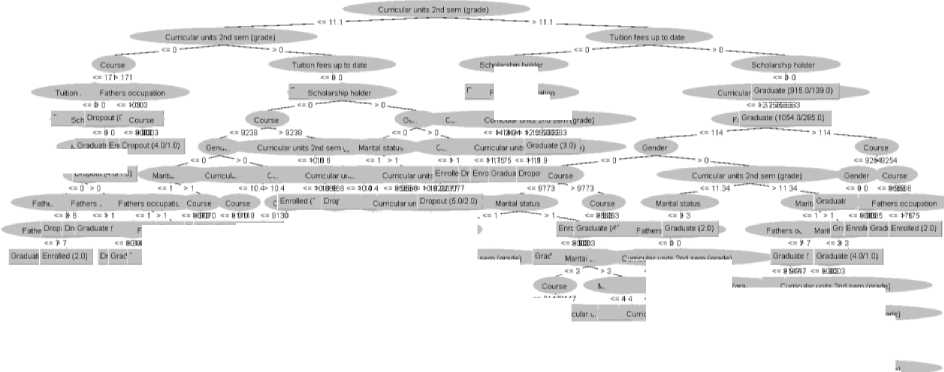
Fig. 15. Decision Tree Classification
Using the Decision tree model, we can reach 73.80% predicted accuracy in this case as shown in fig 14. A decision tree can categorize 3265 of the 4424 occurrences and 1159 erroneously out of 4424. And the following Fig 16 to Fig 18 shows the threshold curve of student success, dropout, and enrollment.
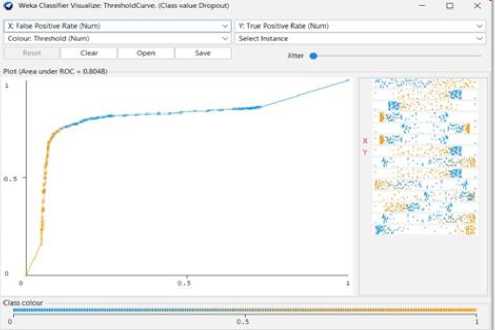
Fig. 16. Decision Tree Threshold Curve(Dropout)
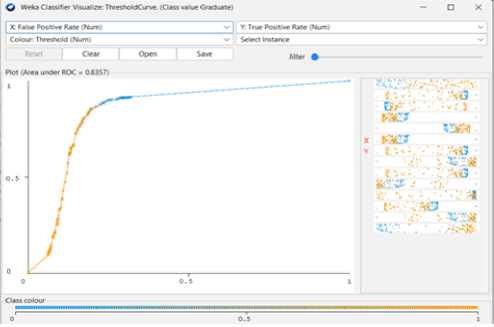
Fig. 17. Decision Tree Threshold Curve(Graduate)
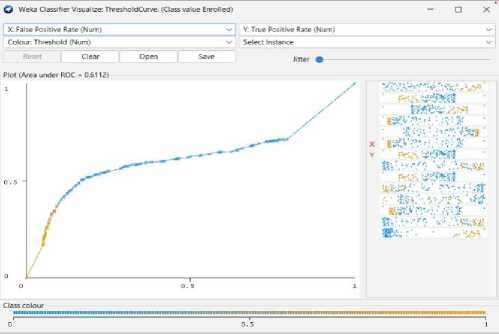
Fig. 18. Decision Tree Threshold Curve (Enrolled)
After applying Random Forest, the computational cost of a random forest is higher, particularly in this large dataset and with many trees.
Table 7. Random Forest Classification Result
|
Classifier Algorithm |
Random Forest |
|
Correctly Classified Instances |
77.6447 % (3435) |
|
Incorrectly Classified Instances |
22.3553% (989) |
|
Kappa statistic |
0.6194 |
|
Mean absolute error |
0.2275 |
|
Root mean squared error |
0.3261 |
|
Relative absolute error |
55.4514% |
|
Root relative squared error |
72.0005 % |
|
Total Number of Instances |
4424 |
Random Forest classification Confusion Matrix == a b c ^ classified as 1086 227 108 | a = Dropout
56 207 81 | b = Graduate
220 343 277 | c = Enrolled
Using the Random Forest model, we can achieve 77.65% predicted accuracy in this case as seen in Fig 19. A Random Forest can categorize 3435 of the 4424 occurrences and 989 erroneously out of 4424. And the following Fig 25 to Fig 28 shows the threshold curve of student success, dropout, enrollment, and classifiers error.
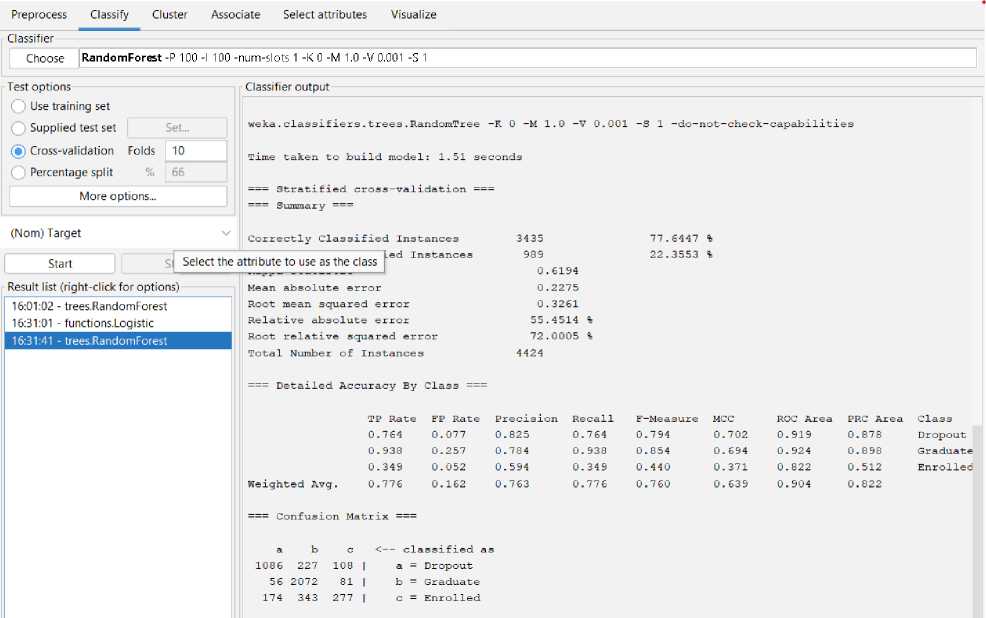
Fig. 19. The result of Random Forest Classification.
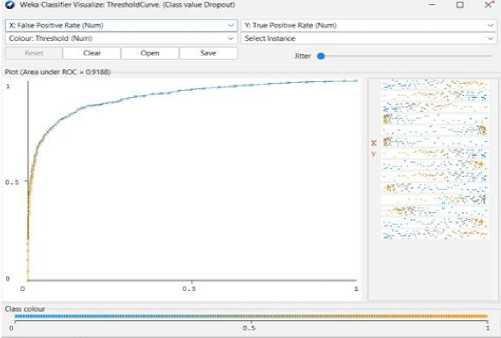
Fig. 20. Random Forest Threshold Curve (Dropout)
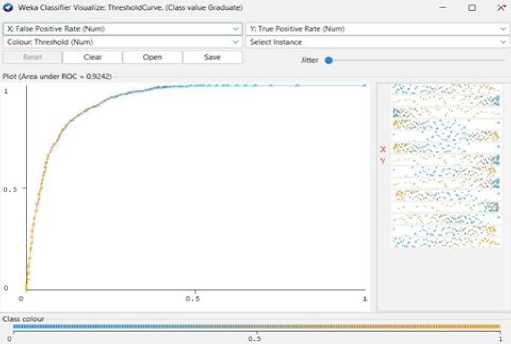
Fig. 21. Random Forest Threshold Curve (Graduate)
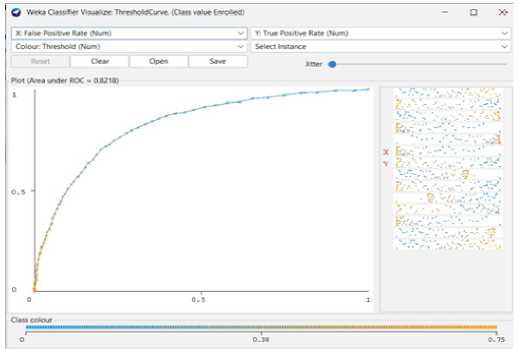
Fig. 22. Random Forest Threshold Curve (Enrolled)
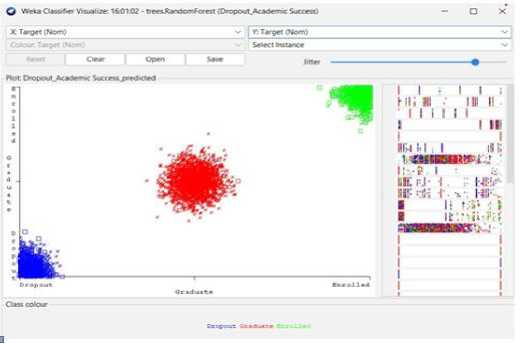
Fig. 23. Random Forest Classifier Error
Table 8. Logistic Regression Function Classification Result
|
Classifier Algorithm |
Logistic Regression |
|
Correctly Classified Instances |
76.4919% (3384) |
|
Incorrectly Classified Instances |
23.5081% (1040) |
|
Kappa statistic |
0.6013 |
|
Mean absolute error |
0.2134 |
|
Root mean squared error |
0.3282 |
|
Relative absolute error |
52.0278% |
|
Root relative squared error |
72.4798% |
|
Total Number of Instances |
4424 |
After applying Logistic Regression, the relationship between a binary outcome variable one that can only have one of two values, like "yes" or "no" and one or more predictor variables is examined using logistic regression. It is a well-liked method for modeling binary classification issues in data analysis and machine learning.
Logistic Regression Function Classification Confusion Matrix == a b c ^ classified as
1089 197 135 | a = Dropout
61 2049 99 | b = Graduate
196 352 246 | c = Enrolled
We can achieve 76.49% predictive accuracy by using Logistic Regression Function Classifier Model. From 4424 instances, Logistic Regression Function can classify 3384 instances correctly and 1040 instances incorrectly. And the following Fig 25 to Fig 28 shows the threshold curve of student success, dropout, enrollment, and classifiers error.
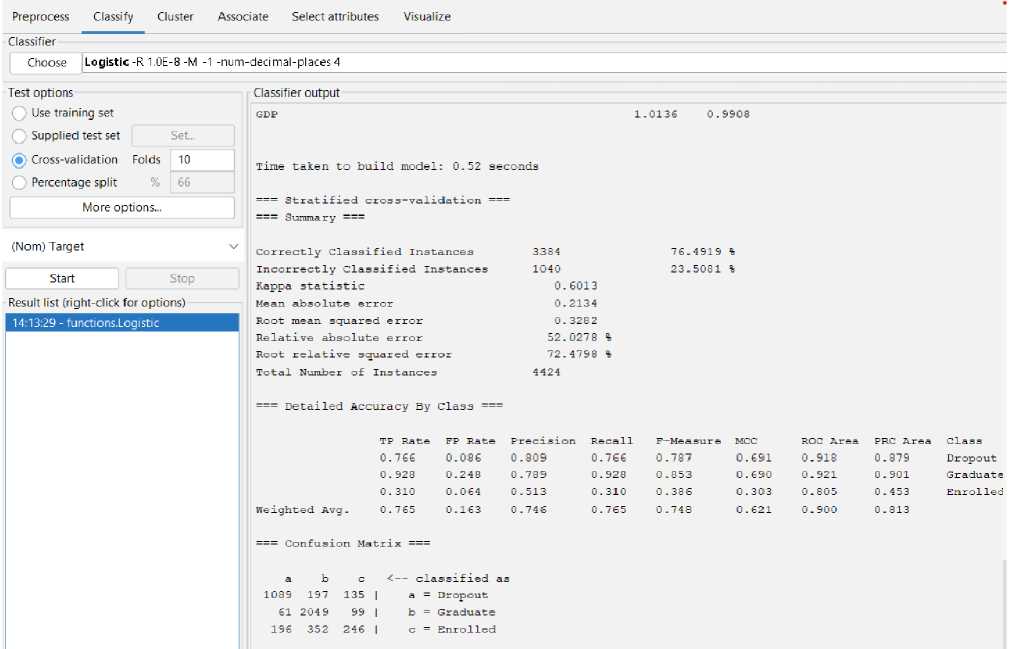
Fig. 24. The result of Logistic Regression Classify Function.
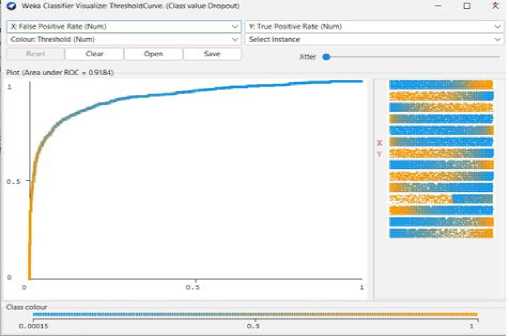
Fig. 25. Logistic Regression Threshold Curve (Dropout)
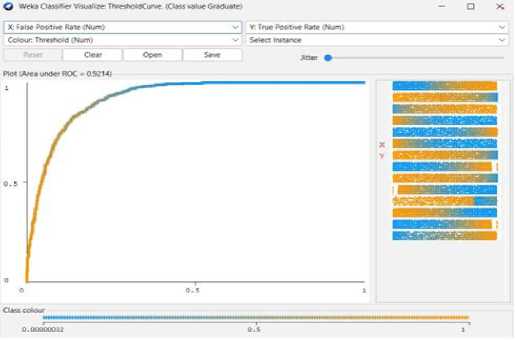
Fig. 26. Logistic Regression Threshold Curve (Graduate)
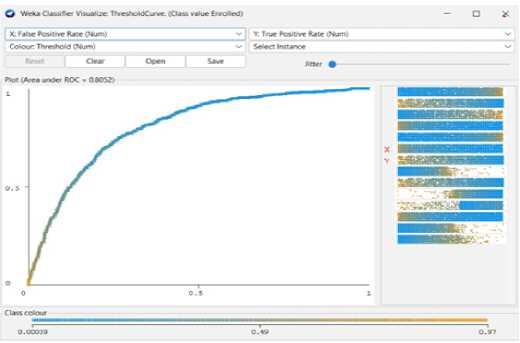
Fig. 27. Logistic Regression Threshold Curve (Enrolled)
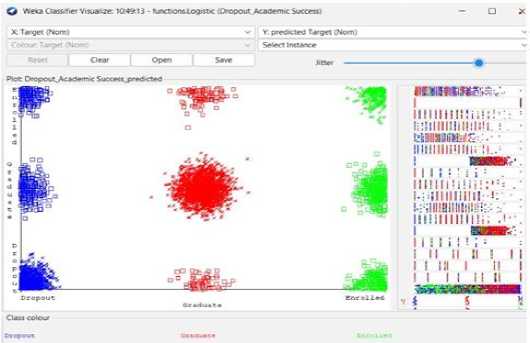
Fig. 28. Logistic Regression Classifier Error
4. Result and Discussion
Numerous studies have been done in the past to determine student dropout rates. Some of them have had success in that industry. The main methods they employed were Naive Bayes, KNN, Decision Trees, Random Forests, Logistic Regression, Vector Machines, and Neural Networks. Additionally, they used a number of socioeconomic, academic, and demographic variables as predictors of student dropout. Random forests achieved the best overall performance in some cases, while Decision Trees pulled the best results in other situations. Other study findings demonstrated that the artificial neural network model outperformed the competition in terms of precision and predictive strength.
Therefore, in order to produce better results, we have conducted research using some of these data mining techniques. The random forest provides us with the overall best performance in our research among all other techniques, with an accuracy of 77.64%. 4424 instances have been calculated, 3435 of which have been correctly classified. With an accuracy of 76.49%, Logistics Regression came in second place, calculating 3384 Correct Instances out of 4424.
Decision Tree comes in third with a 73.8% accuracy rate and 3265 correct instances out of 4424. The number of failed courses, grade point average, and age of the student were found to be the three most significant predictors of student dropout in other studies. A combination of socioeconomic, academic, and demographic factors can accurately predict dropout rates, according to some other authors in recent by EDM (Educational Data Mining) research area describing it as concerned with developing, researching, and applying computerized methods to detect patterns in large collections of educational data that would otherwise be hard or impossible to analyze due to the enormous volume of data [30]. But in our case, we have observed that factors such as the student's course, student status, relationship, tuition costs, and father's employment have had a significant influence on the calculation of the retention rate.
Table 9. Result in Comparison among five classifiers
|
Classifier |
Training Time |
Accuracy |
Misclassification |
|
Naive Bayes |
Slower than KNN, faster than Decision Tree, Random Forest, and Logistic Regression |
69% |
1351 |
|
KNN |
Fastest |
62.79% |
1646 |
|
Decision Tree |
Slower than Naive Bayes and KNN but Fastest than Random Forest and Logistic Regression |
73.80% |
1159 |
|
Random Forest |
Slower than the other four algorithms |
77.65% |
989 |
|
Logistic Regression |
Slower than KNN, and Naïve Bayes. Faster than Decision Tree, Random Forest, and Logistic Regression |
76.49%. |
1040 |
According to five classifiers, the decision tree proposed approach generates a very deep tree, but the accuracy level is higher in Random Forest than in Naïve Bayes, KNN, Decision Tree, and Logistic Regression. Though the training time of the Decision Tree, Random Forest, Logistic Regression, and Naïve Bayes is slower than KNN, the most predicted result get from the Random Forest.
5. Conclusion
In this research, the primary objective was to use data mining algorithms to analyze student dropout prediction rates. Our research is primarily done with particular populations and circumstances, which restricts how broadly it may be applied to other contexts and populations. Due to the lack of a common definition of dropout in the research community, it is very challenging to compare results across studies. According to research, we have done. Basically, relying on retrospective data means that a researcher must rely on participants to remember the reasons they discontinued the study. Our studies also rely on statistical analysis, which might not adequately account for the nuanced factors that influence participant dropout.
Further study is necessary to fully comprehend the dropout phenomena and to create efficient treatments that will lower dropout rates in face-to-face educational programs. Future studies should look into topics like teacher-student interactions and dropout rates, the technological use in education and its effects, and the efficacy of interventions designed to lower dropout rates in various cultural contexts. There are many tasks we need to complete in the future, such as the requirement for additional comparative studies to assess the efficacy of various data mining techniques, the significance of improving anonymity data mining techniques, and the requirement to investigate the use of data mining in conjunction with other perspectives, such as social network analysis and some other specific things.
In our deliberations, we have come to the conclusion that universities could identify at-risk students and offer them the necessary support and interventions to keep them from dropping out. They also point out that by incorporating more variables, such as social and psychological factors, and by using more sophisticated data mining techniques, their model could be enhanced. We believe that the methods mentioned above are generally very promising for calculating dropout rates in the future using useful variables.
References Investigation of Student Dropout Problem by Using Data Mining Technique
- Tinto, V., “Research and practice of student retention:What next, College Student Retention: Research”,Theory, and Practice, 8(1), pp. 1-20, 2006.
- Tinto, V., “Leaving College: Rethinking the cause and cure of student attrition”. Chicago: University of Chicago Press, 1993.
- Chong, Ho Yu, Samuel Di G., J.H., A. Jannasch-Pannell, W. Lo,C. Kaprolet,2007. Applied Learning Technology Institute. https://www.researchgate.net/publication/228681539_A_datamining_approach_to_differentiate_predictors_of_retention
- Tinto, V., “Dropout from Higher Education: A theatrical synthesis of recent research”. Review of Education Research, 45, 89-125, 1975.
- Francesco Agresti, Gianmarco Bonavolontà, Mauro Mezzini UNIVERSITY DROPOUT PREDICTION THROUGH EDUCATIONAL DATA MINING TECHNIQUES: A SYSTEMATIC REVIEW http://je-lks.org/ojs/index.php/Je-LKS_EN/article/view/1135017
- J. Han and M. Kamber, “Data Mining: Concepts and Techniques,” Morgan Kaufmann, 2000.
- Witten, I. H., Frank, E., Hall, M. A., “Data Mining:Practical Machine Learning Tools and Techniques”, 3rd Ed. Morgan Kaufmann, 2011
- Leandro Rondado , Veronica Oliveira ,Bruno Elias and Frank Jose Affonso A Systematic Mapping on the Use of Data Mining for the Face-to-Face School Dropout Problem. https://www.researchgate.net/publication/351240702_A_Systematic_Mapping_on_the_Use_of_Data_Mining_for_the_Fa ce-to-Face_School_Dropout_Problem
- Adejo, O. W., & Connolly, T. (2018). Predicting student academic performance using multi-model heterogeneous ensemble approach. Journal of Applied Research in Higher Education, 10(1), 61–75. https://www.emerald.com/insight/content/doi/10.1108/JARHE-09-2017-0113/full/html
- Boris P´erez1,2(B) , Camilo Castellanos2 , and Dar´ıo Correal2,1 Univ. Francisco de Paula Stder., C´ucuta, Colombia borisperezg@ufps.edu.co,2 Universidad de los Andes, Bogot´a, Colombia {cc.castellanos87,dcorreal}@uniandes.edu.co
- Marina. B, A. Senthilrajan,"HFIPO-DPNN: A Framework for Predicting the Dropout of Physically Impaired Student from Education".IJMECS Vol.15, No.2, Apr. 2023
- Yukselturk E, Ozekes S, Türel YK.: “Predicting dropout student: an application of data mining methods in an online education program”. European Journal of Open, Distance and E-learning. Jul 1;17(1):118–33 (2014).
- Link:https://www.researchgate.net/publication/329632061_Predicting_Student_Drop- Out_Rates_Using_Data_Mining_Techniques_A_Case_Study_First_IEEE_Colombian_Conference_ColCACI_2018_Med ellin_Colombia_May_16-18_2018_Revised_Selected_Papers
- Ahuja, R., & Kankane, Y. (2017). Predicting the probability of student’s degree completion by using different data mining techniques. 2017 Fourth International Conference on Image Information Processing (ICIIP), 1–4. https://doi.org/10.1109/ICIIP.2017.8313763 https://www.researchgate.net/publication/323718837_Predicting_the_probability_of_student's_degree_completion_by_usi ng_different_data_mining_techniques
- Early_Dropout_Prediction_using_Data_Mining_A_Case_Study_with_High_School_Students Link:https://www.researchgate.net/publication/282670051_Early_Dropout_Prediction_using_Data_Mining_A_Case_Stud y_with_High_School_Students
- A_Systematic_Mapping_on_the_Use_of_Data_Mining_for_the_Face-to-Face_School_Dropout_Problem Link:https://www.researchgate.net/publication/351240702_A_Systematic_Mapping_on_the_Use_of_Data_Mining_for_th e_Face-to-Face_School_Dropout_Problem
- Padillo, F., Luna, J. M., and Ventura, S. (2020). LAC: Li-brary for associative classification. Knowledge-BasedSystems, 193:105432
- Boris P´erez1,2(B) , Camilo Castellanos2 , and Dar´ıo Correal2,1 Univ. Francisco de Paula Stder., C´ucuta, Colombia borisperezg@ufps.edu.co,2 Universidad de los Andes, Bogot´a, Colombia {cc.castellanos87,dcorreal}@uniandes.edu.co
- Predicting_Student_DropOuRates_Using_Data_Mining_Techniques Link:https://www.researchgate.net/publication/329632061_Predicting_Student_DropOuRates_Using_Data_Mining_Tech niques_A_Case_Study_First_IEEE_Colombian_Conference_ColCACI_2018_Medellin_Colombia_May_16- 18_2018_Revised_Selected_Papers
- Cristobal Romero, Sebastian Ventura Data mining in education. https://wires.onlinelibrary.wiley.com/doi/10.1002/widm.1075
- Agrusti, F., Bonavolonta, G., and Mezzini, M. (2019). Uni-versity dropout prediction through educational datamining techniques: A systematic review. Journal ofe-learning and knowledge society, 15:161–182.
- Leandro Rondado de Sousa1, Veronica Oliveira de Carvalho1 a, Bruno Elias Penteado2 and Frank Jos´e Affonso1,Universidade Estadual Paulista (Unesp), Instituto de Geociˆencias e Ciˆencias Exatas, Rio Claro, Brazil,Universidade de S˜ao Paulo (USP), Instituto de Ciˆencias Matem´aticas e de Computac¸ ˜ao, S˜ao Carlos, Brazil.
- Mukesh Kumar, A.J. Singh, Disha Handa,"Literature Survey on Educational Dropout Prediction".IJEME Vol.7, No.2, Mar. 2017.
- Padhraic Smyth, Gregory Piatetsky-Shapiro, Usama Fayyad From Data Mining to Knowledge Discovery in Databases https://ojs.aaai.org/index.php/aimagazine/article/view/1230
- Guarin, C. E. L., Guzman, E. L., and Gonzalez, F. A.(2015). A model to predict low academic perfor-mance at a specific enrollment using data mining. Re-vista Iberoamericana de Tecnologias del Aprendizaje,10(3):119–125
- M´arquez-Vera, C., Cano, A., Romero, C., Noaman, A.Y. M., Mousa Fardoun, H., and Ventura, S. (2016).Early dropout prediction using data mining: A casestudy with high school students. Expert Systems: TheJournal of Knowledge Engineering, 33(1):107–124
- Manh˜aes, L. M. B., Cruz, S. M. S., and Zimbr˜ao, G. (2014).WAVE: An architecture for predicting dropout in un- dergraduate courses using EDM. In Proceedings ofthe 29th Annual ACM Symposium on Applied Com-puting (SAC), pages 243–247.
- Bala, M., & Ojha, D. D. B. (2012). STUDY OF APPLICATIONS OF DATA MINING TECHNIQUES IN EDUCATION. Vol. No., (1), 10. https://ijrst.com/admin/upload/Jan_2012_Manoj%20Bala%201.pdf
- Bean, J. P. (1990). Using retention research in enrollment management. The Strategic Management of College Enrollments, 170–185.
- Jadhav, R. J. (2011). Churn Prediction in Telecommunication Using Data Mining Technology. International Journal of Advanced Computer Science and Applications - IJACSA, 2(2), 17-19. https://thesai.org/Publications/ViewPaper?Volume=2&Issue=2&Code=IJACSA&SerialNo=4
