Investigation of the process of moisture crystallization in bricks

Author: Zheldakov D.Yu., Kozlov V.V., Kuznetsov D.V., Sinitsin D.A.
Journal: Nanotechnologies in Construction: A Scientific Internet-Journal @nanobuild-en
Section: Construction materials science
Article in issue: 6 Vol.12, 2020.
Free access
To solve the problems concerning moisture behaviour in the material of construction’s enclosure, especially at alternating temperatures, is very important for the correct calculations of resistance to heat conduction of construction’s enclosure and, ultimately, for comfortable living conditions. However, there are still no methods for building enclosure’s materials that could determine the temperature of moisture crystallization in the material in solid phase. The premise of the research is that water incoming to the material of construction’s enclosure, presenting in the construction’s material in the form of oxides and salts, as a result of hydrolysis process of some elements, is an eutectic solution with unstable composition and concentration. Thus, the research of moisture crystallization process transfers from micro- area (when determining the temperature of crystallization by the size of material’s pores) to the nano- area when researching the eutectic solution at the possible condition of hydrates formation. The experimental technique was developed to perform laboratory research of the process of moisture freezing. The technique takes into account that freeze-thaw process of moisture in solid body is studied at significant difference between mass of liquid phase and mass of solid phase. The method was simplified for the broad use at working conditions. The simplicity of the method aimed at obtaining experimental resultsis compensated by the developed mathematical method of processing the results of the research. Mathematical solution of the problem based on the comparison of freezing curves behaviour of the samples in dry and humidified samples. Apart from the temperature of moisture freezing, the developed method allowed obtaining additional characteristics of moisture states, such as amount of unfrozen moisture in construction’s material, supercooling temperature, heat capacity of moisture in liquid and solid states, concentration of dissolved agents. Knowing the concentration of dissolved agents in the material, even without knowing the exact composition of these agents, allows manipulating the temperature of moisture freezing at the nanotechnology level.
Pore structure of the material, moisture crystallization, supercooling temperature, mathematical modeling of the heat exchange process
Short address: https://sciup.org/142226940
IDR: 142226940 | DOI: 10.15828/2075-8545-2020-12-6-305-312
Text of the scientific article Investigation of the process of moisture crystallization in bricks
T he subject of research is the study of moisture behaviour in enclosures with alternating load. The object of research – structural ceramic material. The question of material humidification in enclosures – one of the main questions in structural physics that is being solved. Durability, hygiene and energy efficiency of enclosure based on its solution [1, 2, 3]. The presence of moisture in brickwork material changes the durability greatly [11, 12, 13]. It is necessary to know the amount of unfrozen moisture in construct
at every temperature when calculating humidity conditions of enclosure.
The task of this work is creation of mathematical treatment method for laboratory research results of moisture freezing process in brick material.
There are no methods to determine moisture crystallization temperature for enclosure materials in material research practices up until now [4, 5]. The uniqueness of this paper researches are:
– firstly, the freeze-thaw process of moisture studies in solid with a substantial difference in mass of liquid and solid phases;
CONSTRUCTION MATERIAL SCIENCE
– secondly, moisture considered as electrolytes solution with very low concentration [6, 7, 8];
– thirdly, constant change of dissolved elements composition in water is considered a subject to external conditions and initial elements composition of solid material [9, 10, 14, 15, 16].
When temperature of the construction’s enclosure drops below zero, up until nowcrystallization process has been considered as a process of water freezing in material’s pores. Variation of the amount of unfrozen water in material at different negative temperatures was explained as pore sizes in the material. In this work, moisture in the material isconsidered as eutectic solution that was obtained in hydration process of some oxides and salts from the material. This approach determines the research of the water crystallization process from the solution upon the condition of formation of nanoagents as salt hydrates. If it is possible to determine salts concentration in the solution, one can control the process of moisture freezing in construction enclosures based on nanotechnologies of changing the initial composition of the material.
The scope of this research is to design laboratory experiment and mathematical method of treatment experimental data for determination of moisture crystallization temperature, supercooling temperature, concentration of dissolved agents and moisture thermal capacity in liquid and solid states.
This paper describes the mathematical treatment method of experiment results only. Method and experiment results description as well as the results obtained by mathematical treatment method will be published later.
λ (∂t/∂x) = αn (tn–t),
where tn – temperature in freezer, oC;
αn – thermal conduction coefficient in freezer, W/(m•oC).
Actually, formulas (1) and (2) represents redistribution of heat in the sample due to heat conduction with surroundings. Initial conditions in the sample are set to evenly distributed temperature t0, measured in the experiment.
On the edges of estimated section, which contact with freezer, boundary conditions (2) would be applied. On the samples cutting edges of estimated section, due to symmetry of the task, boundary conditions of the second kind would be applied, thermal flow equals zero, i.e. temperature derivative by coordinate equals zero in tasks conditions:
^- = o
.
= 0
Conditions for other coordinates are made in analogue.
Due to symmetry of the system, solutions for equations and boundary conditions calculates with separation of variables. For brevity, we would skip the course of solution and write down the final formula:
, (4)
Mathematical formulation of the experiment
In general case, heat-conduction process in the sample represents as three-dimensional thermal conduction equation with boundary conditions of the third kind:
where η1, η2, η3 – coefficients are found from boundary conditions;
B – coefficient is found from initial conditions.
For practical use, first component of series is enough, i.e. formula (4), where coefficients η1, η2, η3 were defined in equation (5) in the first period of tangent in positive half-plane.
V^Mi tanGAhdi) =^T.

where x1, x2, x3 – coordinates, m;
λ1, λ2, λ3 – estimated thermal conductions for respective directions, W/(m•oC);
c – specific heat of material, J/(kg•oC);
γ – material density, kg/m3;
z – time, s.
Heat exchange occurs between the edges of the sample and air in freezer. It is suggested that sample has a parallelepiped form and heat exchanges evenly on every edge (there are no more detailed information about this process). Therefore, following boundary conditions used for one edge only.
If system axes positioned along sample’s edges, boundary condition changes to:
It is proved that temperature range on the sample hardly influencing studied trends outside phase transitions. The only process when temperature range has a distorting effect is phase transition. However, phase transitions mostly appear in moistened samples that has a much higher heat conduction than dry ones. Heat conduction significantly influence the temperature range on the sample by smoothening it. Briefly, we would mention that for the researched moistened sample the temperature range from warmest to coolest points equals to 14% of the overall temperature drop. Average temperature and temperature in sensor’s spot has matched precisely.
Influence of the temperature range on measuring precision of phase transition requires additional research. However, obtained results can point on organizational measures to increase the measuring precision.
CONSTRUCTION MATERIAL SCIENCE
Using a reasonably small and with high heat conduction researching samples allows to neglect temperature deviations across sample’s spots from average value.
This allows to simplify mathematical formulation of the task, reducing it to particle heat exchange with defined heat exchange and thermal capacity properties.
Mathematical model for particle heat exchange reducing to linear differential equation of the first degree:
cm•(∂t/∂z) = Sαn (tn–t), (6)
where m – sample’s mass, kg;
S – the total area of sample that involved in heat exchange, m2.
It is important to point out that cm in (6) equation is generalized heat capacity of the sample that changes because of phase transitions in the experiment process. Analogously, Sαn is generalized heat exchange coefficient of the sample that can change due to specified work condition of the freezer in the experiment process.
As a matter of convenience shifted temperature would be used next:
τ = tn+t.(7)
For the solution of equation (6) only one boundary condition is required. It is initial condition:
t(0) = t0.(8)
Overview of the solution:
t(z) = tn+(t0–tn) e–kz,(9)
where k is an exponential parameter that is found by formula:
k = Sαn/cm.(10)
Temperature-time dependence (9) must be solved by measurement of dry samples for which characteristic changes of the sample and freezer are small in the experiment period.
Statement and results of a laboratory experiment
For research, brick M100 with known elementary chemical and crystalline composition was chosen. Experiments were conducted with dry and 100% water-saturated samples in accordance to developed research program. Results of the experiment shown in Fig. 1 (for dry) and Fig. 2 (for wet).
Fig. 1 shows the distribution of temperature from the dry sample’s experiment. That figure shows the charts of shifted temperature and exponential dependency approximation. It is clear that experimental points almost ideally fall on the exponent. Initial and final point are excluded because process is severely distorted at these moments. At initial point, warm sample’s setting up distortion leads to significant change of temperature in the freezer. While the temperature is restoring, tn changes fast which means that formula (9) is not the solution of equation (6) in that period. At final period, an error is growing due to two factors. First, temperature in freezer is not constant but changes periodically by ±1.5oC (on a 44-minute period). Second, rounding of an error. Sensors fixate temperature with precision of a tenth of a second degree. It does not affect overall temperature drops between sample and freezer that makes up tens of degrees, but as those temperatures converge, the rounding error becomes more and more significant that leads to errors of tens of percent on the last period.
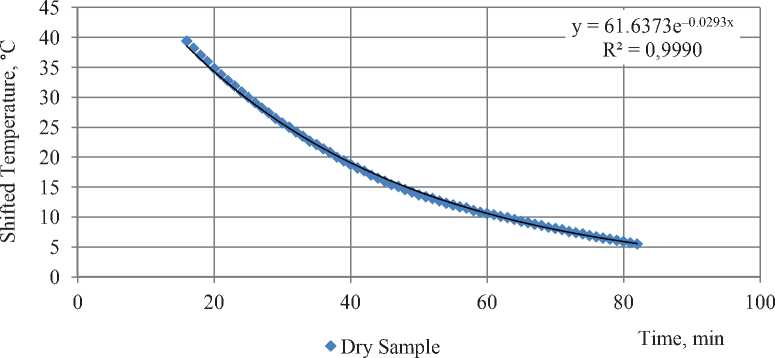
Fig. 1. Shifted temperature to time dependence for dry sample
CONSTRUCTION MATERIAL SCIENCE
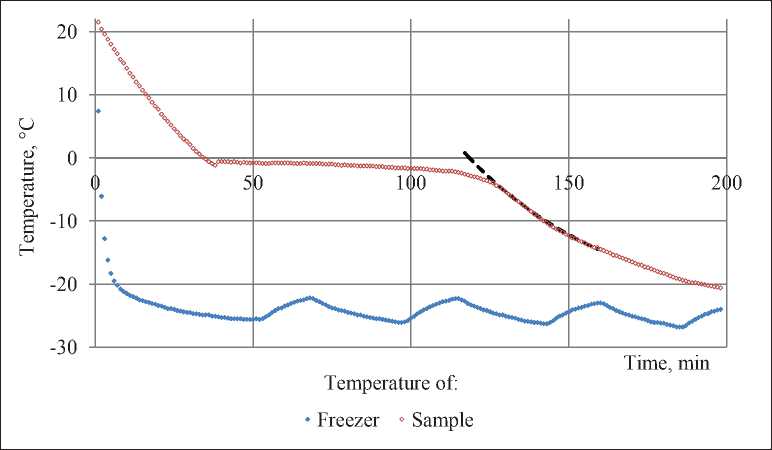
Fig. 2. Changing of temperature in freezer and temperature of water-saturated sample.
Chart shows the temperature in oC and timeline in minutes
For the wet sample, few changes would happen at once in the chart. Continuous exponential chart would divide into three periods. Two exponential periods more flat than in dry sample due to lowering of exponential parameter by additional heat capacity of water (ice on the negative temperature period), and one period is horizontal on the period of frozen water in material pores around 0oC. This way the chart should look like for distilled water in large spores. However, practically, water become a solution in most of building materials where pores are also small, and there’s a dozen of factors that affect freezing.
Let’s evaluate the calculation error that appears when finding an exponent parameter by formula (10). Following values of initial errors are applied. Temperature measuring has an error of 0.05oC, time error – 0.5 s. All the errors in equations are marked with symbol “δ”.
The result of this treatment helps finding local values with higher definiteness. Deviation from an average value is less than 2.5% when the temperature of the sample is higher than 5oC and less than 4% when temperature of the sample between –5oC to 5oC that is much precise than the uncertainty in finding k by Fig. 1.
Mass of the sample and its size are known with high precision. That’s why it’s possible to determine the heat exchange coefficient in freezer if specific heat of sample’s material is known. And vice versa it’s possible to determine specific heat of sample’s material if heat exchange coefficient in freezer is known.
Wet sample research
The course of freezing process in combination with temperature in freezer are shown in Fig. 2. Compensating for a few minutes after set up of warm sample, temperature in freezer is changing sawtoothly with an amplitude of 1.5oC and a period of approximately 45 minutes. Fluctuations of temperature in freezer decrease the measuring precision, especially with approximation of sample and freezer temperatures. Thereby, the results were unused when the difference between those temperatures was less than 5oC.
Fig. 2 shows the change of freezer temperature (blue markers) and sample temperature (red markers) in the research of water-saturated sample.
It is clear that freezing of the solution doesn’t start at 0oC. Sample is cooling to –1.3oC first and then it instantly warms up to –0.6oC.
First step of processing the results of experiment is to make certain that sample’s temperature changing exponentially on the periods outside phase transitions. Fig. 3 shows shifted temperature to time dependence in the experiment. Approximate periods of exponential growth and phase transition are marked with colors. Chart features different temperatures in freezer tn for the positive and negative temperature periods. It’s done for finding exponent parameter with higher precision due to changes of temperature in freezer in the experiment process. Selected tn are found by averaging respective chart periods.
Visually, the change of temperature in freezer in the processing leads to vertical shift of chart at 128 minute. This shift happened due to specifics of the results processing and not the course of the process.
As we can see in Fig. 3, extreme periods are covered by the exponent with high precision. Unlike the chart of dry sample, here the exponent parameter is changing and equals 0.0187 min–1 before and 0.0204 min–1 after phase
CONSTRUCTION MATERIAL SCIENCE
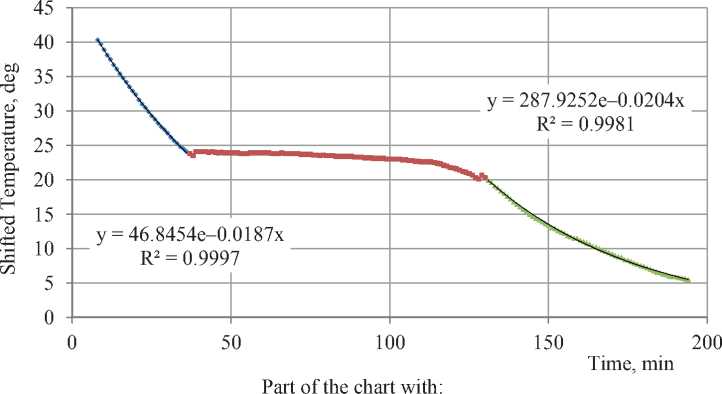
• Unfrozen Solution = Transition 1 Frozen Solution
Fig. 3. Shifted temperature of water-saturated sample to time dependence transition. Obviously, the exponent parameter changes due to change of heat capacity of the sample when solution freezes (heat capacity of the water approximately twice as high as heat capacity of ice).
Since the temperature in freezer was constantly changing in the measuring process (for a several degrees in total), it is necessary to use local values that defined in formula (10) to find exponential parameter with higher precision. This kind of processing made for periods with positive temperatures (unfrozen solution) and negative temperatures (completely frozen solution). Discovered effect of heat exchange difference between working and switched off freezer was used in processing.
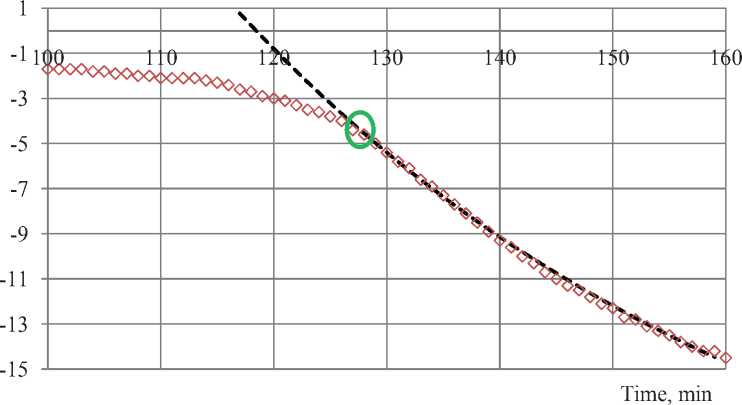
Black dotted line in Fig. 3 shows exponential approximation of sample’s temperature values below –8oC. Highlighted spot is the spot when exponential line diverge from experimental results (–4.5oC) enlarged shown in Fig. 4. This spot shows approximately the moment of complete freezing of the solution. In fact, the 100% freezing of the solution occurs on eutectic temperature and not affected by initial concentration. Therefore, most likely, precision become insufficient in that spot to determine the residual phase transitions in material.
More complete and precise knowledge of the solution freezing process (including 100% freezing spot) can be made by calculating the amount of unfrozen moisture directly from heat balance on the phase transition period. All the preparations has made, utility values are found from experimental data with maximum available precision.
In general case, solution’s mass is frozen in 1 minute between sample’s temperature measures that we can find by formula:
bmw =
San(fn-l)Az-(ckmk+cwmw+ci(mw0-mw))Af , (11)
where λs is specific heat of solution’s fusion, J/kg.
Formula (11) is found by assumption that the whole difference between given energy of the sample to the freezer and energy of sample cooling is found by solution’s crystallization. Using this formula directly will lead to addition of an error of specific heat fusion and other minor errors to the definition of heat exchange and specific heat capacity coefficients. Because of this, result error would be considerably large.
Formula (11) can be changed to exclude parameters with the highest error:
ckmk+cwmw+cl(mw0-mw') L-n LL\L
* S OC-^tXZ /ПА
^^W Л ,(12)
Sa^Az tn-t- 1 At
^ = —T^ .(13)
W Ag ''
San^\z
Exponential parameter changes in solution freezing process due to difference between specific heat capacity of water and ice. The value reciprocal of exponent parameter depend linearly to the mass of unfrozen water. Thus, sufficiently knowing the exponent parameter in two spots, we can draw the straight line and find reciprocal value without precision loss.
Using experiment data it is possible to determine the exponent parameter at 0oC – k1 = 0.00031 s–1 and exponent parameter at –6oC – k2 = 0.00035 s–1. Then:
CONSTRUCTION MATERIAL SCIENCE
о Sample's Temperature Exponential Approximation
Fig. 4. Complete freezing spot of the solution in material pores
♦ Unfrozen Solution
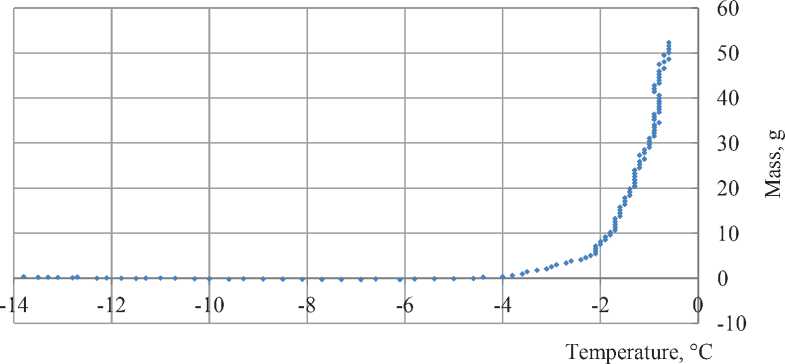
Fig. 5. Mass of the unfrozen solution to temperature dependence

Formula (14) corresponds to working freezer. When the freezer is switched off, values from formula (14) should be multiplied by 1.1.
Formula (13) allows to draw the chart with unfrozen water to temperature dependence. The shape of the curve is mostly known so drawing it helps to revise unknown parameters. To draw the curve, it is necessary to determine the value of λs/Sαn. Specifying the changes of this parameter and temperature is too difficult and an error would exceed our gain in precision by specification. Based on the previously performed research for dry sample and tabulated value of melting heat of pure ice (330 kJ/kg, λs/Sαn = 1997000oC•s/kg), because of low precision of heat exchange coefficient, preliminary error of parameter λs/Sαn can be evaluated as 10%.
The chart of mass of unfrozen water to temperature dependence shown in Fig. 5. Red dotted line show initial mass of the solution. Asymptote lines up with zero. Deviations of the dots from zero on the horizontal part
CONSTRUCTION MATERIAL SCIENCE of the chart shows the real error of calculations. Their value equals ±0.3 g and mostly occurs due to temperature sensor precision.
It is clear that the main process of freezing ends at –4.5oC. If the process continues, it is hardly distinguished from the measuring error and its value less than 1 gram (2%) of the agent.
CONCLUSIONS
-
1. Methodology of experiment to find temperature of moisture crystallization in brick material has been developed. The significance of this method is determined primarily by the fact that it enables the research of crystallization process at significant difference of masses of solid and liquid phases.It is developed with a possibility to be performed with available laboratory equipment.
-
2. In the development of the method, the new approach was used that determines the research of the water crystallization process from the solution at the conditions of nanoagents formation as salt hydrates. Moisture in the material considered as eutectic solution, obtained in
-
3. Mathematical method of analyzing the results of experiment has been developed. Results of the analysis shown high reliability of the results using developed method. Calculation error is less than 1%.
-
4. Analysis of developed method showing the direction to improve the calculation precision.
-
5. Using both developed laboratory experiment and mathematical method allows determination of important heat engineering calculations and calculations of materials durability: amount of unfrozen water in material, initial and final temperature of moisture crystallization in bricks, electrolyte concentration in moisture, and to prove the principal mechanism of moisture behavior in brick material from the physicochemical process perspective.
-
6. The possibility to determine salt concentration in the solution creates the conditions to develop nanotechnologies to manipulate the water freezing process in construction enclosures based on the changing of initial composition of the material.
the process of hydration of some oxides and salts, from the composition of the material.
References Investigation of the process of moisture crystallization in bricks
- Fokin K.F. Construction heat engineering of enclosing parts of buildings. Moscow: AVOK-PRESS; 2006. 256 p. (In Russian).
- Gagarin V.G. Thermal performance as the main factor of energy saving of buildings in Russia. Procedia Engineering ≪8th International Cold Climate HVAC 2015 Conference≫. Dailan: Elsevier; 2016. p. 112–119.
- Gagarin V., Akhmetov V., Zubarev K. Assessment of enclosing structure moisture regime using moisture potential theory. MATEC Web of Conferences. Ho Chi Minh City: EDP Science; 2018. p. 3053.
- Konovalov V.V. General regularities of the development of ecoysystem (deformation model). Saarbrucken: Palmarium academic publishing, 2012. 252 p.
- Bermejo-Pareja F., Benito-Leon J., Vega S. at al. Incidence and subtypes of dementia in three elderly populations of central Spain. J. Neurol. Sci. 2008; 264: 63-72.
- ZheldakovD.Yu. Methods of investigation of the kinetics of chemical corrosion of brickwork materials. Izvestiya higher educational institutions. Construction. 2019; 11: 74-86.(In Russian).
- Mirnik M. Electrostatic and chemical interactions of ions in electrolytes and in ionic point-charge double layers II. Progress in Colloid and Polymer Science. 2000;115: 334-341. Available from: doi: 10.1007/3-540-46545-6_64.
- Properties of porous silicon / Ed. by L.Canham. London: EMIS Datareviews. Ser. Nо. 18, 1997.
- ZheldakovD.Yu. Brickwork chemikal corrosion features, International science and technology conference ≪EarthScience≫. In: IOP Conf. Series: EarthandEnvironmentalScience. 459 (2020) 062089.
- Butterworth B., Baldwin L.W. Laboratory test and the durability of brick: The indirect appraisal of durability (continued). Transactions of the British Ceramics Society. 1964; 63(11): 647-661.
- Orlovich R.B., Nowak R., Vatin N.I., Bespalov V.V. Strength evaluation of the Prussian vaults made from brick aggregate concrete.Magazine of Civil Engineering. 2018; 82 (6): 95-102. Available from: doi: 10.18720/MCE.82.9.
- Bespalov V., Orlovich R., Zimin S. Stress-strain state of brick masonry vault with an aperture.MATEC Web of Conferences. 2016. Nо. 53. Art. no. 01009. Available from: doi: 10.1051/matecconf/20165301009.
- Franchi A., Crespi P., Ronca P., Pizzamiglio F. An in situ diagonal compression test for brick walls with displacement control on the two external layers. International Journal for Housing Science and Its Applications. 2014.38 (1): 25-35.
- Loganina V.I., Skachkov Y.P., Lesovik V.S. Quality control of building materials according to uncertainty of measurement and stability of the technological process of production. 1161:86-97. Available from: doi: 10.4028/www.scientific.net/SSP.299.1161.
- Perovskaya K., Petrina D., Pikalov E., Selivanov O. Polymer waste as a combustible additive for wall ceramics production. In: E3S Web of Conferences. 2019. Nо.91. Art. no. 04007. Available from: doi: 10.1051/e3sconf/20199104007.
- Vitkalova I., Torlova A., Pikalov E., Selivanov O. Development of environmentally safe acid-resistant ceramics using heavy metals containing waste. In: MATEC Web of Conferences. 2018. Nо. 193. Art. no. 03035.
