IPL Team Performance Analysis: A Multi-Criteria Group Decision Approach in Fuzzy Environment

Автор: Pabitra Kumar Dey, Dipendra Nath Ghosh, Abhoy Chand Mondal
Журнал: International Journal of Information Technology and Computer Science(IJITCS) @ijitcs
Статья в выпуске: 8 Vol. 7, 2015 года.
Бесплатный доступ
Now a day Cricket is one of the most popular sports around the world. Twenty-20 cricket is the most popular entertaining game in last eight to ten years among different formats of cricket. Indian Premier League (IPL) plays vital role to upturn the status of Twenty-20 cricket. This paper aims to analysis the team performances during first six sessions of IPL in the field of sports Data Mining. The proposed work deals with five different multi-criteria techniques and two group decision analysis in fuzzy environment to handle the imprecise and ambiguous data. The result shows that proposed model yields more realistic way to judge the team’s performance and every time it produces the accurate performance appraisal.
Gaussian Fuzzy-AHP, Group Decision, Spearman Correlation coefficient, Kendall Correlation coefficient, Performance Appraisal Introduction
Короткий адрес: https://sciup.org/15012352
IDR: 15012352
Текст научной статьи IPL Team Performance Analysis: A Multi-Criteria Group Decision Approach in Fuzzy Environment
Published Online July 2015 in MECS
In the early 70’s Multi-Criteria Decision Analysis (MCDA) was introduced as a promising and important field in data mining for both quantitative and qualitative evaluation criteria together to take truthful decision. Kavita Devi et al [1] used MCDA as a tool to solve problems for selection from a limited number of alternatives, involves sorting and ranking. The interattribute and intra-attribute comparison of MCDA was proposed by [2]. Some of the commonly used MCDA techniques like Weighted Sum Method (WSM), Technique for Order Preference by Similarity to Ideal Solution (TOPSIS), Analytical Hierarchy Process (AHP), PROMETHEE, ELECTRE etc was described in [3]. AHP is a pair-wise comparison method that involves structuring multiple choice criteria into a hierarchy for assessing the relative importance of these criteria developed by Thomas L. Saaty in early 80’s [4, 5]. TOPSIS, based on the idea that the chosen alternative should have the shortest distance from the positive ideal solution and on the other side the farthest distance of the negative ideal was first developed by Hwang and Yoon [6]. COmplex PRoportional ASsessment (COPRAS) method, used for multi-criteria evaluation of both maximizing and minimizing criteria values was first developed by Kaklauskas in 1996 [7]. In 1998, [8] initiated a new technique known as VIKOR for determining the compromise solution for a problem with contrasting criteria to reach the final solution. Brans and Vincke [9] proposed a new technique named as Preference Ranking Organization METHod for Enrichment of Evaluations (PROMETHEE) at the beginning of the 1980s. Several MCDA provide different ranking for the same problem which is the major shortcomings of MCDA. Earlier we proposed a new mathematical model namely as Modified Group Decision Analysis (MGDA) [10] to overcome the main limitation of MCDA. Now in this paper we introduce Gaussian Fuzzy numbers to handle the uncertainty and ambiguous decision of expert opinion with five methods together to form a new model which is more accurate than the earlier MGDA technique.
People of India are fascinated with the game of cricket among all the games played in India. Twenty-20, the shorter format of cricket is the most popular entertainment sports in India. IPL was initiated in the year 2008 with 8 teams by the Board for Control of Cricket in India (BCCI) [11, 12]. IPL provides a great platform for every cricketers to fulfill their dreams. A graphical display for comparing the performances of bowlers, batsmen and all-rounders have been presented by Paul J.van.Staden [13]. The valuation of players in the IPL has been calculated by David Parker and et al. [14]. H.H. Lemmer proposed several techniques for assessing the performance of bowlers, batsmen [15, 16, 17]. Individual performance of the players and the overall performance of the teams are easily measured by our proposed methodology.
The paper is organized as follows: Section 2 focuses on the different terminologies that are used to judge the players and the dataset preparation for team performance analysis. Section 3 discusses about the techniques used and discussed the proposed methodology. Result and Discussion are carried out on section 4. In section 5 group decision techniques are discussed. Finally, section 6 concludes the paper.
-
At first we collect the original dataset from open source of information for the last six year of IPL starting from 2008 and ended with the year 2013. The table 1 displays single dataset of the teams for the starting year 2008.
Table 1. Dataset of the team in IPL for the year 2008.
|
Pos |
Team |
Mat |
Won |
Lost |
Tied |
N/R |
Net RR |
For |
Against |
Pts |
|
1 |
RR |
14 |
11 |
3 |
0 |
0 |
0.632 |
2245/261.1 |
2153/270.2 |
22 |
|
2 |
KXIP |
14 |
10 |
4 |
0 |
0 |
0.509 |
2352/259.5 |
2271/265.5 |
20 |
|
3 |
CSK |
14 |
8 |
6 |
0 |
0 |
-0.192 |
2241/264.2 |
2195/253.1 |
16 |
|
4 |
DD |
14 |
7 |
6 |
0 |
1 |
0.342 |
2001/233.2 |
2031/246.4 |
15 |
|
5 |
MI |
14 |
7 |
7 |
0 |
0 |
0.57 |
2080/249.1 |
2096/269.3 |
14 |
|
6 |
KKR |
14 |
6 |
7 |
0 |
1 |
-0.147 |
1845/242.4 |
1718/221.4 |
13 |
|
7 |
RCB |
14 |
4 |
10 |
0 |
0 |
-1.16 |
1983/272.4 |
2205/261.3 |
8 |
|
8 |
DC |
14 |
2 |
12 |
0 |
0 |
-0.467 |
2229/270.0 |
2307/264.3 |
4 |
1st Semi Final DD (87/10) vs RR (192/9)
2nd Semi Final CSK (116/1) vs KXIP (112/8) Final CSK (163/5) vs RR (164/7)
Several multiple criteria are involved to judge a team’s performance accurately and we consider the following multiple criteria for team performance analysis
Mat – Total match played by a team in IPL from 2008 to 2013.
Won – (No. of matches won by a team) / (Total match played).
Lost – (No. of matches lost by a team) / (Total match played).
For (RR) – (Total runs made by a team / Total no. of overs taken to make the runs).
Against (RR) – (Total runs given by a team / Total no. of overs bowled).
NRR – For (RR) – Against (RR).
Margin –Team won by how many runs or by how many wickets in a winning match from the losing team.
WM – Total Margin / Total match played.
AWAY – Total match won in away condition / Total match played.
Important match – Quarter Final, Semi Final, Final matches are considered as important matches.
IMP – (Total win of important match) – (Total loss of important match).
With the above multiple criteria we prepared the overall team dataset from year 2008 to year 2013 is as follows in the table 2:
Table 2. Prepared Dataset from 2008 to 2013.
|
Team ID |
Team |
Mat |
won |
lost |
NRR |
WM |
AWAY |
IMP |
|
1 |
CSK |
100 |
0.59 |
0.39 |
0.45 |
2.28 |
0.32 |
4 |
|
2 |
DC/SRH |
93 |
0.42 |
0.57 |
-0.16 |
1.37 |
0.29 |
-1 |
|
3 |
DD |
92 |
0.46 |
0.52 |
-0.12 |
2.08 |
0.3 |
-4 |
|
4 |
KKR |
91 |
0.46 |
0.51 |
-0.03 |
1.69 |
0.24 |
1 |
|
5 |
KXIP |
89 |
0.49 |
0.51 |
-0.08 |
1.86 |
0.28 |
-1 |
|
6 |
MI |
96 |
0.58 |
0.41 |
0.39 |
2.55 |
0.28 |
0 |
|
7 |
RCB |
95 |
0.51 |
0.47 |
-0.06 |
2.1 |
0.29 |
-1 |
|
8 |
RR |
92 |
0.53 |
0.45 |
0.11 |
2.4 |
0.26 |
2 |
|
9 |
PWI |
46 |
0.3 |
0.7 |
-0.62 |
0.94 |
0.17 |
-6 |
|
10 |
KTK |
14 |
0.29 |
0.64 |
-0.13 |
1.59 |
0.21 |
-6 |
Some useful techniques are defined before we describe our proposed methodology for measuring the team performance. Analytical Hierarchy Process (AHP) is used to calculate the relative importance between the criterion based on expert opinion with the help of Saaty’s 9-point linear scale and the detailed steps of AHP was described in our previous work named as “Modified Group Decision Algorithm for Performance Appraisal of Indian
Premier League Cricketers” [10]. Saaty’s AHP method was modified by introducing the fuzzy analysis by
Chang’s in 1992 [18] and the main drawback of Chang’s extent analysis is that the degree of possibility of some criteria was zero. To overcome this limitation Hesham A and et. al. used Gaussian fuzzy number insist of triangular fuzzy number [19] and we modified the steps of Hesham’s Gaussian extent to calculate the relative importance between criteria with the help of the following flowchart:

Use Gaussian function with width a and а-cut to compute the triangular fuzzy number from crisp number by J—Ln(a) , U, =Mi -t-crxJ— Into)
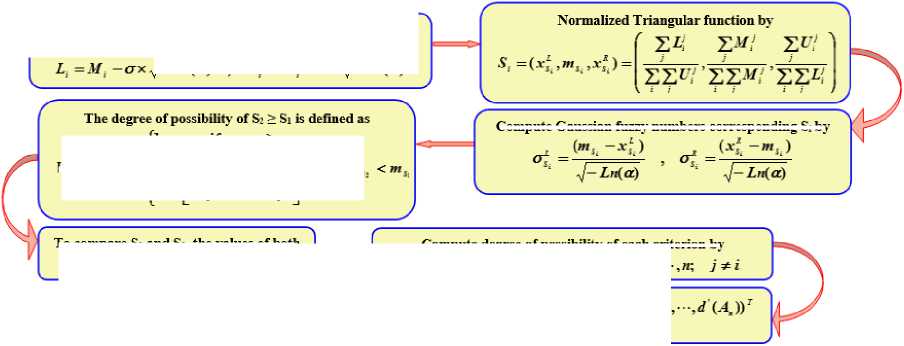
Compute Gaussian fuzzv numbers corresponding Si bv
Compute Weight Vector by П" = (J (Л>),^ (^h
Compute normalized weight vector
Fig. 1. Flowchart of Gaussian Fuzzy-AHP.
To compare Si and 02, the values of both V (S ? > Si) and V(Si > S2) are needed
Compute degree of possibility of each criterion by rf'U,)=mh r(S;>Sa for >=1,2.

Several MCDM methods like WSM, TOPSIS, COPRAS, VIKOR and PROMETHEE are used in our proposed methodology. The detailed steps of WSM, TOPSIS, COPRAS, VIKOR are described in our previous
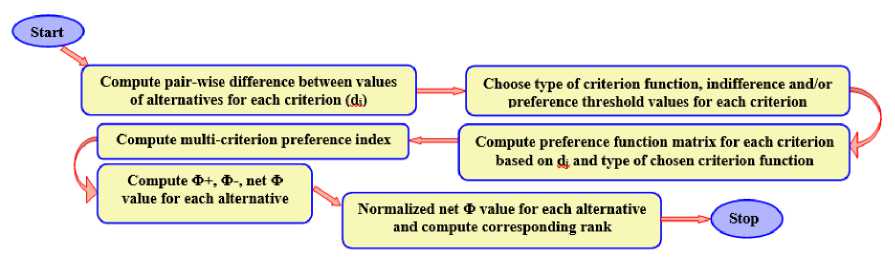
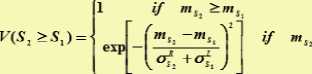
Fig. 2. Flowchart of PROMETHEE.
With the help of above techniques, Spearman and Kendall correlation and coefficient ranking method to calculate group decision multi criteria analysis we published research work named “Modified Group Decision Algorithm for Performance Appraisal of Indian Premier League Cricketers” [20]. The detailed steps of PROMETHEE are described by the following flowchart.
propose a new technique which provides the accurate result in every case and our proposed methodology is described in the following flowchart:

Introduce fuzzy Gaussian function to calculate low, mid, high of expert opinion
Apply modify Fuzzy Extent Analysis to calculate the weight of the criteria

Find Spearman Rank Correlation Co-efficient
Collect the dataset from open
Prepare the dataset
Calculate the relative importance
Establish
Co-efficient Matrix
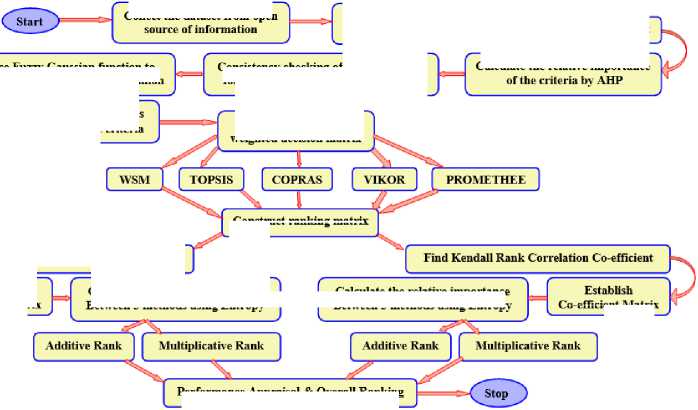
Construct ranking matrix
Lo-eilicient Matrix
Fig. 3. Proposed Methodology.
Select the important features based on expert view

Consistency checking of Expert opinion for relative importance of the criteria
Prepare normalized weighted decision matrix
Calculate the relative importance Between 5 methods using Eutropv
Calculate the relative importance Between 5 methods using Eutropv
After prepare the pay-off matrix we calculate the weights of the attribute by AHP. Then Gaussian fuzzy membership function is presented in [19] to overcome Saaty 9 point linear scale into fuzzy scale by considering original AHP decision input into low, mid, high decision and then we develop one modified technique of Chang’s extent analysis [18] to calculate more accurate importance relative between the attributes. The weights of the attribute calculating by AHP and Fuzzy-AHP
(FAHP) are shown in table 3 and ranking of different method are shown in table 4. The detailed result is shown in the appendix section.
Table 3. Attributes weight by AHP and Fuzzy-AHP.
|
Mat |
won |
lost |
NRR |
WM |
AWAY |
IMP |
|
|
AHP |
0.067 |
0.259 |
0.214 |
0.157 |
0.128 |
0.076 |
0.100 |
|
FAHP |
0.023 |
0.298 |
0.272 |
0.177 |
0.125 |
0.033 |
0.072 |
Table 4. Ranking of different method.
|
ID |
Team |
Prome -thee |
Rank |
WSM |
Rank |
Topsis |
Rank |
Copras |
Rank |
Vikor |
Rank |
|
1 |
CSK |
0.343 |
1 |
3.2451 |
1 |
0.9776 |
1 |
-0.4733 |
1 |
0 |
1 |
|
2 |
DC /SRH |
-0.0481 |
8 |
2.4997 |
6 |
0.4334 |
8 |
0.3544 |
9 |
0.5537 |
8 |
|
3 |
DD |
-0.0111 |
7 |
2.3552 |
8 |
0.4632 |
7 |
0.3535 |
8 |
0.4047 |
6 |
|
4 |
KKR |
0.0172 |
6 |
2.6547 |
4 |
0.5656 |
4 |
0.1689 |
4 |
0.4047 |
6 |
|
5 |
KXIP |
0.0201 |
5 |
2.4873 |
7 |
0.5215 |
6 |
0.266 |
6 |
0.3156 |
5 |
|
6 |
MI |
0.2753 |
2 |
2.8894 |
2 |
0.8793 |
2 |
-0.3487 |
2 |
0.0292 |
2 |
|
7 |
RCB |
0.0629 |
4 |
2.6543 |
5 |
0.5485 |
5 |
0.2495 |
5 |
0.2374 |
4 |
|
8 |
RR |
0.185 |
3 |
2.8684 |
3 |
0.7067 |
3 |
-0.0071 |
3 |
0.1445 |
3 |
|
9 |
PWI |
-0.5066 |
10 |
0.9192 |
9 |
0.0138 |
10 |
1 |
10 |
1 |
9 |
|
10 |
KTK |
-0.3377 |
9 |
0.3332 |
10 |
0.39 |
9 |
0.3468 |
7 |
1.0371 |
10 |
Table 6. Relative Closeness between the methods
|
V. Group Discussion Spearman Co-relation Co-efficient and Kendall Corelation Co-efficient between the methods are shown in table 5: |
PROM-ETHEE |
WSM |
TOPSIS |
COPRAS |
VIKOR |
|
|
Spearman |
0.2015 |
0.1980 |
0.2026 |
0.1983 |
0.1996 |
|
|
Kendall |
0.2019 |
0.1979 |
0.2037 |
0.1987 |
0.1978 |
Table 5. Correlation Coefficient Ranking by Spearman and Kendall
|
Spearman |
Promethee |
Wsm |
Topsis |
Copras |
Vikor |
|
PROM-ETHEE |
1 |
0.8667 |
0.95 |
0.9 |
0.975 |
|
WSM |
0.8667 |
1 |
0.9333 |
0.8333 |
0.8583 |
|
TOPSIS |
0.95 |
0.9333 |
1 |
0.95 |
0.925 |
|
COPRAS |
0.9 |
0.8333 |
0.95 |
1 |
0.825 |
|
VIKOR |
0.975 |
0.8583 |
0.925 |
0.825 |
1 |
|
Kendall |
Promethee |
Wsm |
Topsis |
Copras |
Vikor |
|
PROM-ETHEE |
1 |
0.7778 |
0.9111 |
0.8222 |
0.9556 |
|
WSM |
0.7778 |
1 |
0.8667 |
0.7778 |
0.8222 |
|
TOPSIS |
0.9111 |
0.8667 |
1 |
0.9111 |
0.8667 |
|
COPRAS |
0.8222 |
0.7778 |
0.9111 |
1 |
0.7778 |
|
VIKOR |
0.9111 |
0.7778 |
0.8222 |
0.7333 |
1 |
Calculate the relative closeness between the methods by entropy in both the correlation coefficient methods which is shown in the table 6.
Table 7. Additive and Multiplicative Ranking of the teams
|
Kendall |
Spearman |
||||
|
Team ID |
Team |
Add. Rank |
Mul. Rank |
Add. Rank |
Mul. Rank |
|
1 |
CSK |
1 |
1 |
1 |
1 |
|
2 |
DC/SRH |
8 |
8 |
8 |
8 |
|
3 |
DD |
7 |
7 |
7 |
7 |
|
4 |
KKR |
5 |
5 |
5 |
5 |
|
5 |
KXIP |
6 |
6 |
6 |
6 |
|
6 |
MI |
2 |
2 |
2 |
2 |
|
7 |
RCB |
4 |
4 |
4 |
4 |
|
8 |
RR |
3 |
3 |
3 |
3 |
|
9 |
PWI |
10 |
10 |
10 |
10 |
|
10 |
KTK |
9 |
9 |
9 |
9 |
The ultimate ranking of the teams is same for additive ranking and multiplicative ranking in both Spearman and Kendall correlation coefficient which confirm the fruitfulness of our proposed method and this new model overcome the main drawbacks of MCDM method that different techniques provide different ranking for the same set of problems.
According our new model it is very much clear that in all six years of IPL, the performance of CSK is very decent and consistent and after that the performance of MI is good. The overall performance of DC/SRH is not at all up to the mark although DC/SRH won the IPL cup in 2009. RCB still not win the title but its performance is very much consistent and they done well from the starting of IPL.
VI Conclusion
This article offers emerging idea in the field of multi criteria decision analysis in fuzzy environment by integrating few multi criteria techniques in a single model. This proposed work eliminate the main drawback of multi-criteria decision analysis that is different multi criteria methods provide different ranking for the same problem with same multiple attributes and same multiple alternatives although same decision maker.
Cricket team performance measurement is done with this new model to get the precise result every time. Fuzzy membership handles the uncertainty and improper judgment of any linear scale pair-wise comparison between alternatives or attributes.
In every step of this mathematical model we check the accuracy in terms of consistency checking or correlation between intermediate methods or calculate the overall additive or multiplicative ranking. In this model both Spearman and Kendall correlation coefficient methods are used to find the relative closeness between the different MCDM methods and the result of this work shows that the new model is scientifically and mathematically error free and produce precise outcome in every time.
This new model helps the decision maker to make their error free decision in very systematic way irrespective of any specific field of multi criteria.
Список литературы IPL Team Performance Analysis: A Multi-Criteria Group Decision Approach in Fuzzy Environment
- Devi, K., Yadav, S.P. and Kumar, S., Extension of fuzzy TOPSIS method based on vague sets, International Journal of Cmputaional Cognition, Vol. 7(4), pp:58-62, 2009.
- Carlsson, C., and Fuller, R., (1996). Fuzzy multiple criteria decision making: Recent development 139-153.
- Muralidharan C., (2000), Application of Analytic Hierarchy Process (AHP) in materials and human resource management under group decision making environment, Unpublished Ph.D. Thesis, Annamalai University.
- Saaty, T. L.,The Analytic Hierarchy Process, McGraw-Hill, New York, 1980.
- Saaty, T. L., "Priority Setting in Complex Problems," IEEE Transactions on Engineering Management, Vol.30, No.3, pp.140-155, 1983.
- Hwang, C.L., Yoon, K., “Multiple Attribute DecisionMaking Methods and Applications”, Springer, BerlinHeidelberg, 1981.
- Kaklauskas, A.,. Zavadskas, E.K., Multicriteria Evaluation of Building. Vilnius: Technika. (1996).
- Opricovic, S., Multicriteria Optimization of Civil Engineering Systems, Faculty of CivilEngineering, Belgrade (1998).
- Brans, J.P. and Vincke, P., "A preference ranking organisation method: The PROMETHEE method for MCDM". Management Science. (1985).
- Dey, P.K., Ghosh, D.N. and Mondal, A.C., “Modified Group Decision Algorithm for Performance Appraisal of Indian Premier League Cricketers”, in WSEAS Transactions on Information Science and Applications (WSEAS- ToISA), E-ISSN: 2224-3402, Vol. 10, Issue 10, October-2013, pp: 325-333.
- Blog: http://premierleaguecricket.in
- http://en.wikipedia.org/wiki/Indian_Premier_League
- Staden, P.J. van, “Comparison of Bowlers, Batsmen and All-rounders in Cricket using Graphical Displays”, Technical Report of University of Pretoria, 08 01, ISBN: 978 1 86854 733 3.
- Parker, D., Burns, P. and Natarajan, H., “Player Valuations in the IndianPremier League”, Frontier EconomicsOctober 2008.
- Lemmer, H.H., “The Combined Bowling Rate as a Measure of Bowling Performance in Cricket”, South African Journal for Research in Sport, Physical Education and Recreation, Vol. 24, No. 2, pp.37-44, 2002.
- Lemmer, H.H., “A Measure for the Batting Performance of Cricket Players”, South African Journal for Research in Sport, Physical Education and Recreation, Vol. 26, No. 1, pp.55-64, 2004.
- Lemmer, H.H., “The Allocation of Weights in the Calculation of Batting and Bowling Performance Measures”, South African Journal for Research in Sport, Physical Education and Recreation, Vol. 29, No. 2, pp.75-85, 2007.
- Chang D. Extent analysis and synthetic decision. Optimization techniques and applications, vol. 1. Singapore: World Scientific;1992, p. 352.
- Hefny, H.A., Elsayed, H.M., Aly, H.F., “Fuzzy multi-criteria decision making model for different scenarios of electrical power generation in Egypt”, Egyptian Informatics Journal (2013) Vol. 14, pp.125–133, 2013.
- IPL, http://iplt20.com/.
- Spearman, C. (1904). "The proof and measurement of association between two things". Amer. J. Psychol. 15: 72–101. doi:10.2307/1412159.
- Kendall, M.G., Rank correlation methods (4th ed.). London: Griffin. ISBN 978-0-852-6419-96. OCLC 136868. (1970).
